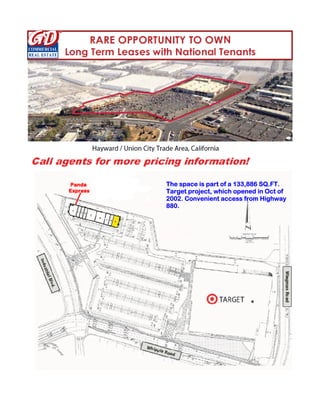
This document summarizes key demographic and economic information about the area within a 1, 3, and 5 mile radius of Whipple Rd & Industrial Pkwy Sw in Hayward, CA. Some key facts presented include:
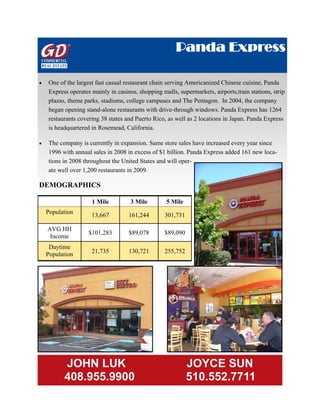
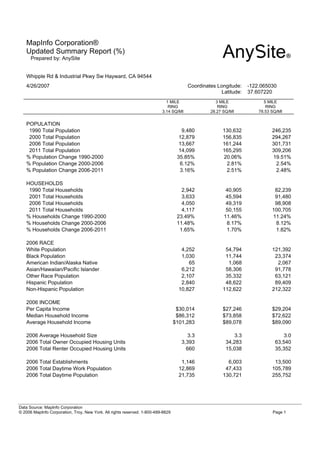
- The total population within 1, 3, and 5 miles was estimated to be 13,667, 161,244, and 301,731 respectively in 2006.
- The median household income in 2006 was $86,312 within 1 mile, $73,858 within 3 miles, and $72,622 within 5 miles.
- The largest racial group was Asian/Hawaiian/Pacific Islander, estimated at 6,212 people within 1 mile in 2006.