- The presentation provides an overview of Cross Country Healthcare's Q2 2019 financial results and outlook for Q3 2019. It discusses Cross Country Healthcare's business segments, growth strategies, and market opportunities.
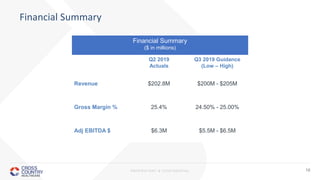
- Cross Country Healthcare reported revenue of $202.8 million for Q2 2019 and expects revenue between $200-205 million for Q3 2019. Adjusted EBITDA was $6.3 million for Q2 2019 and is expected to be between $5.5-6.5 million for Q3 2019.
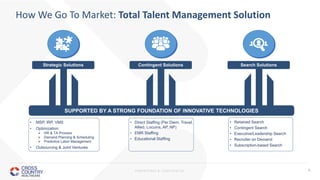
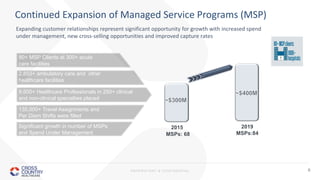
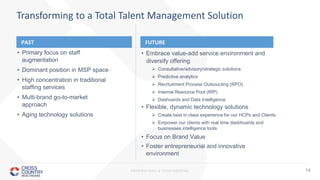
- The company aims to expand its managed service programs, diversify its service offerings, and strengthen client relationships to achieve consistent, sustainable growth above market rates.