![The globally averaged combined land and ocean surface
temperature data show a warming of 0.85 [0.65 to 1.08°C over the
period 1880-2012. The total increase between the average of the
1850-1900 period and the 2003-2012 period is 0.78 [0.72 to 0.85] °C.
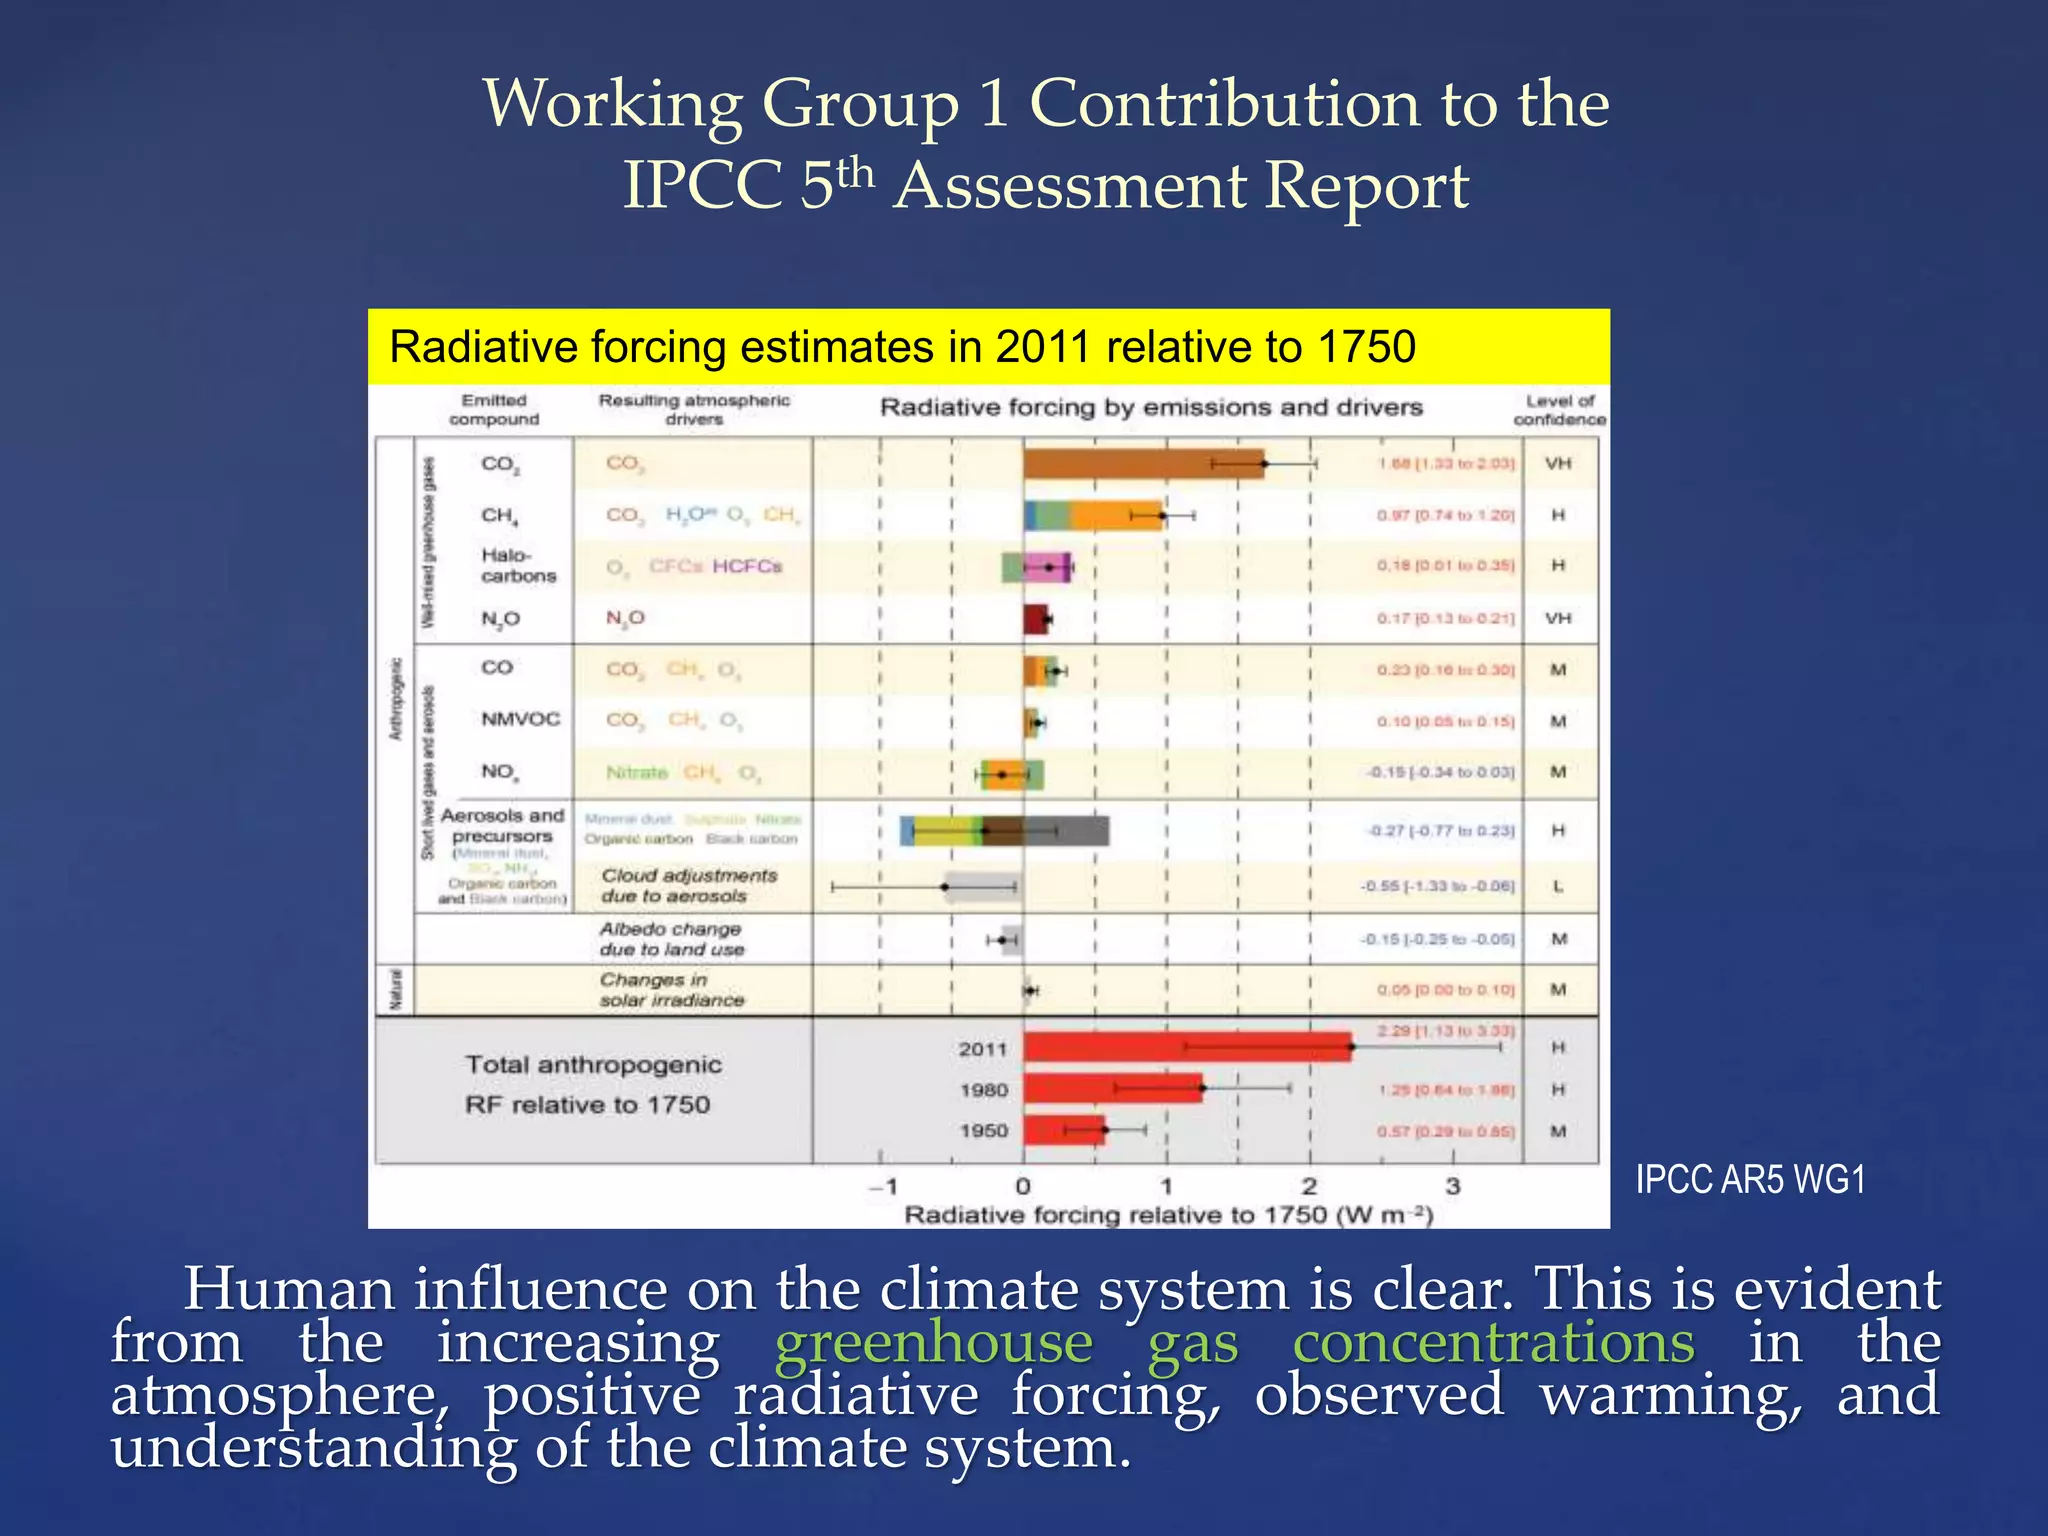
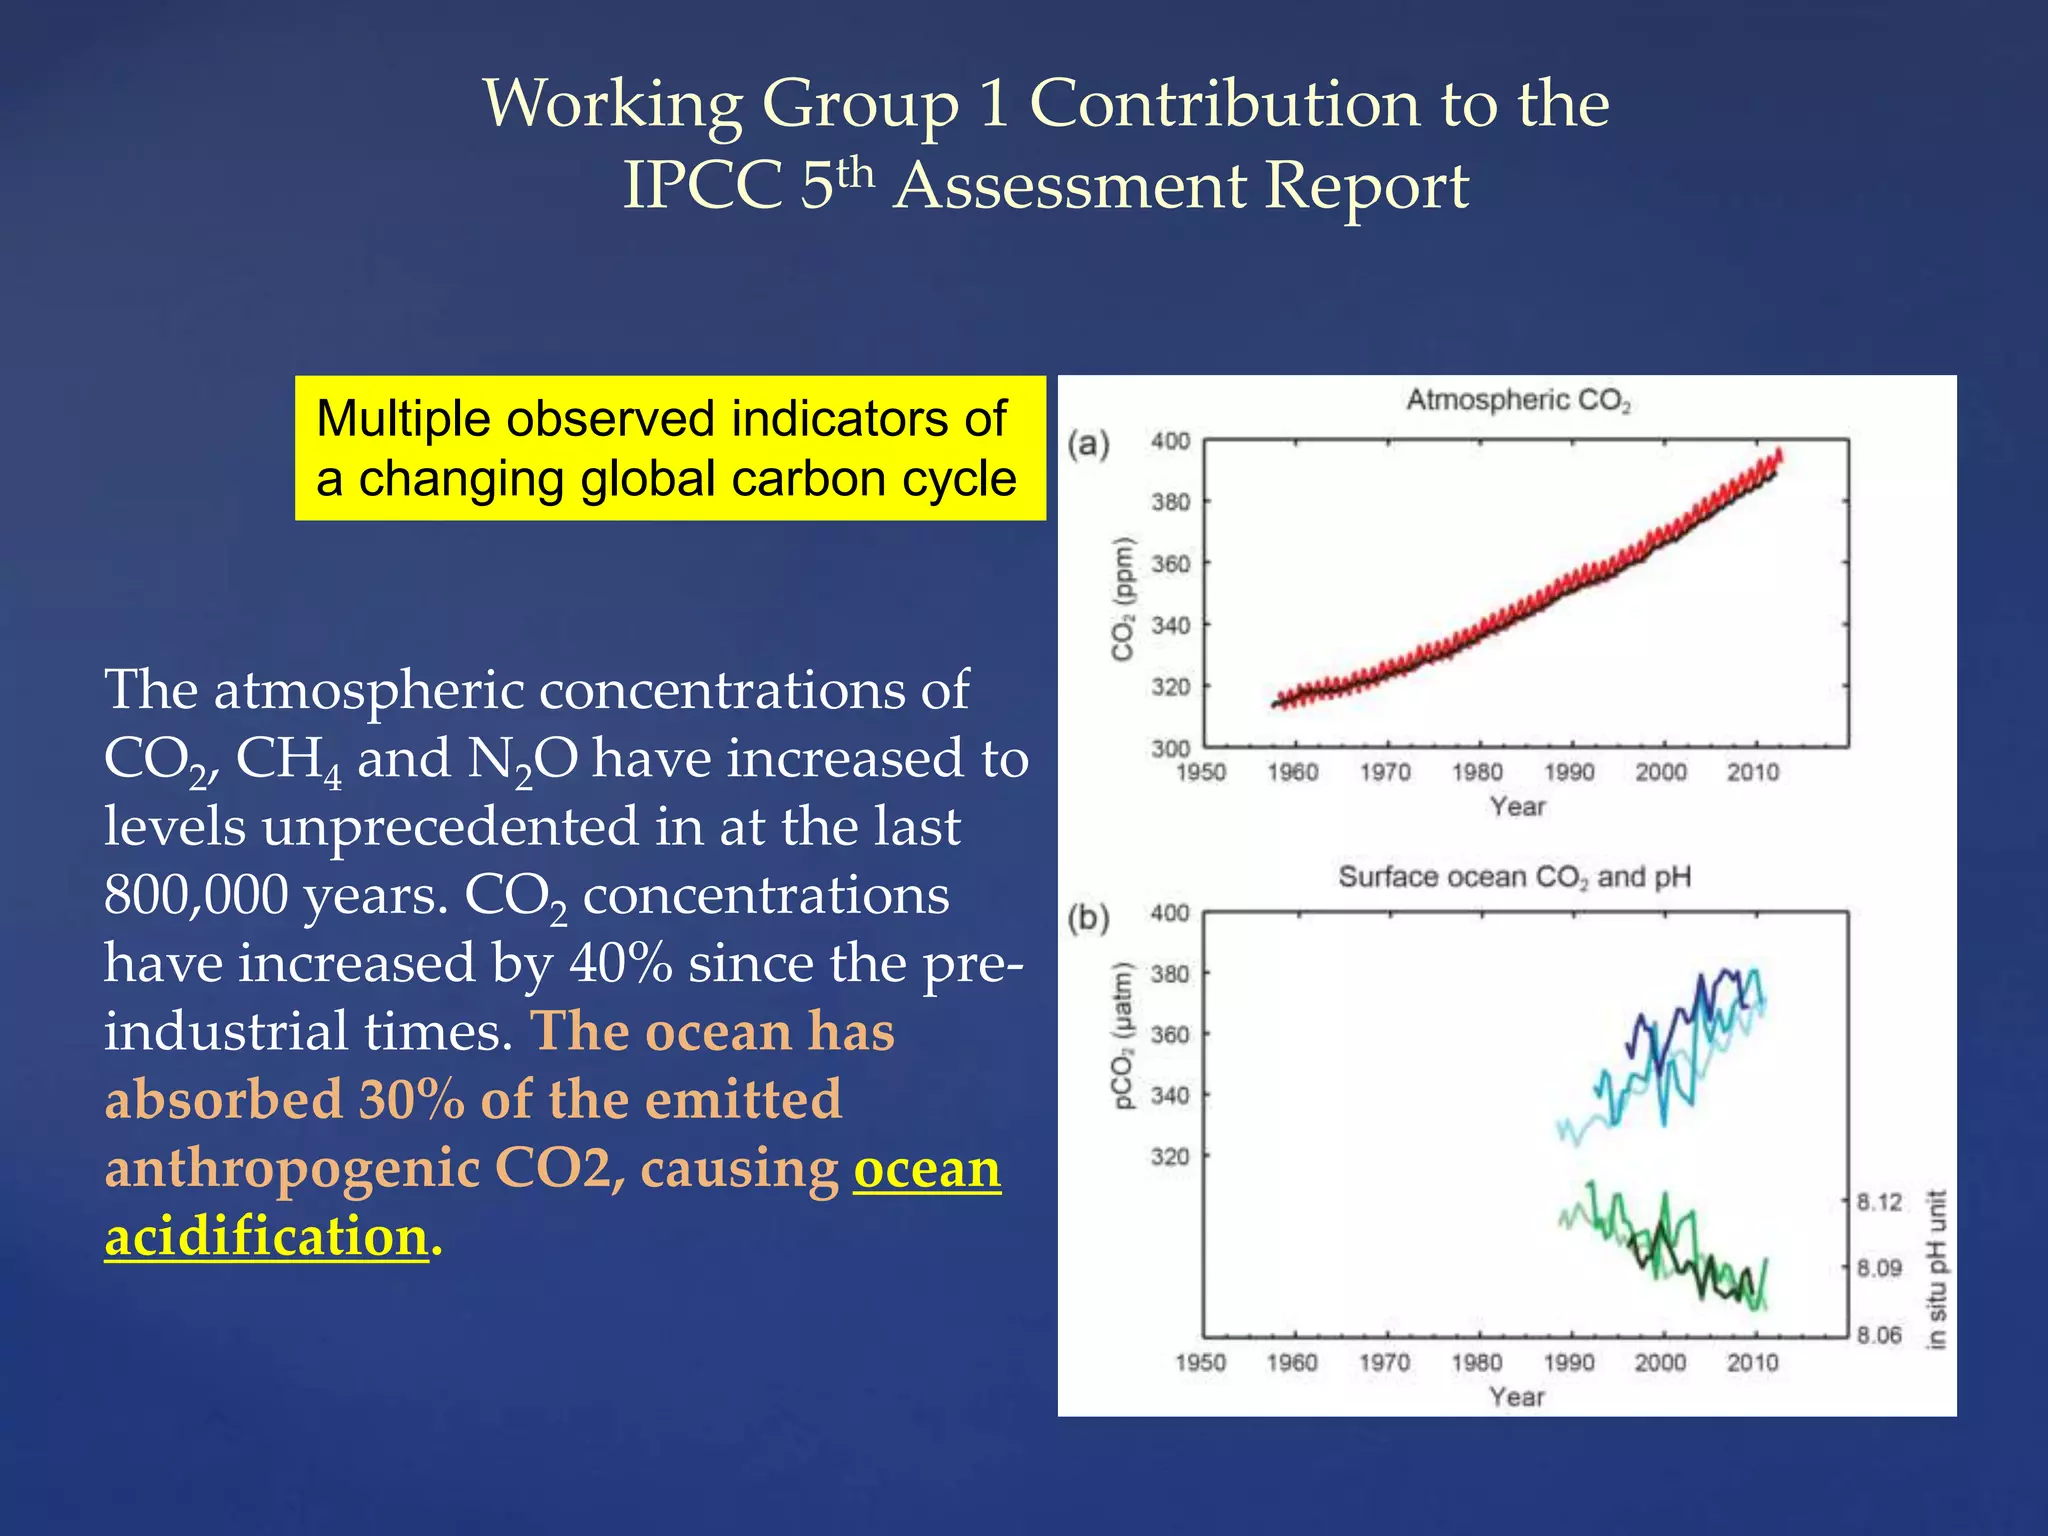
Working Group 1 Contribution to the
IPCC 5th Assessment Report
Observed globally averaged
combined land and ocean
surface temperature
anomaly 1850-2012
IPCC AR5 WG1](https://image.slidesharecdn.com/ccaphilsettingpagbaapr2014-140804014831-phpapp02/75/Cca-phil-setting-pagba-apr2014-5-2048.jpg)
![ The rate of sea level rise since the
mid-19th century has been larger
then the mean rate during the
previous two millennia. Over the
period 1901 to 2010, global mean
sea level rose by 0.19 [0.17 to .21]
meters.
Sea level rise will occur mostly as a
result of the thermal expansion of
warming ocean waters, the influx of
freshwater from melting glaciers and
ice, and vertical movements of the
land itself.
IPCC AR5 Working Group 1
Global Mean Sea Level Rise
Working Group 1 Contribution to the
IPCC 5th Assessment Report](https://image.slidesharecdn.com/ccaphilsettingpagbaapr2014-140804014831-phpapp02/75/Cca-phil-setting-pagba-apr2014-6-2048.jpg)
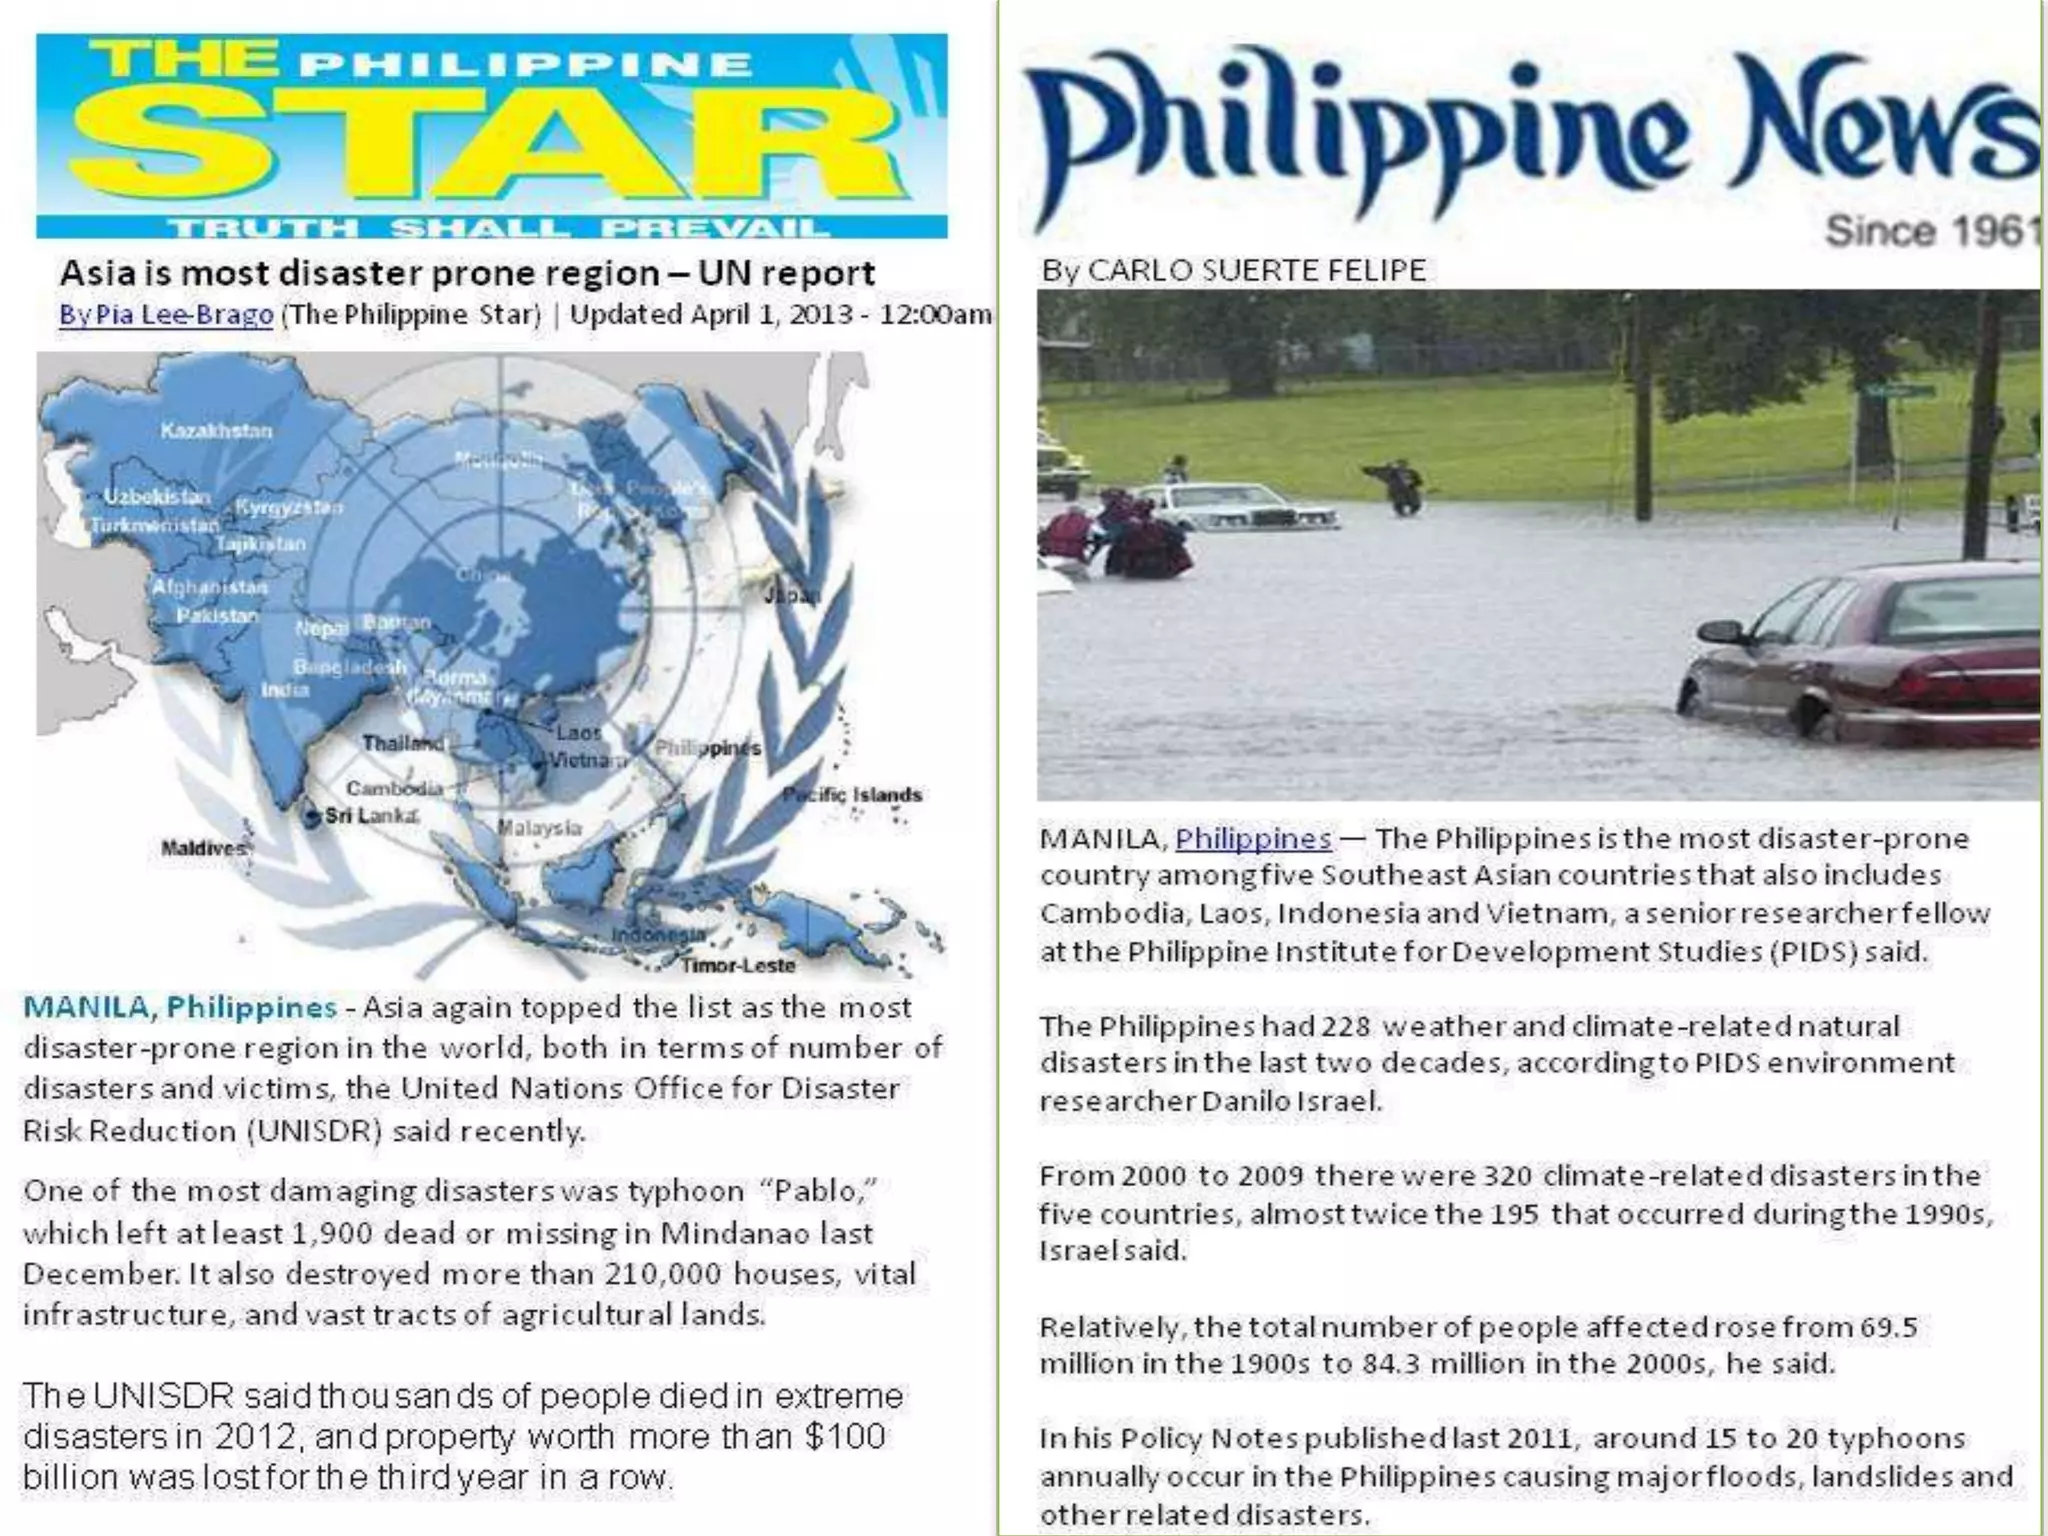

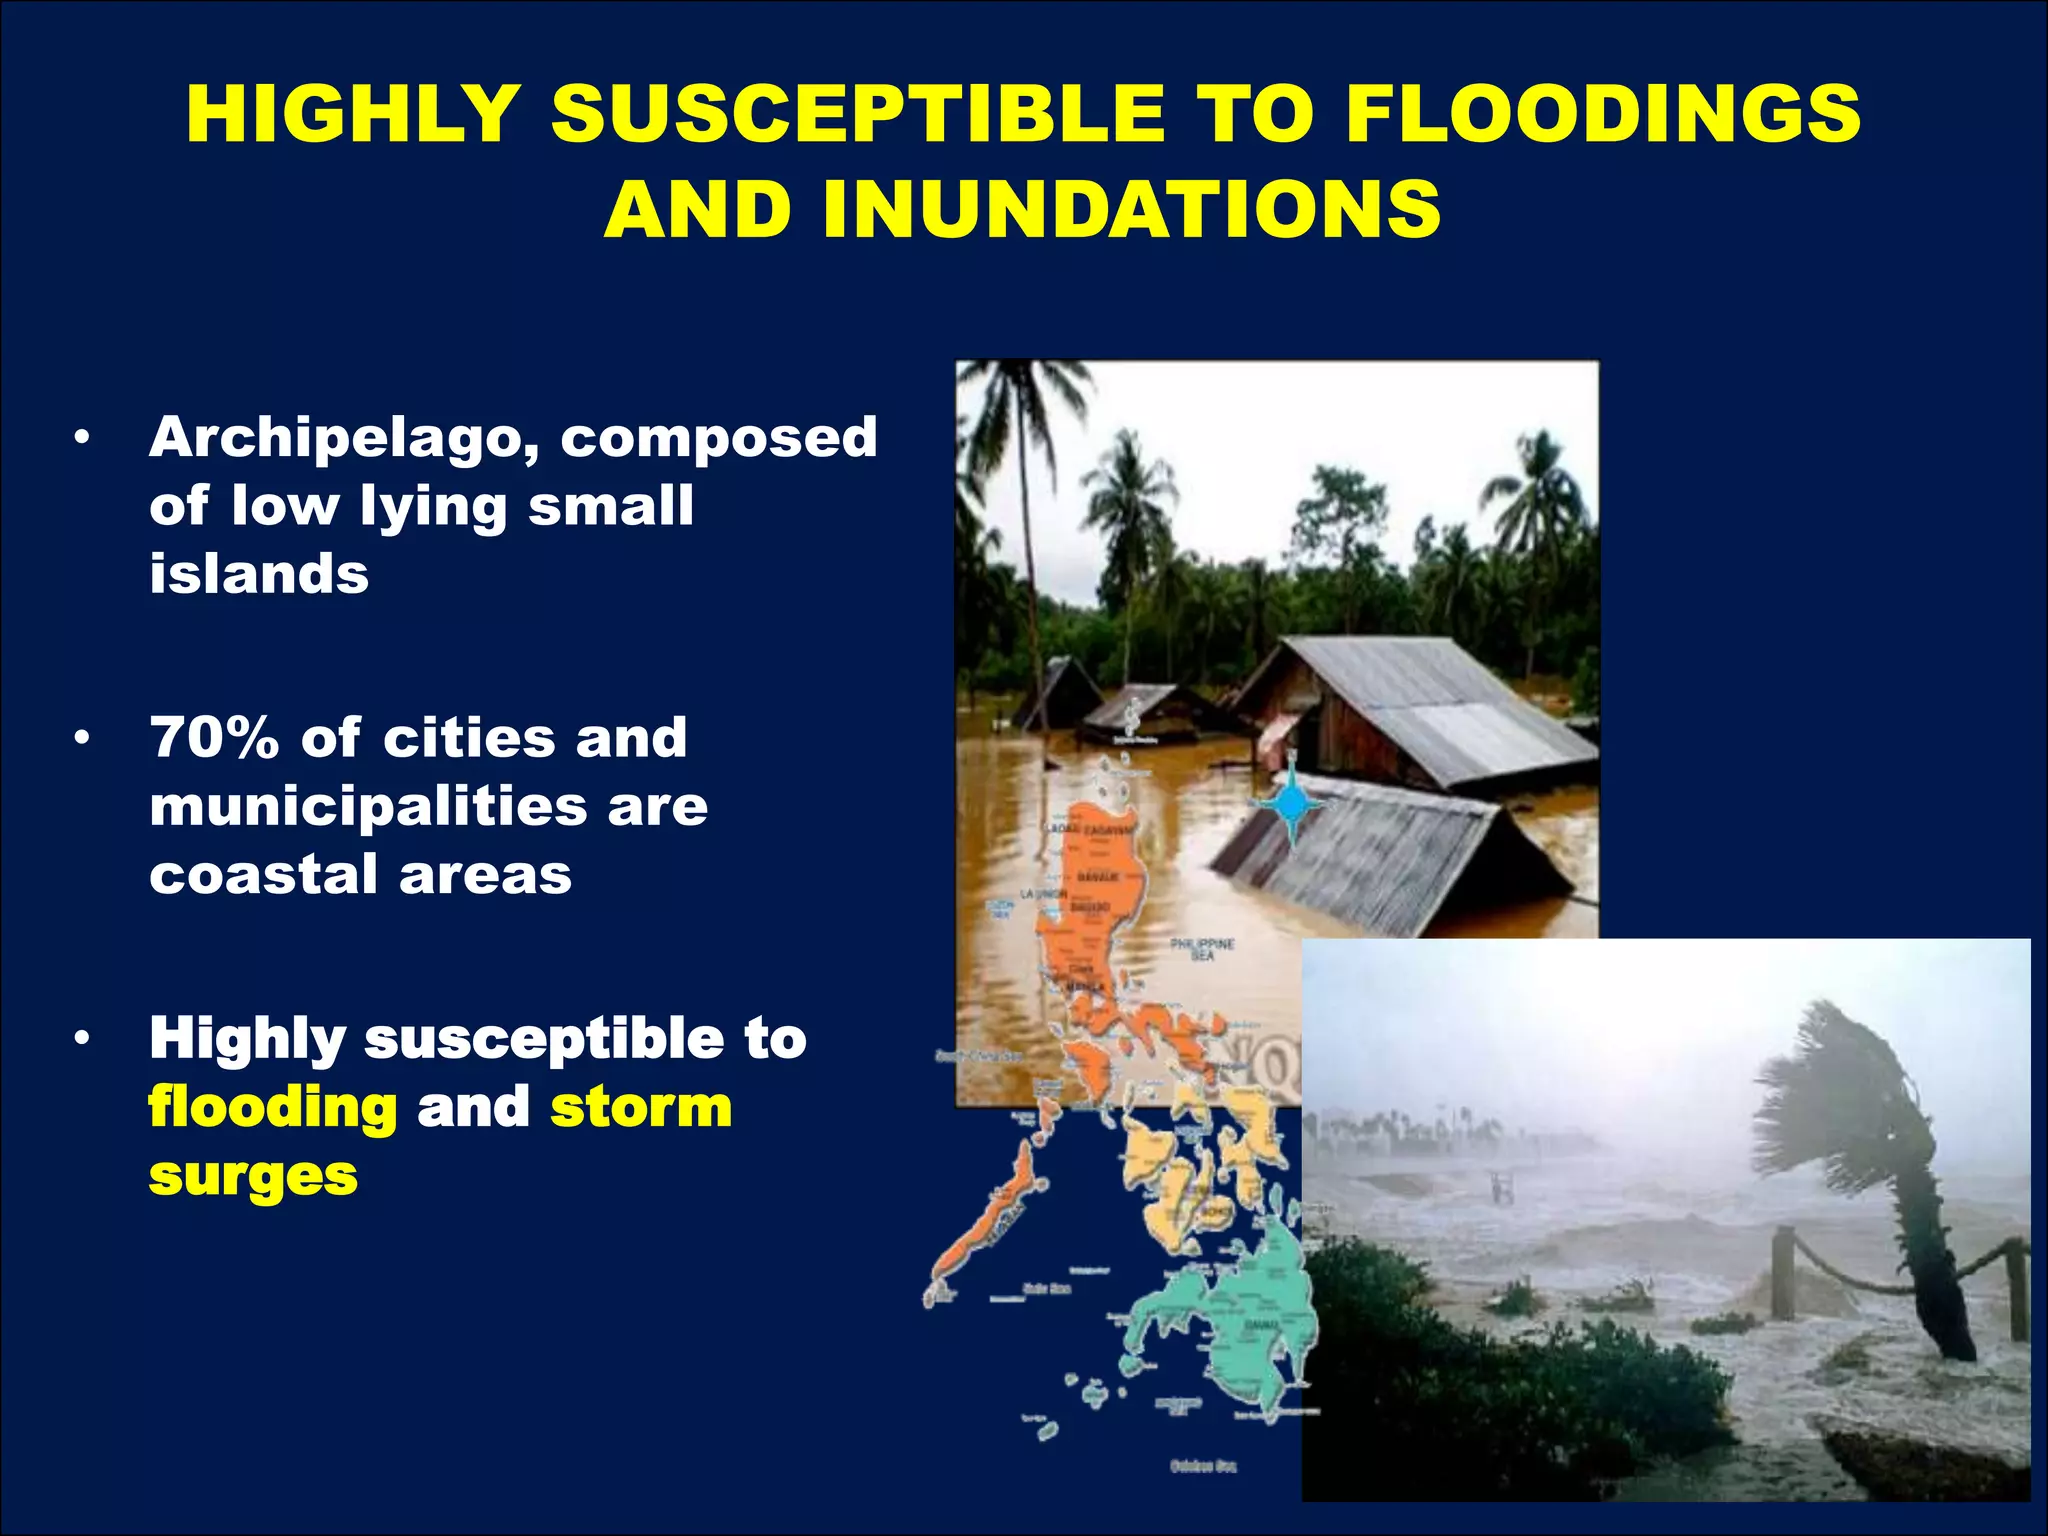
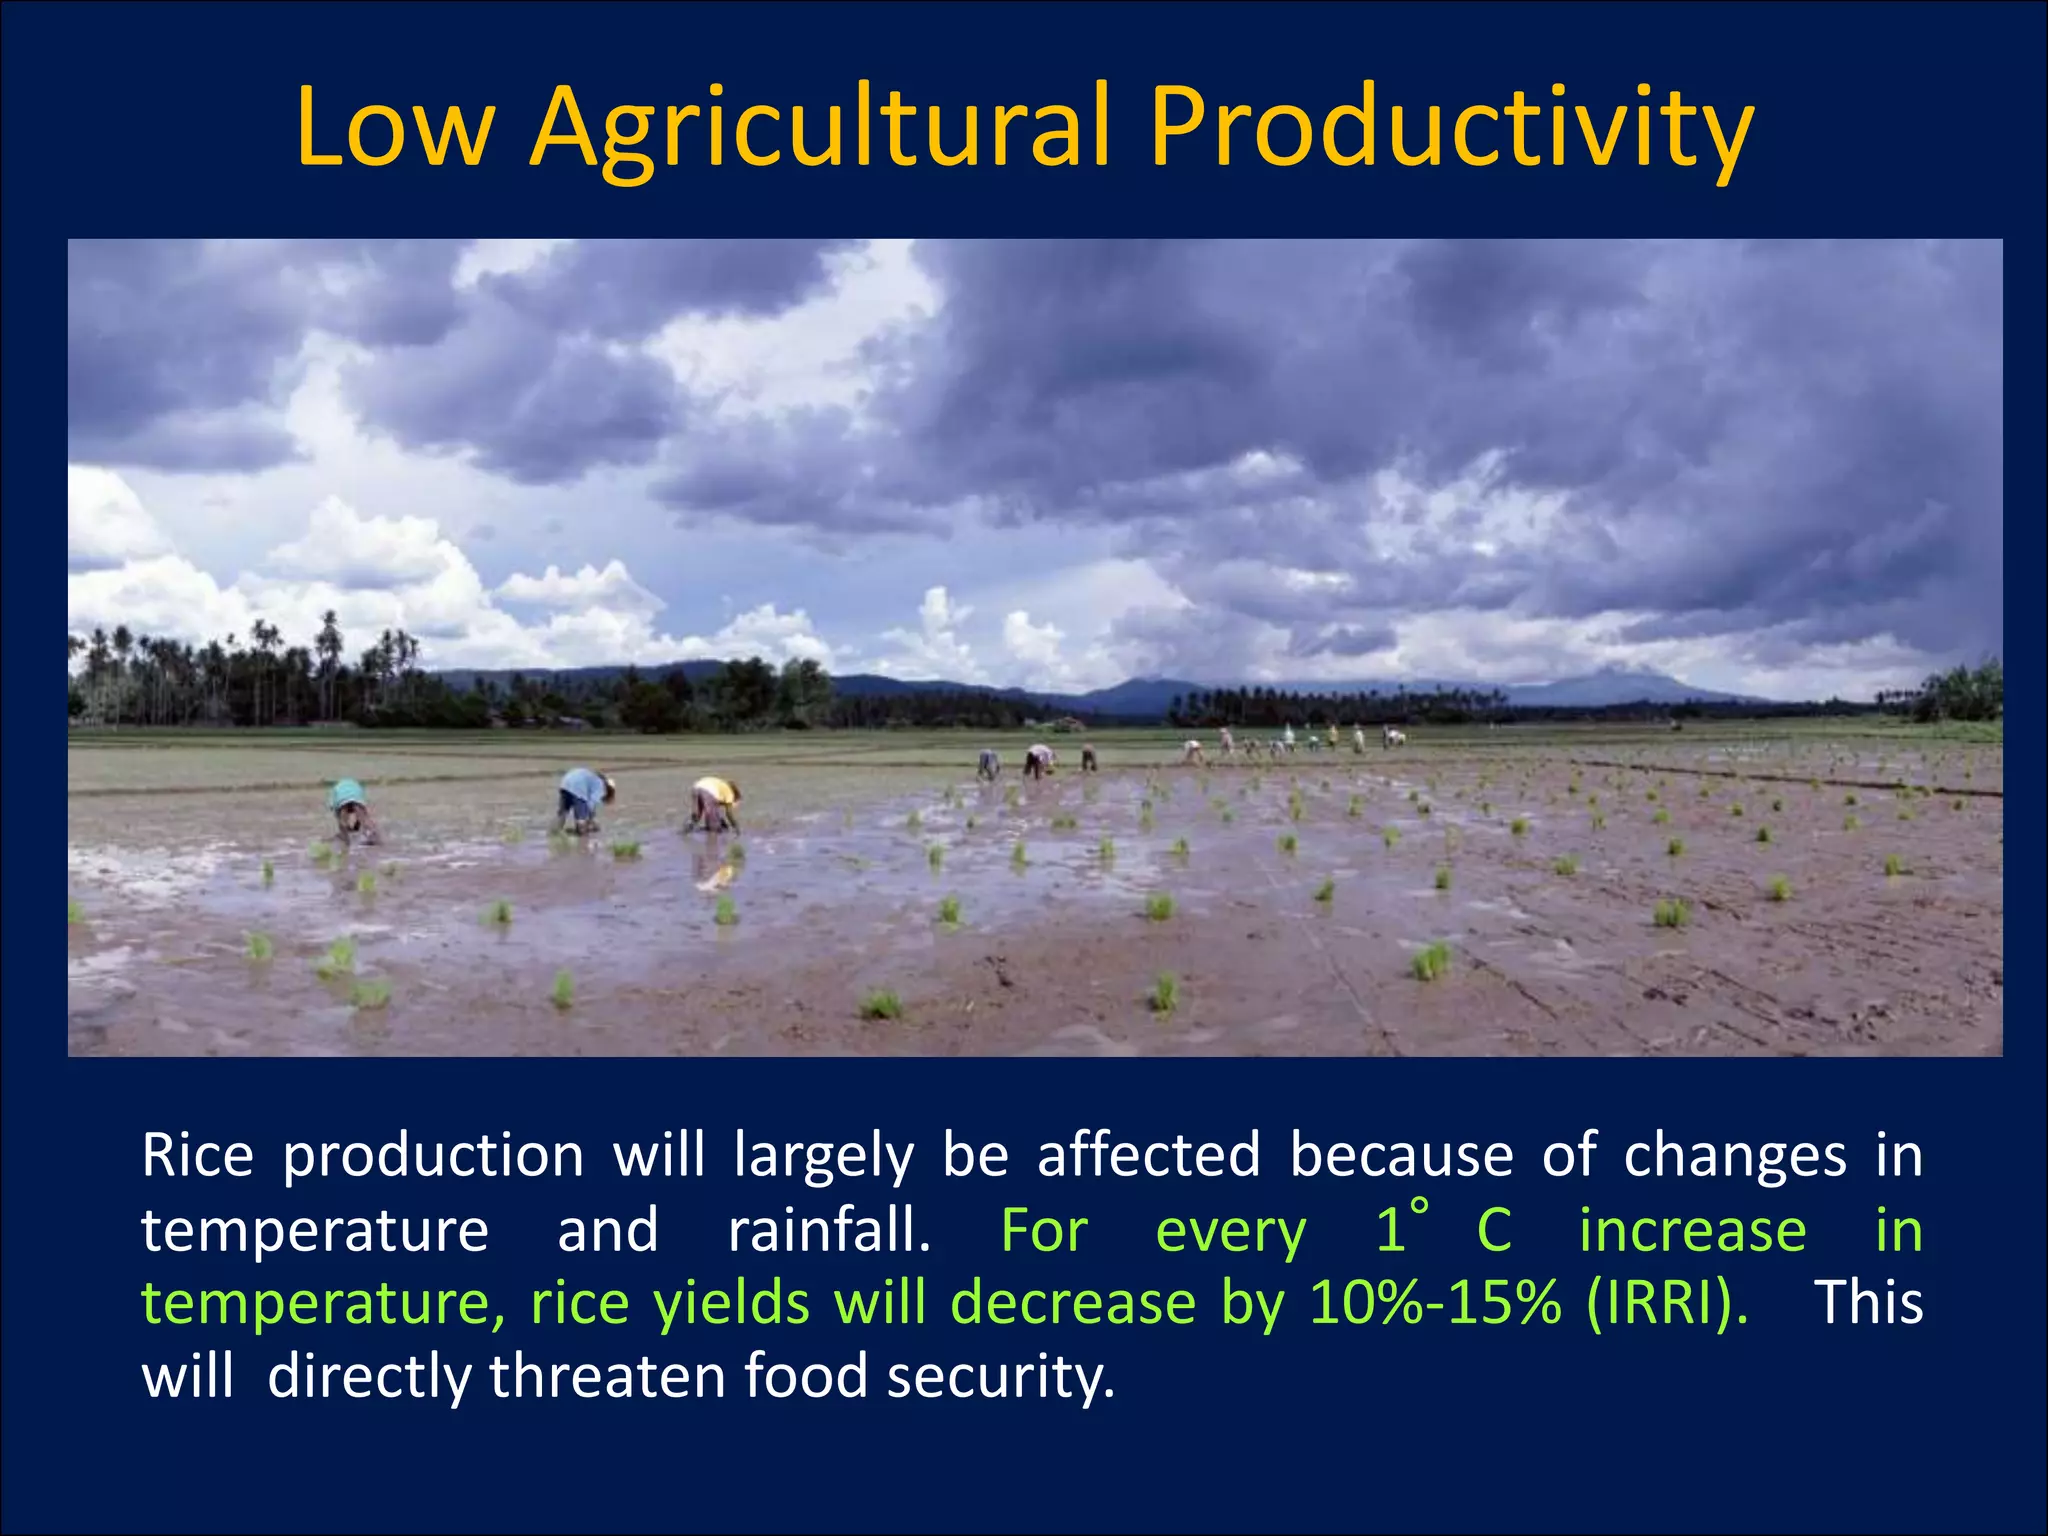
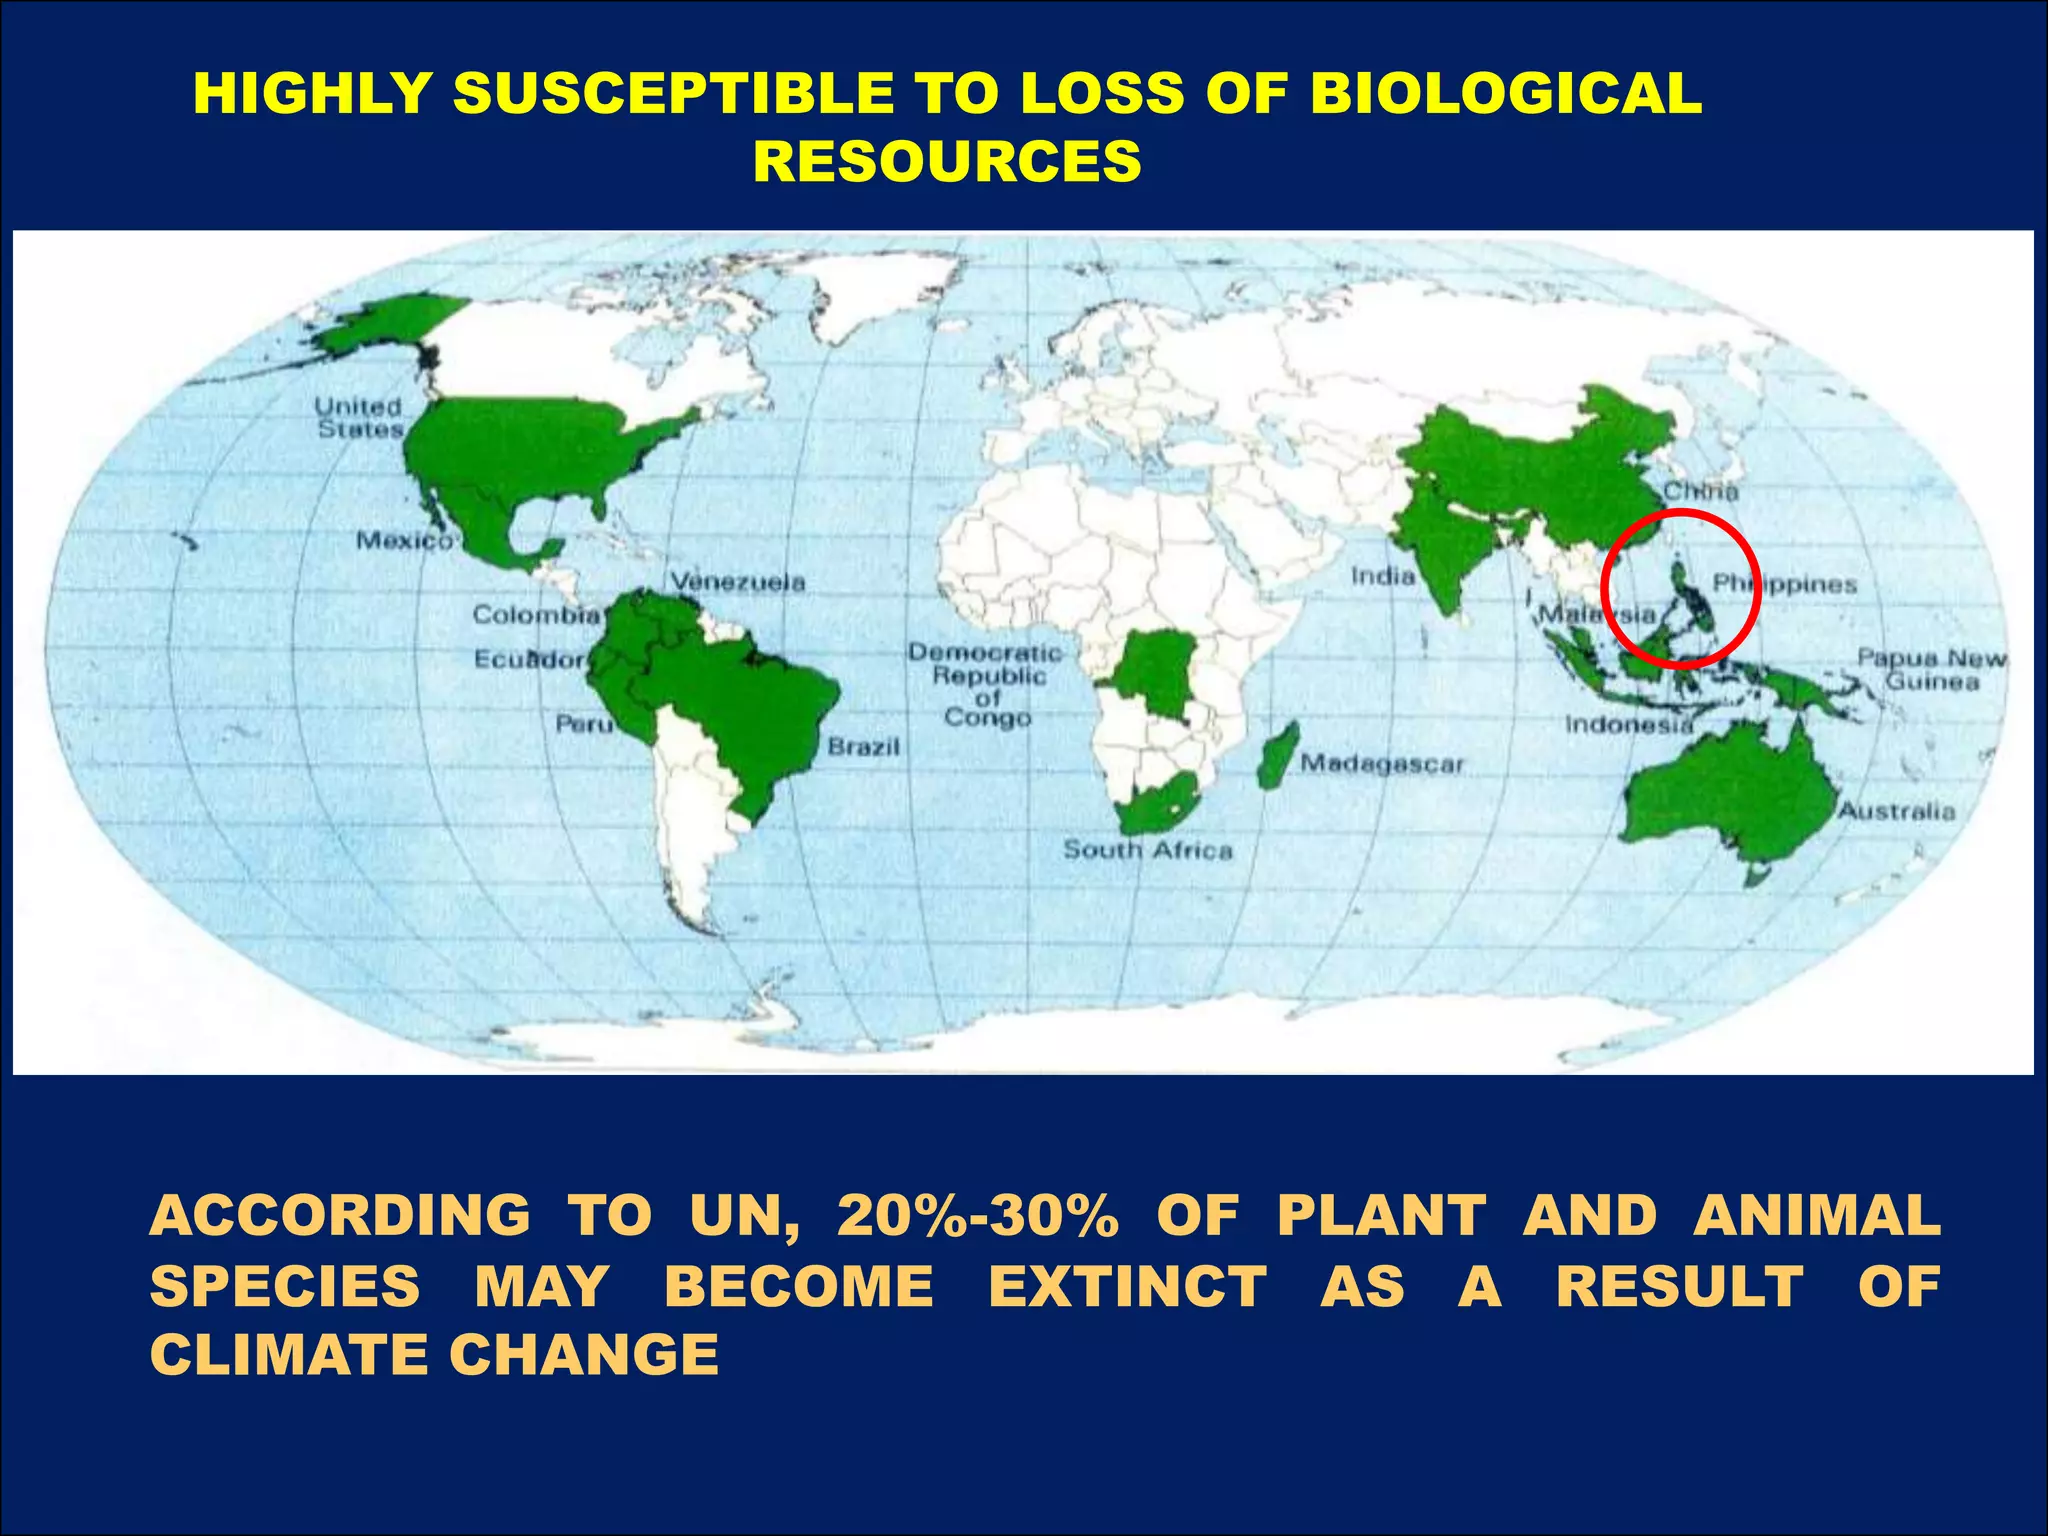
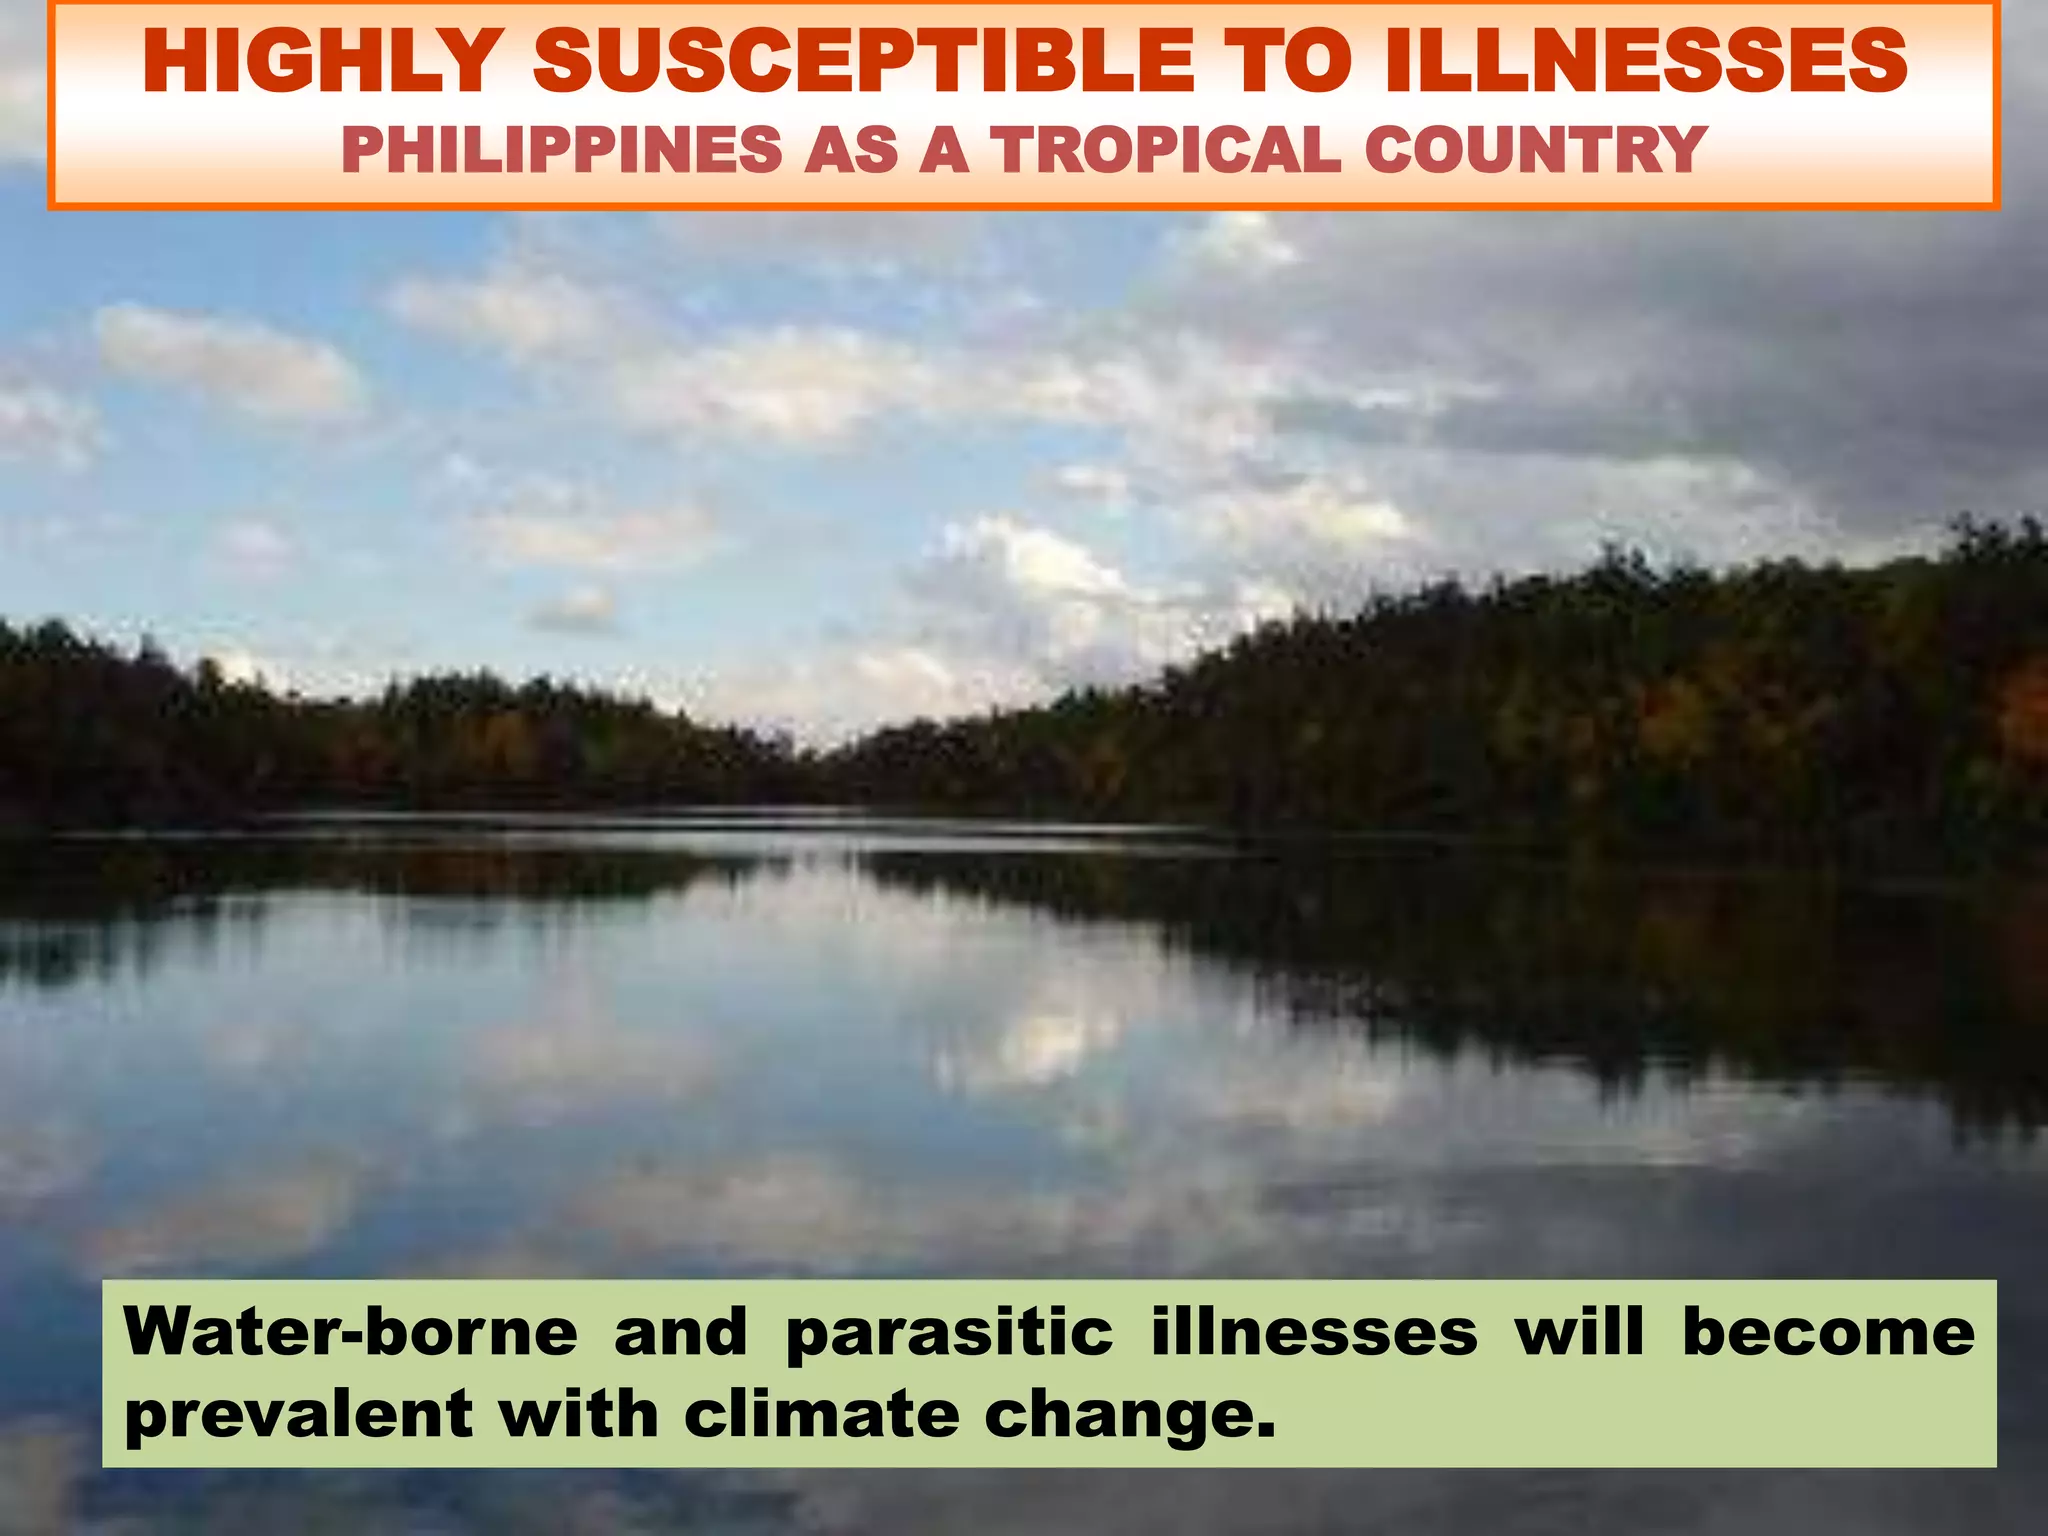
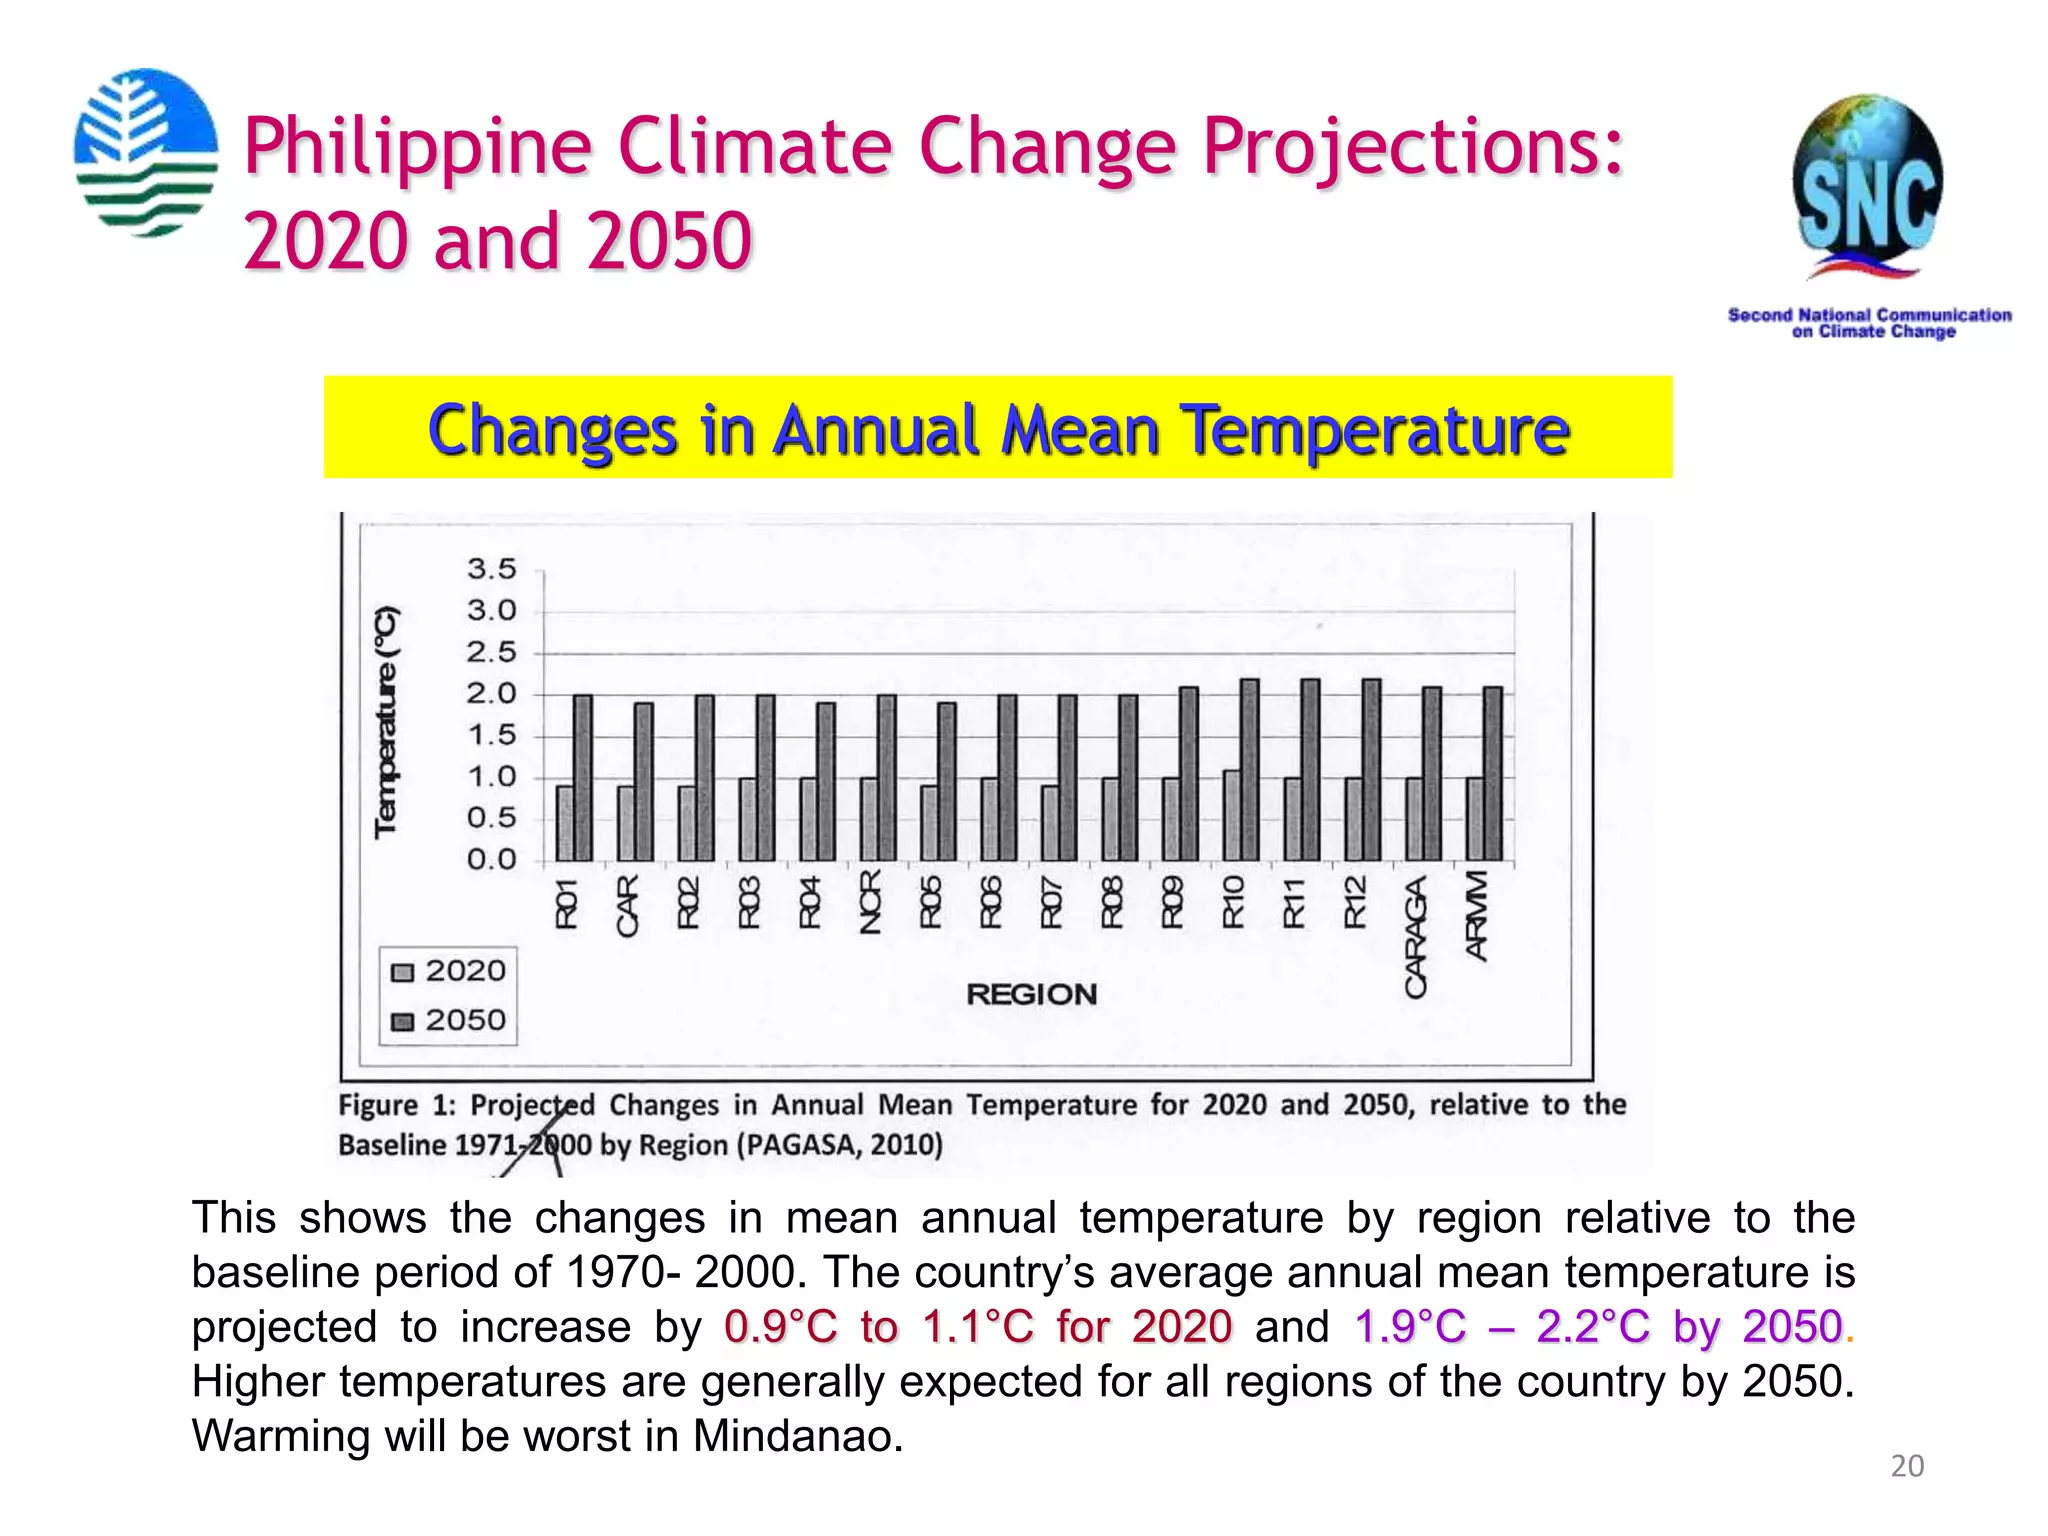
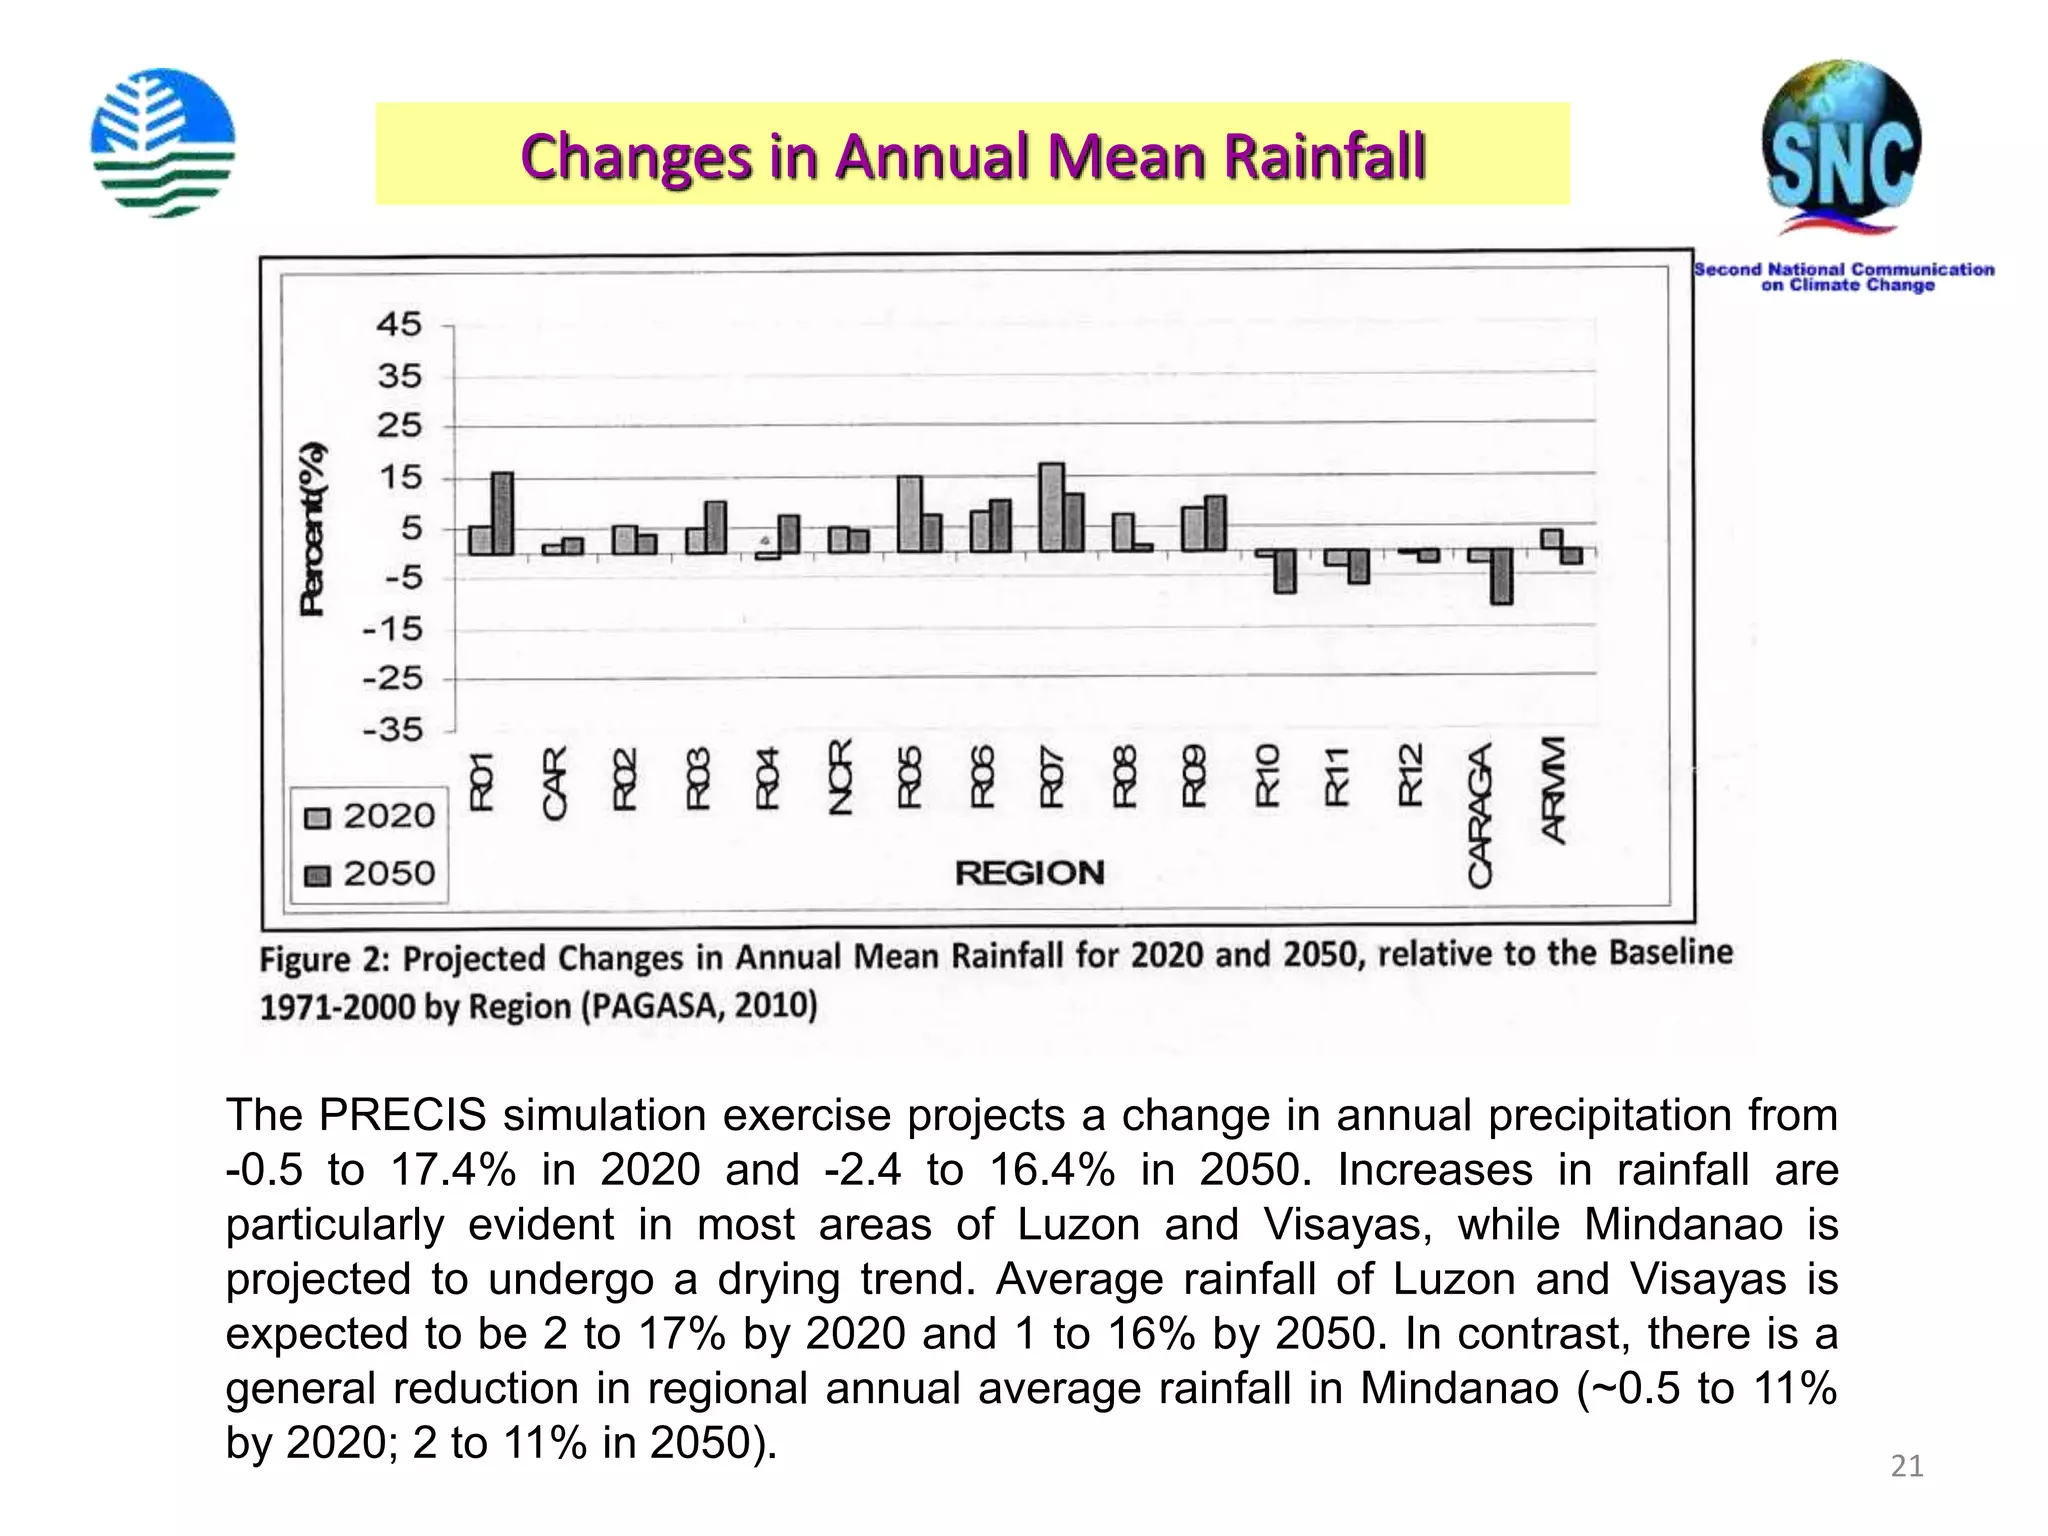
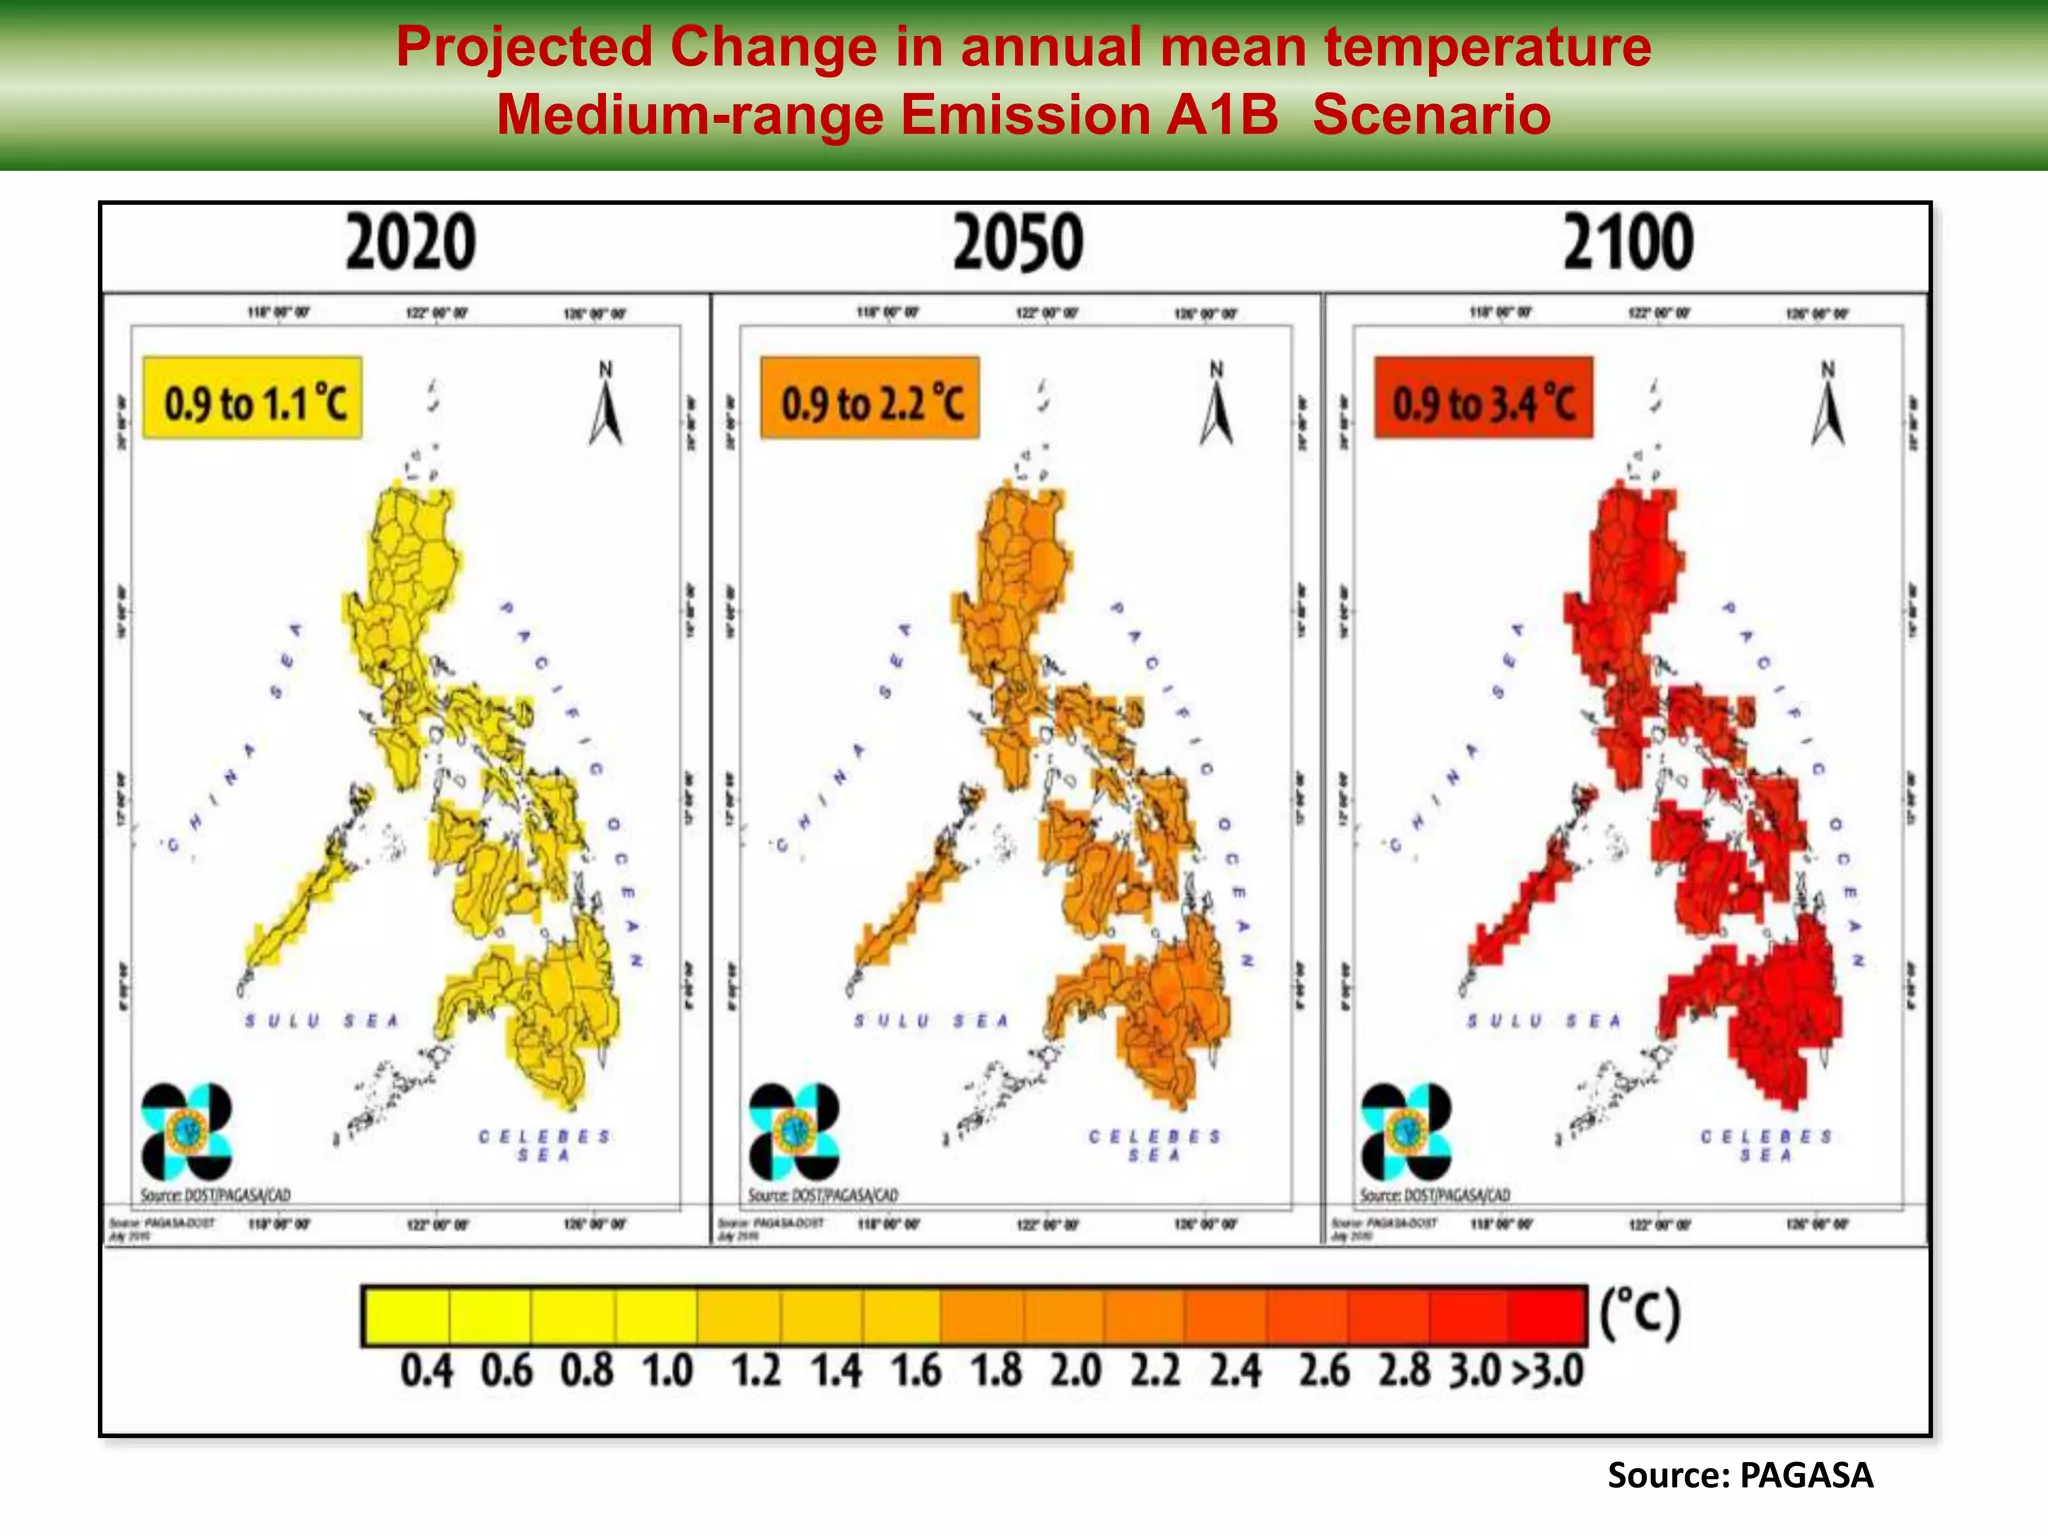
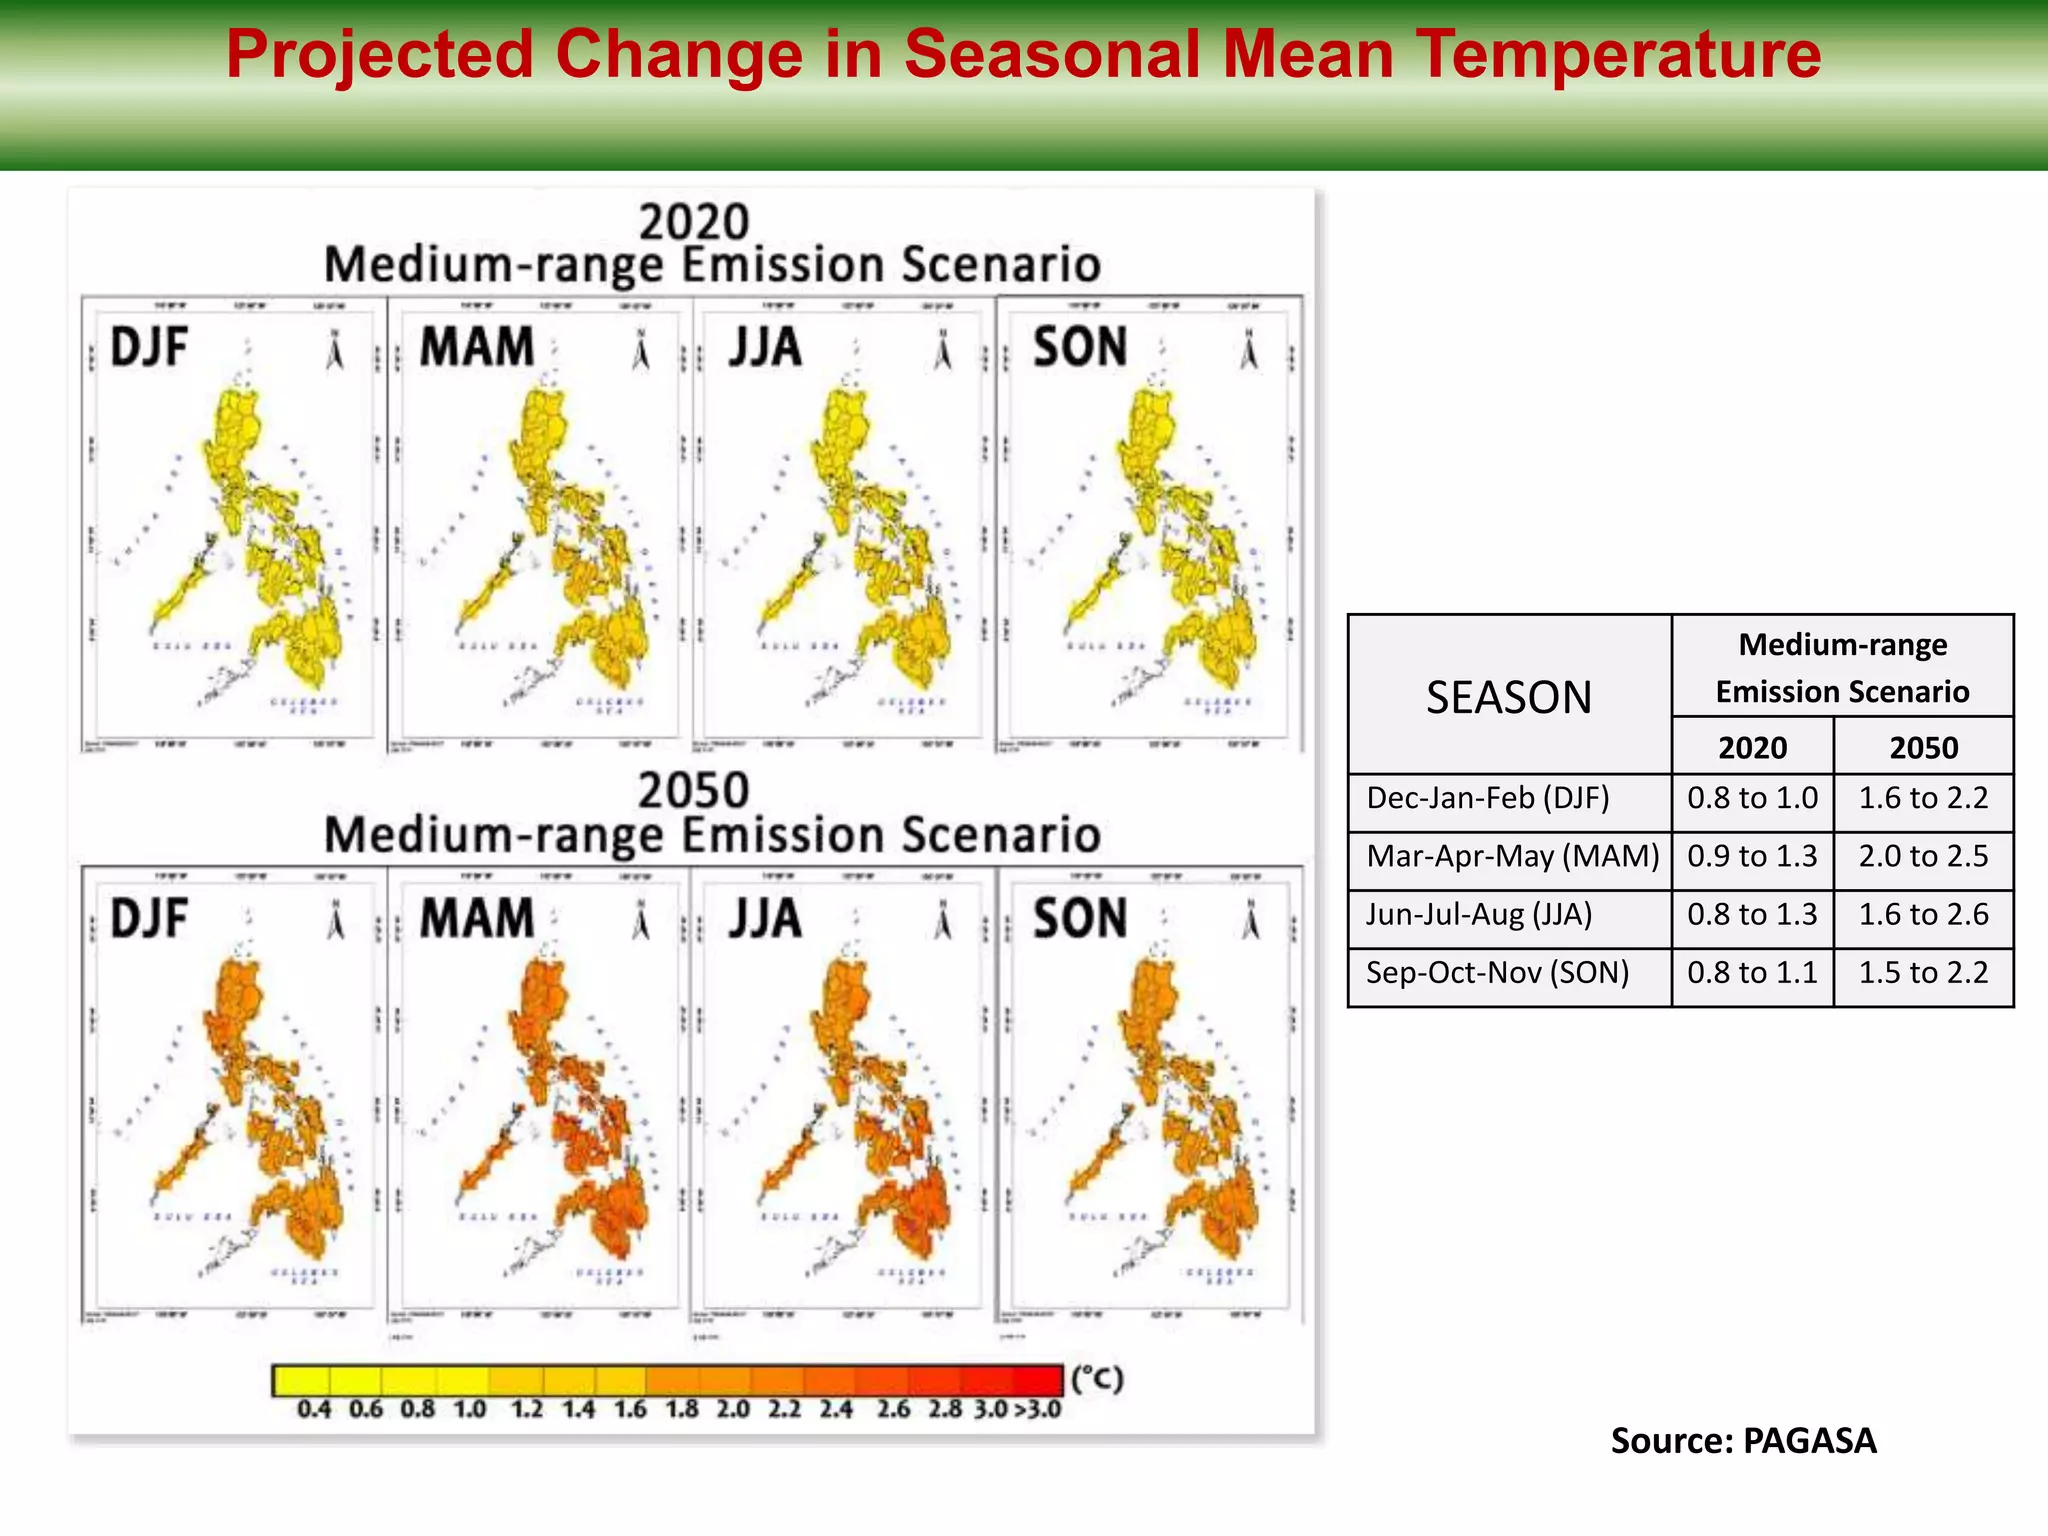
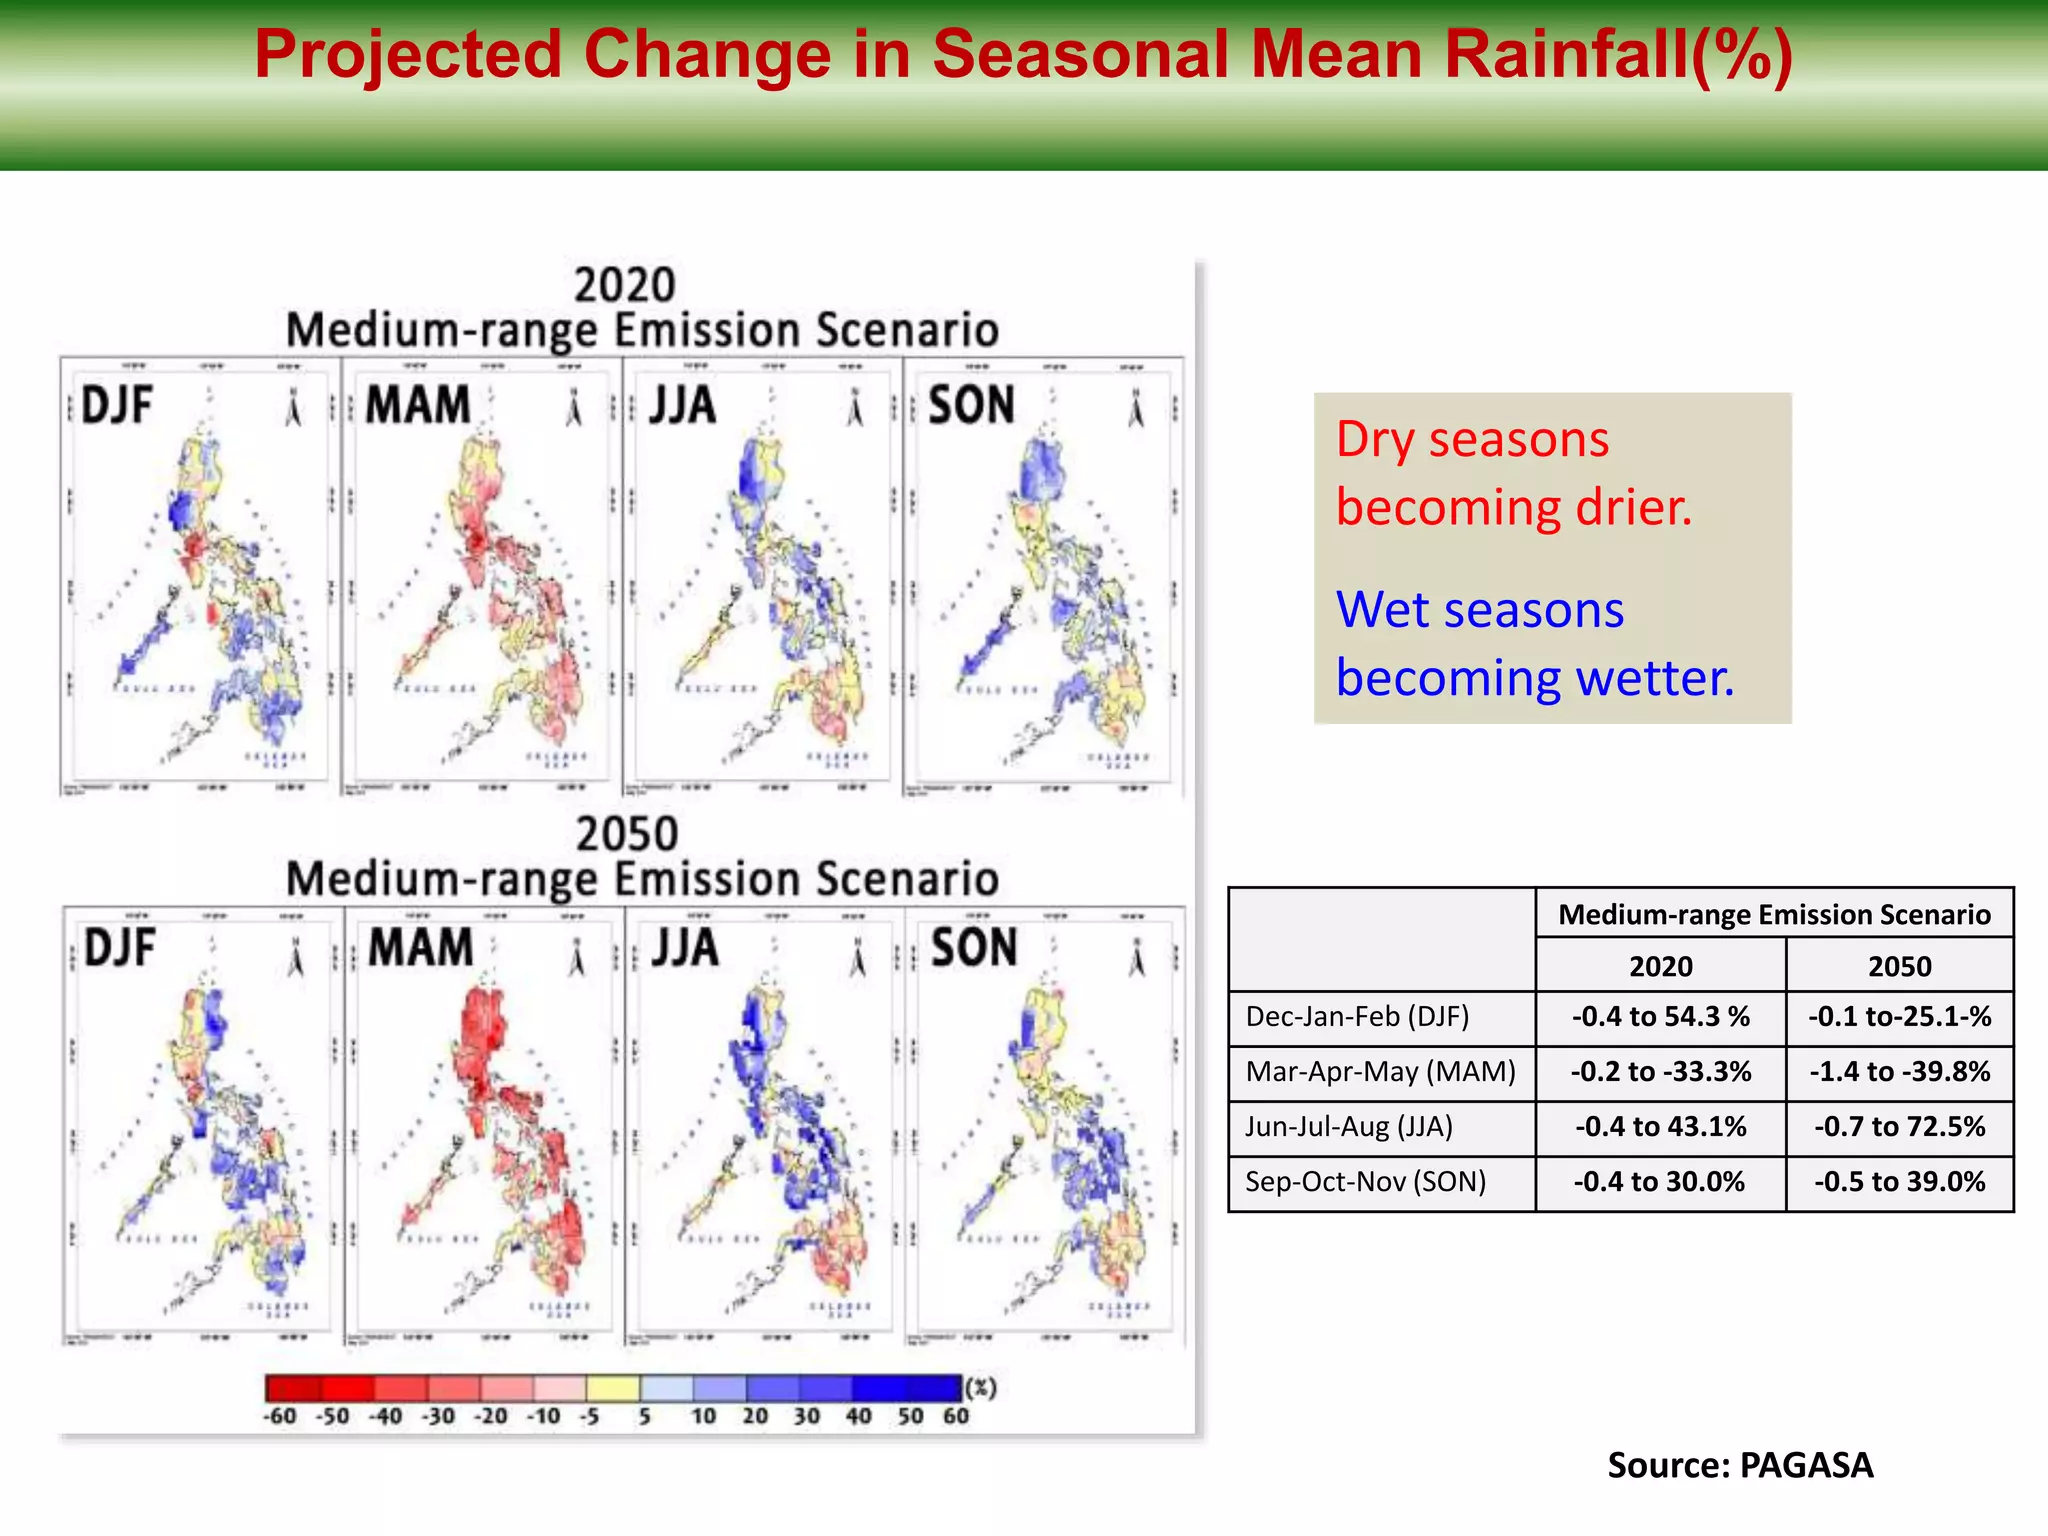
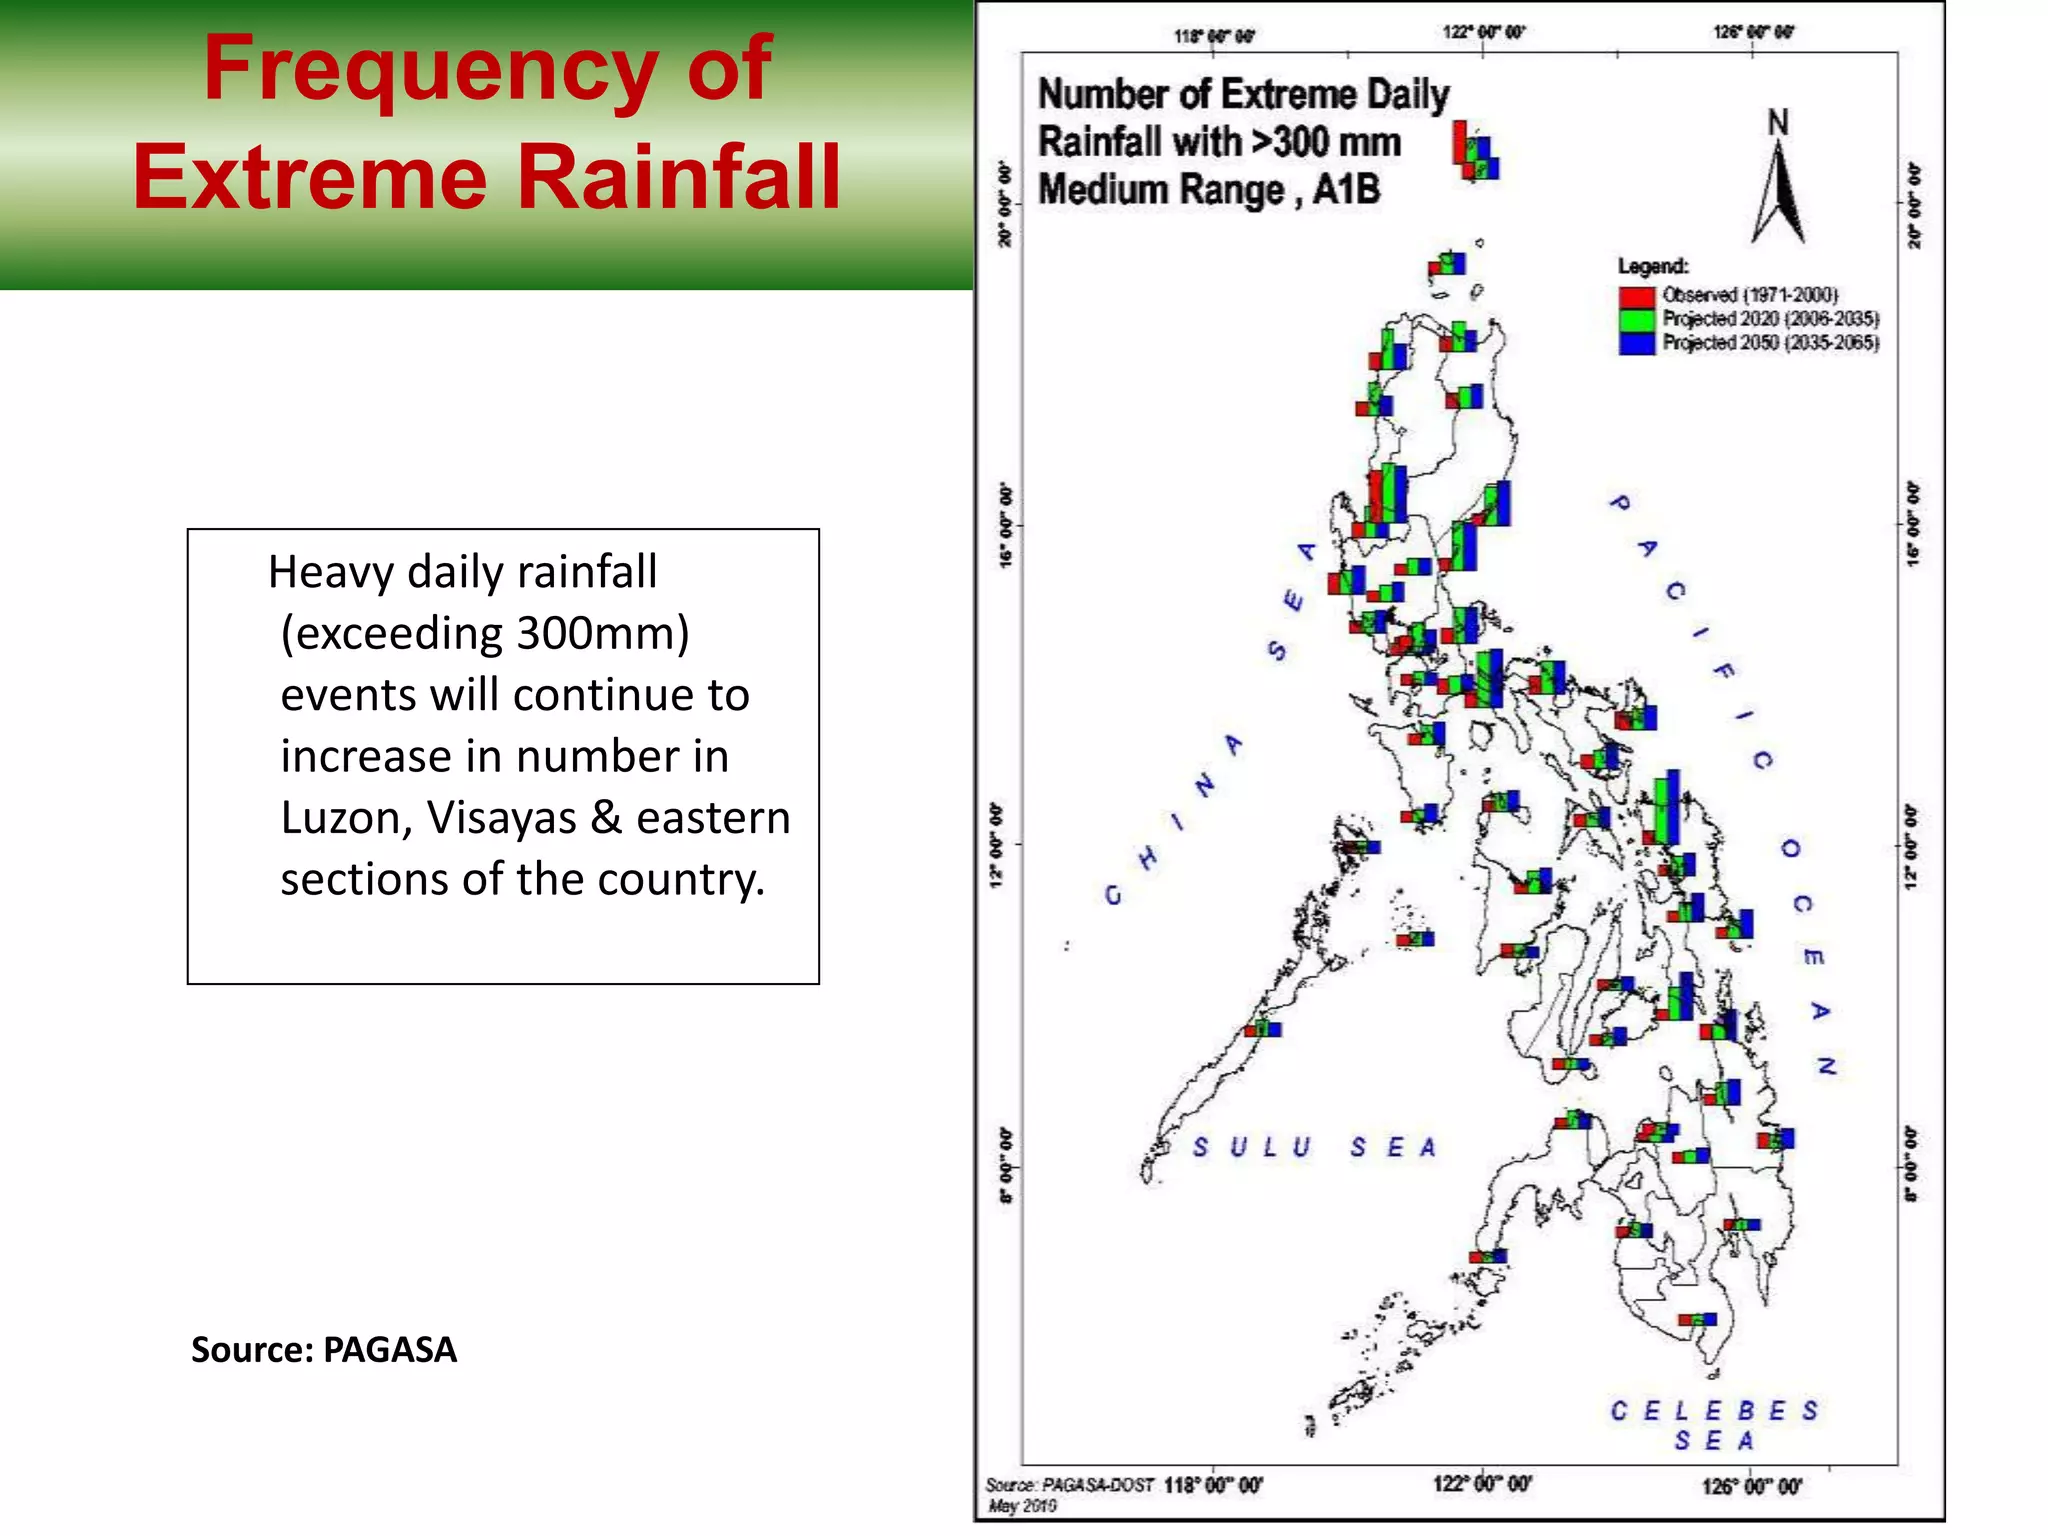
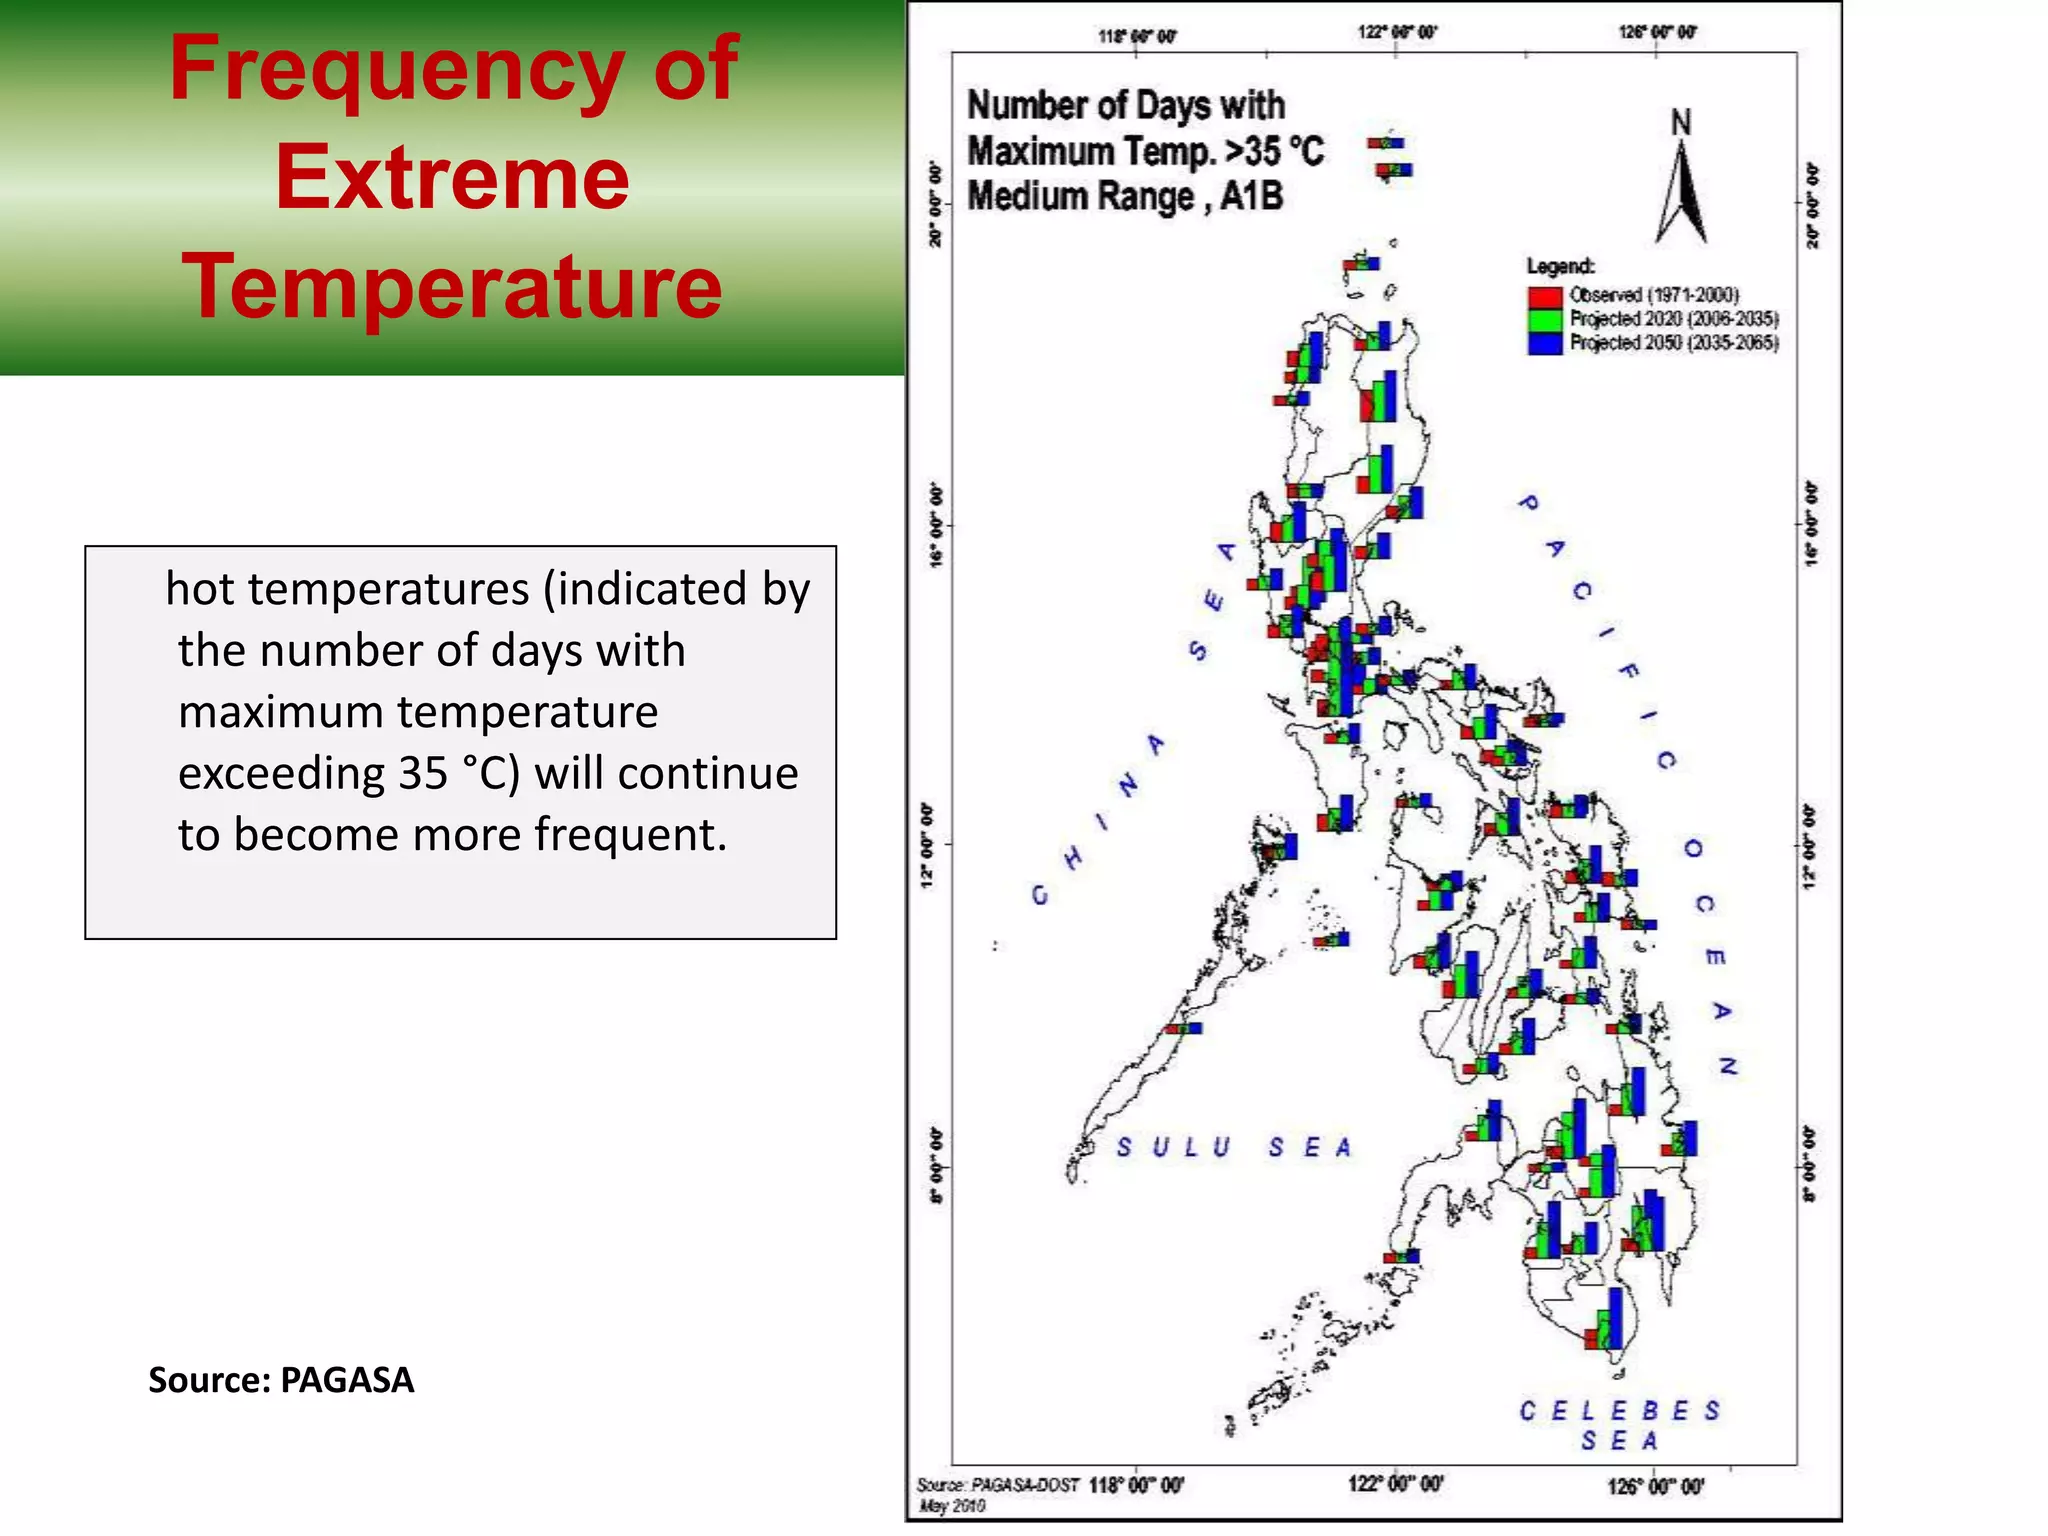
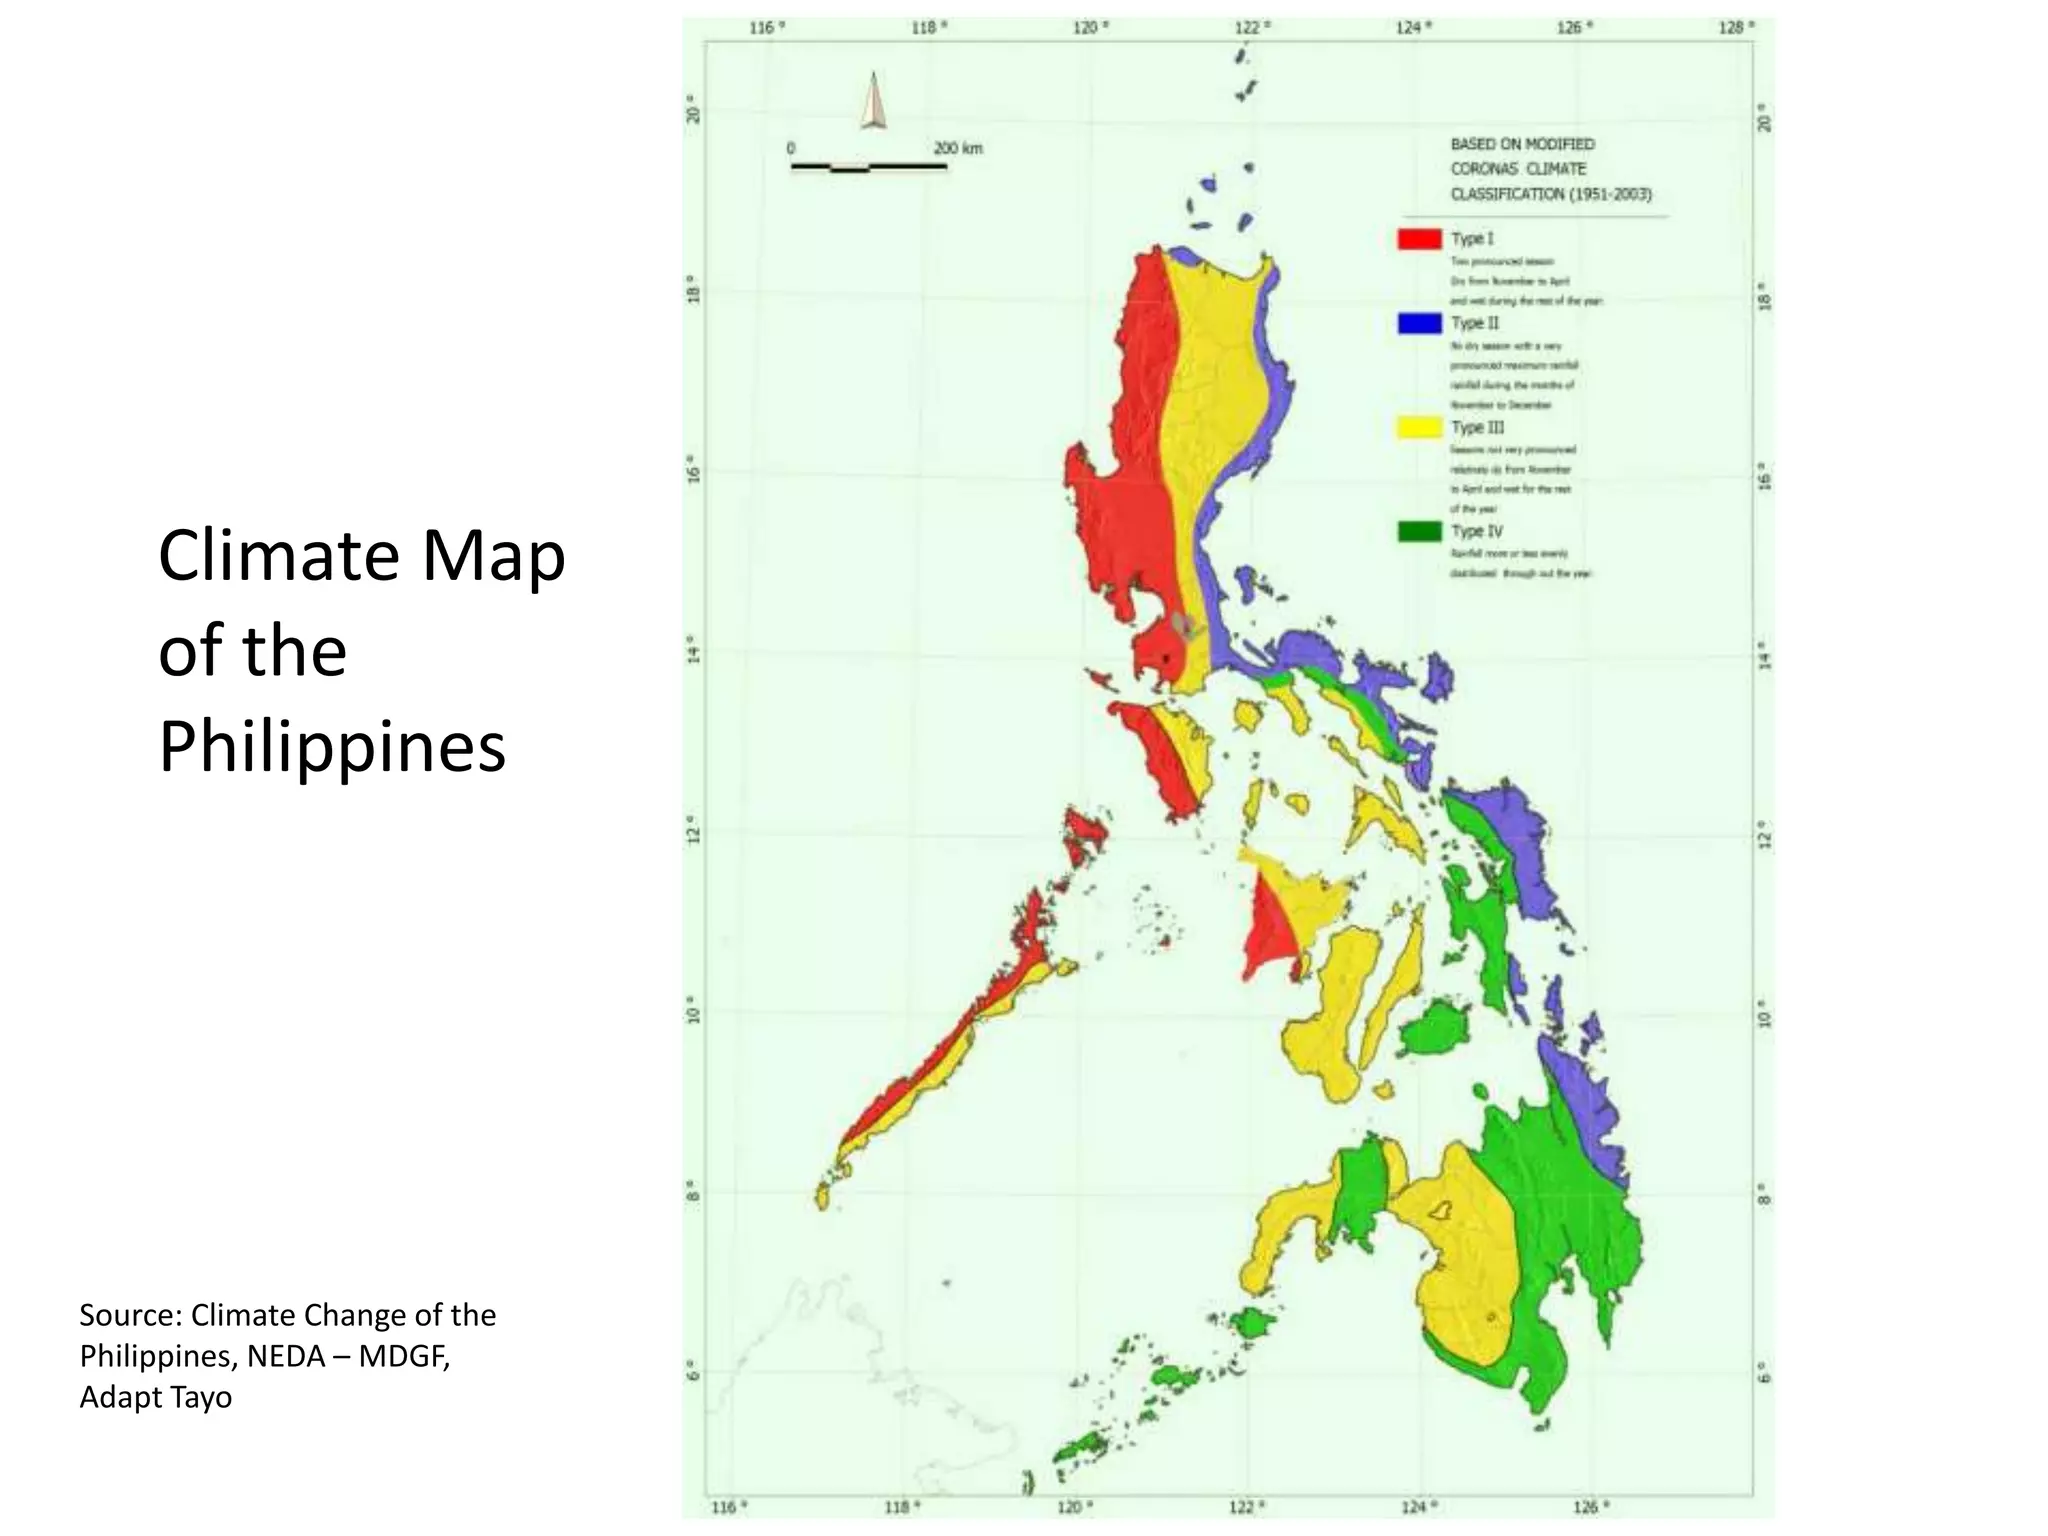
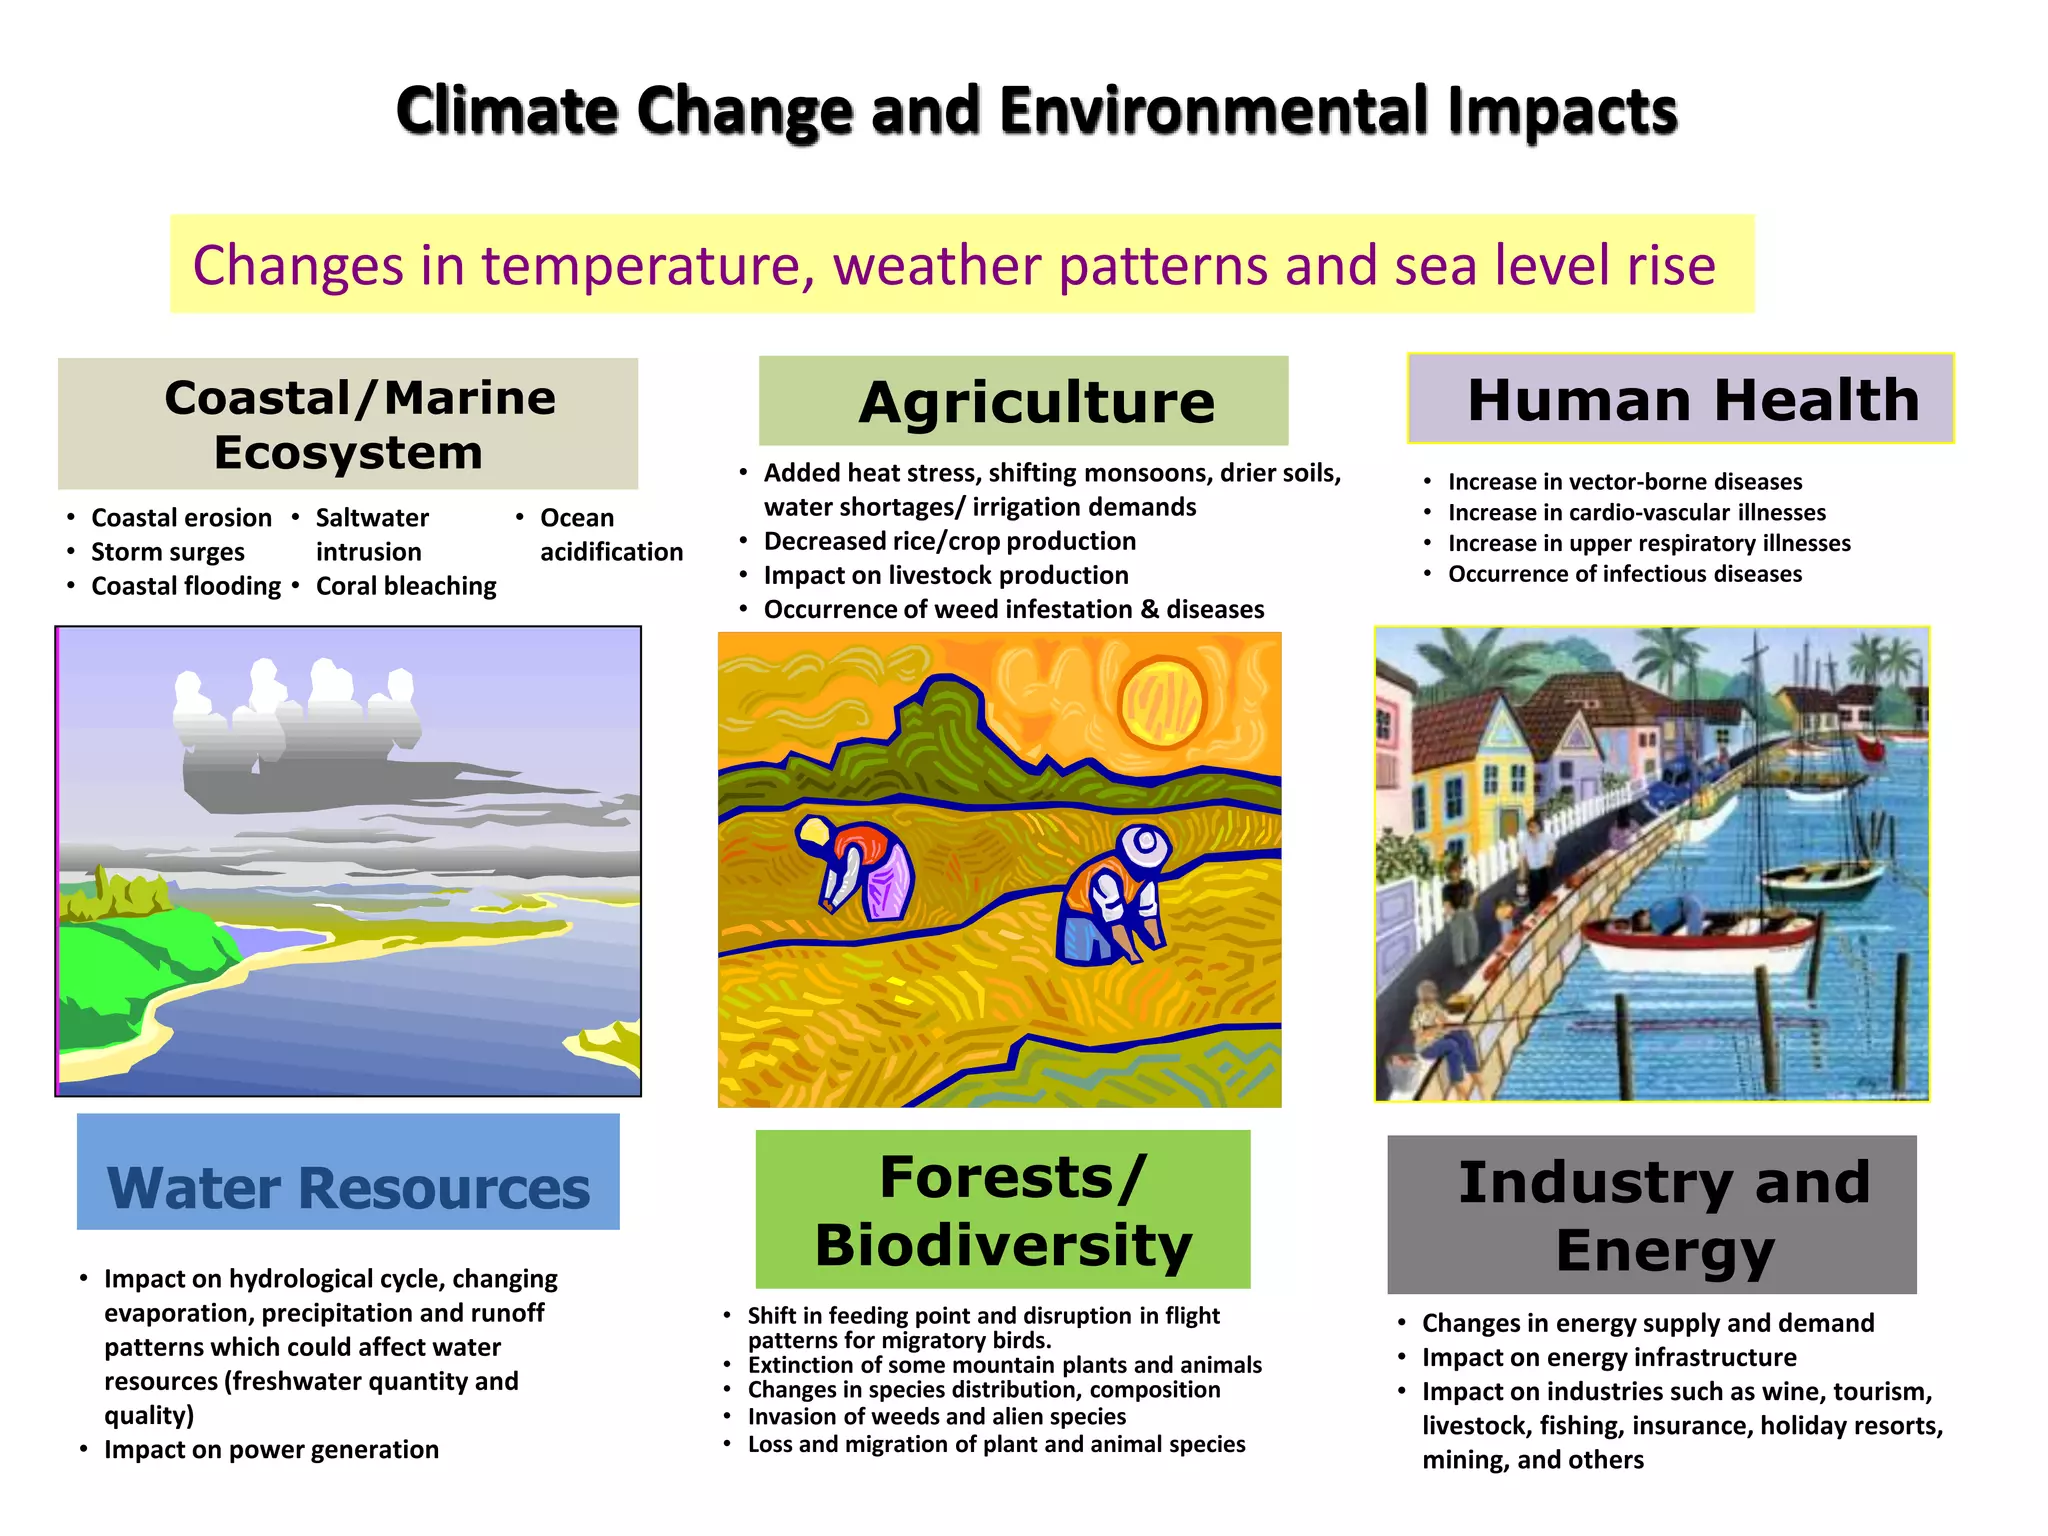
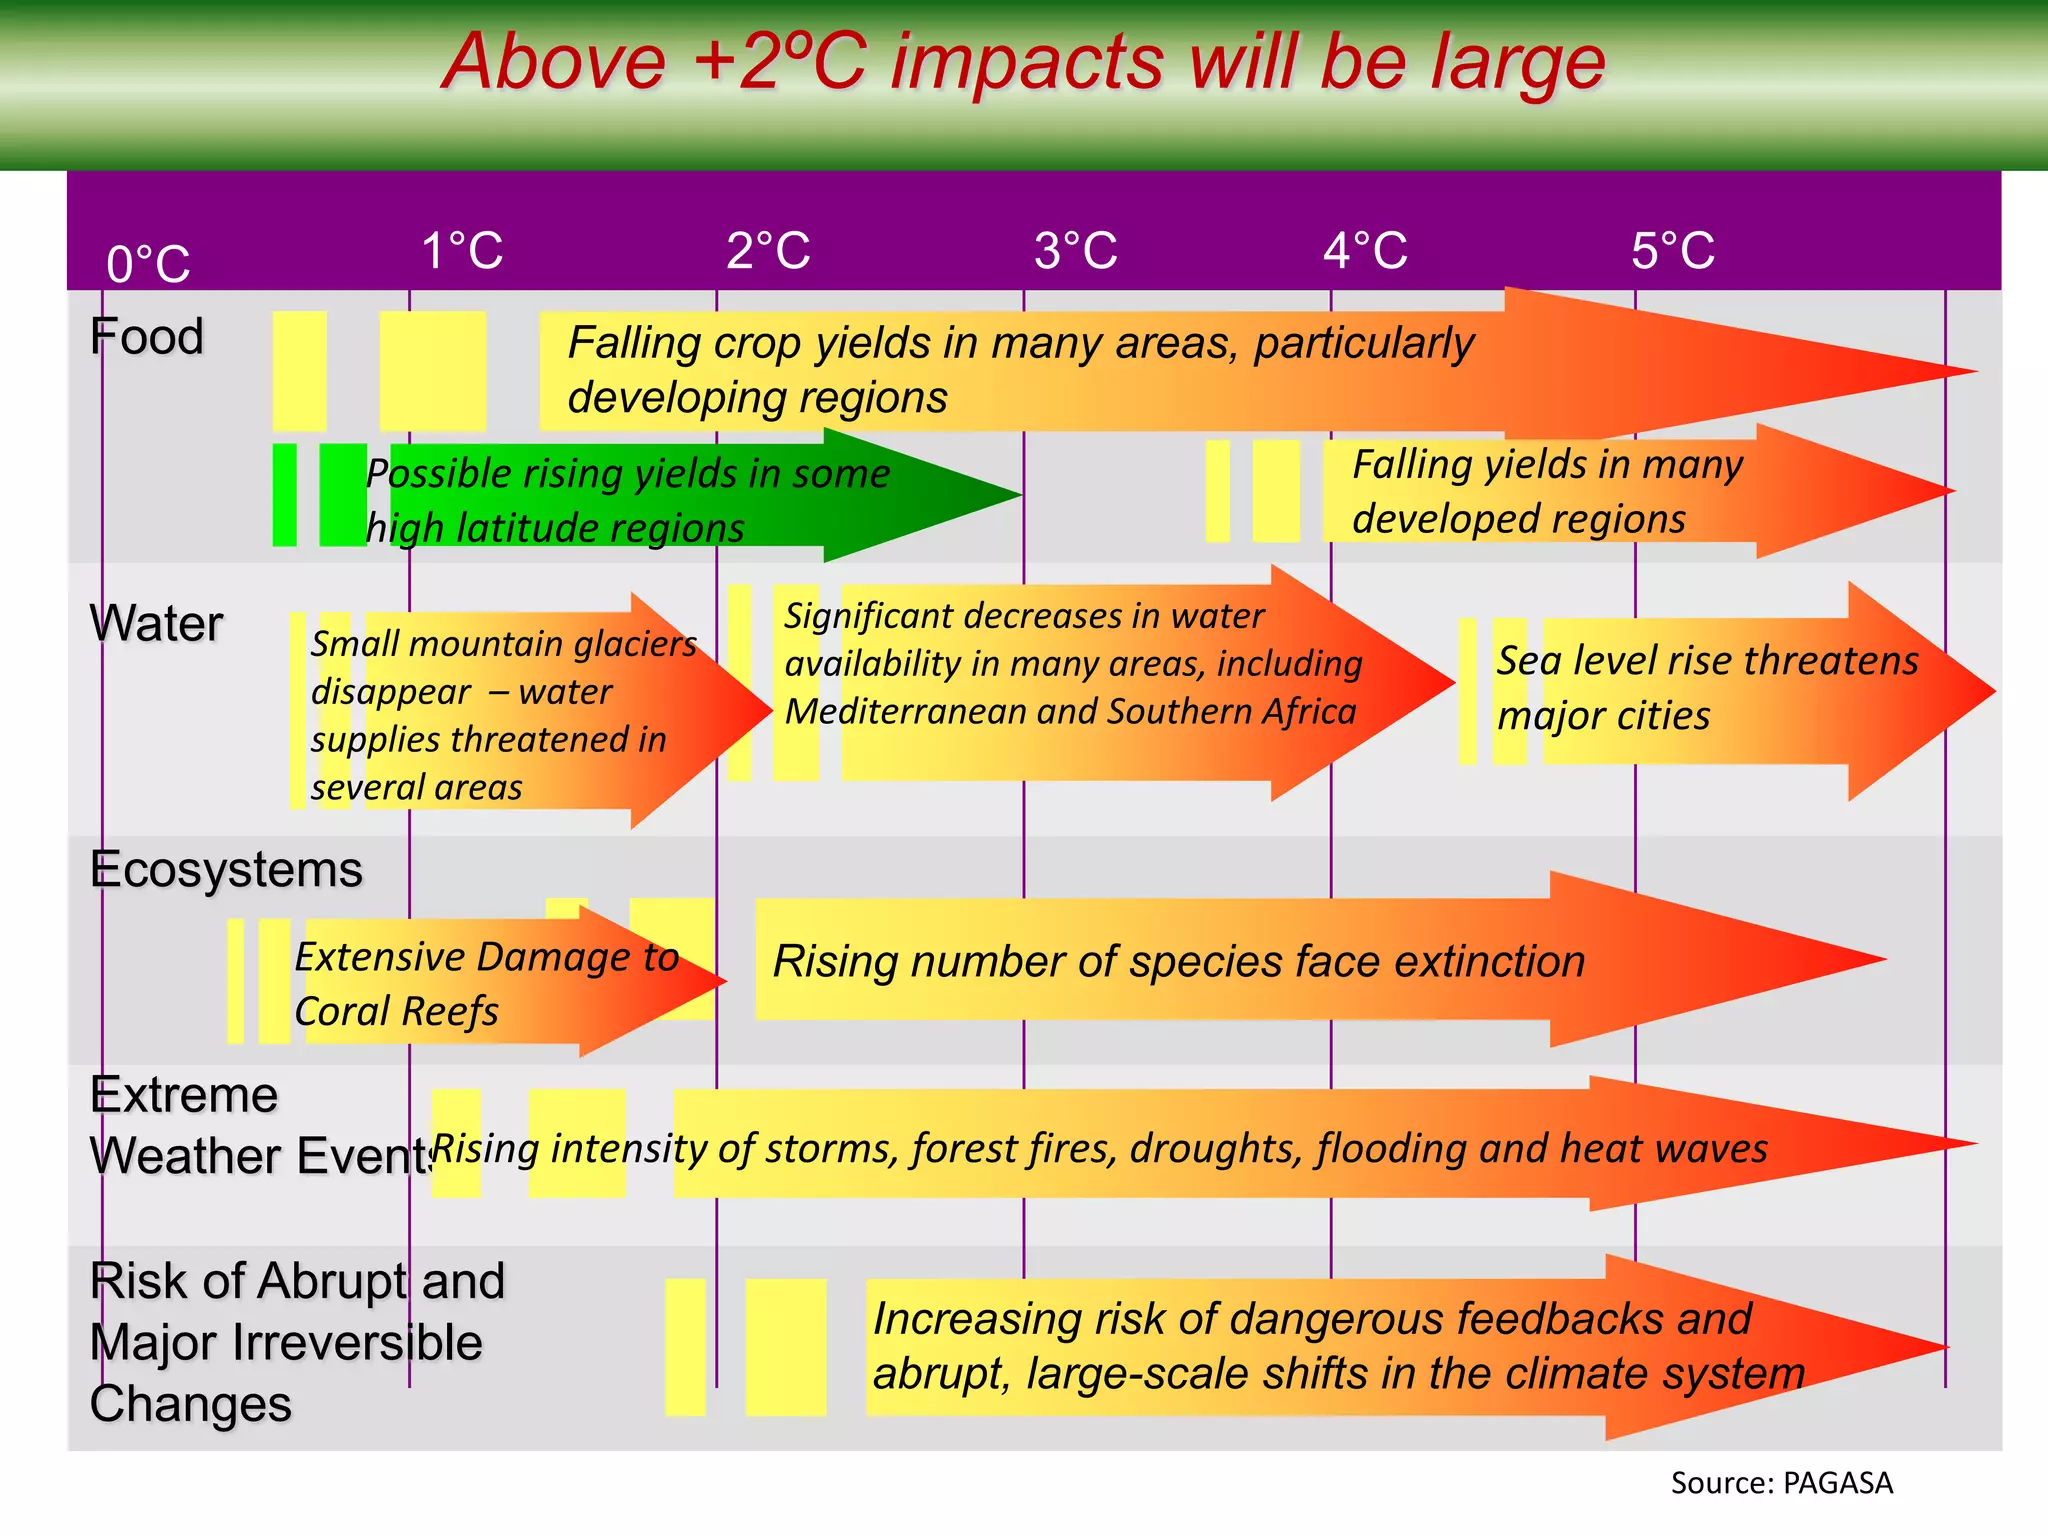
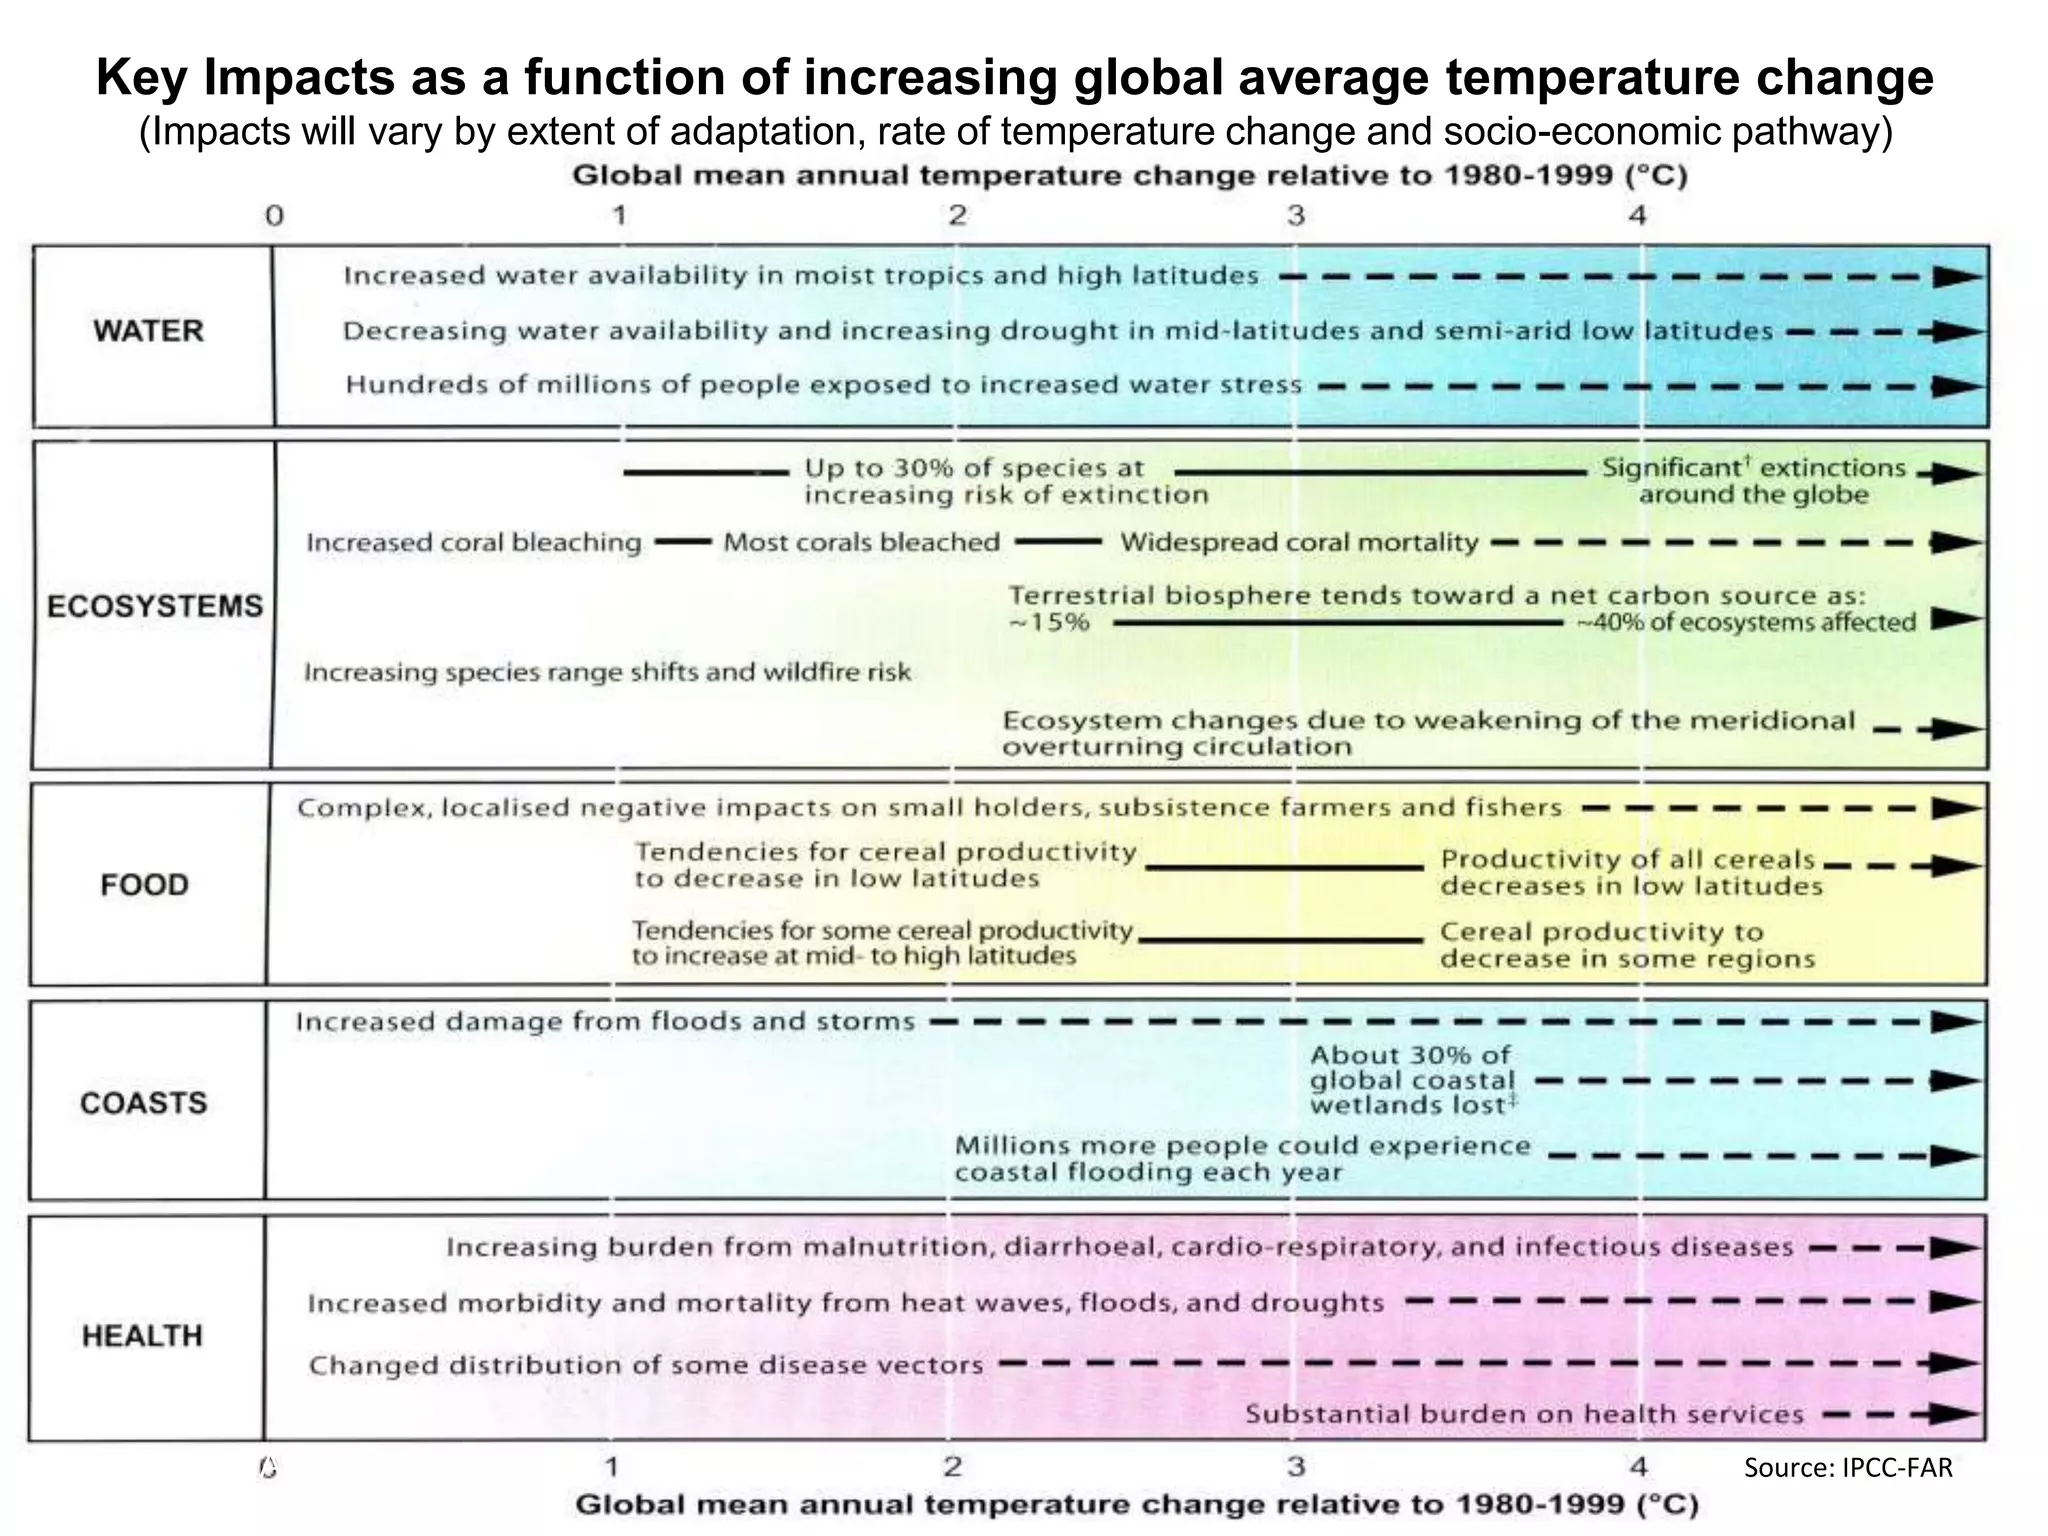
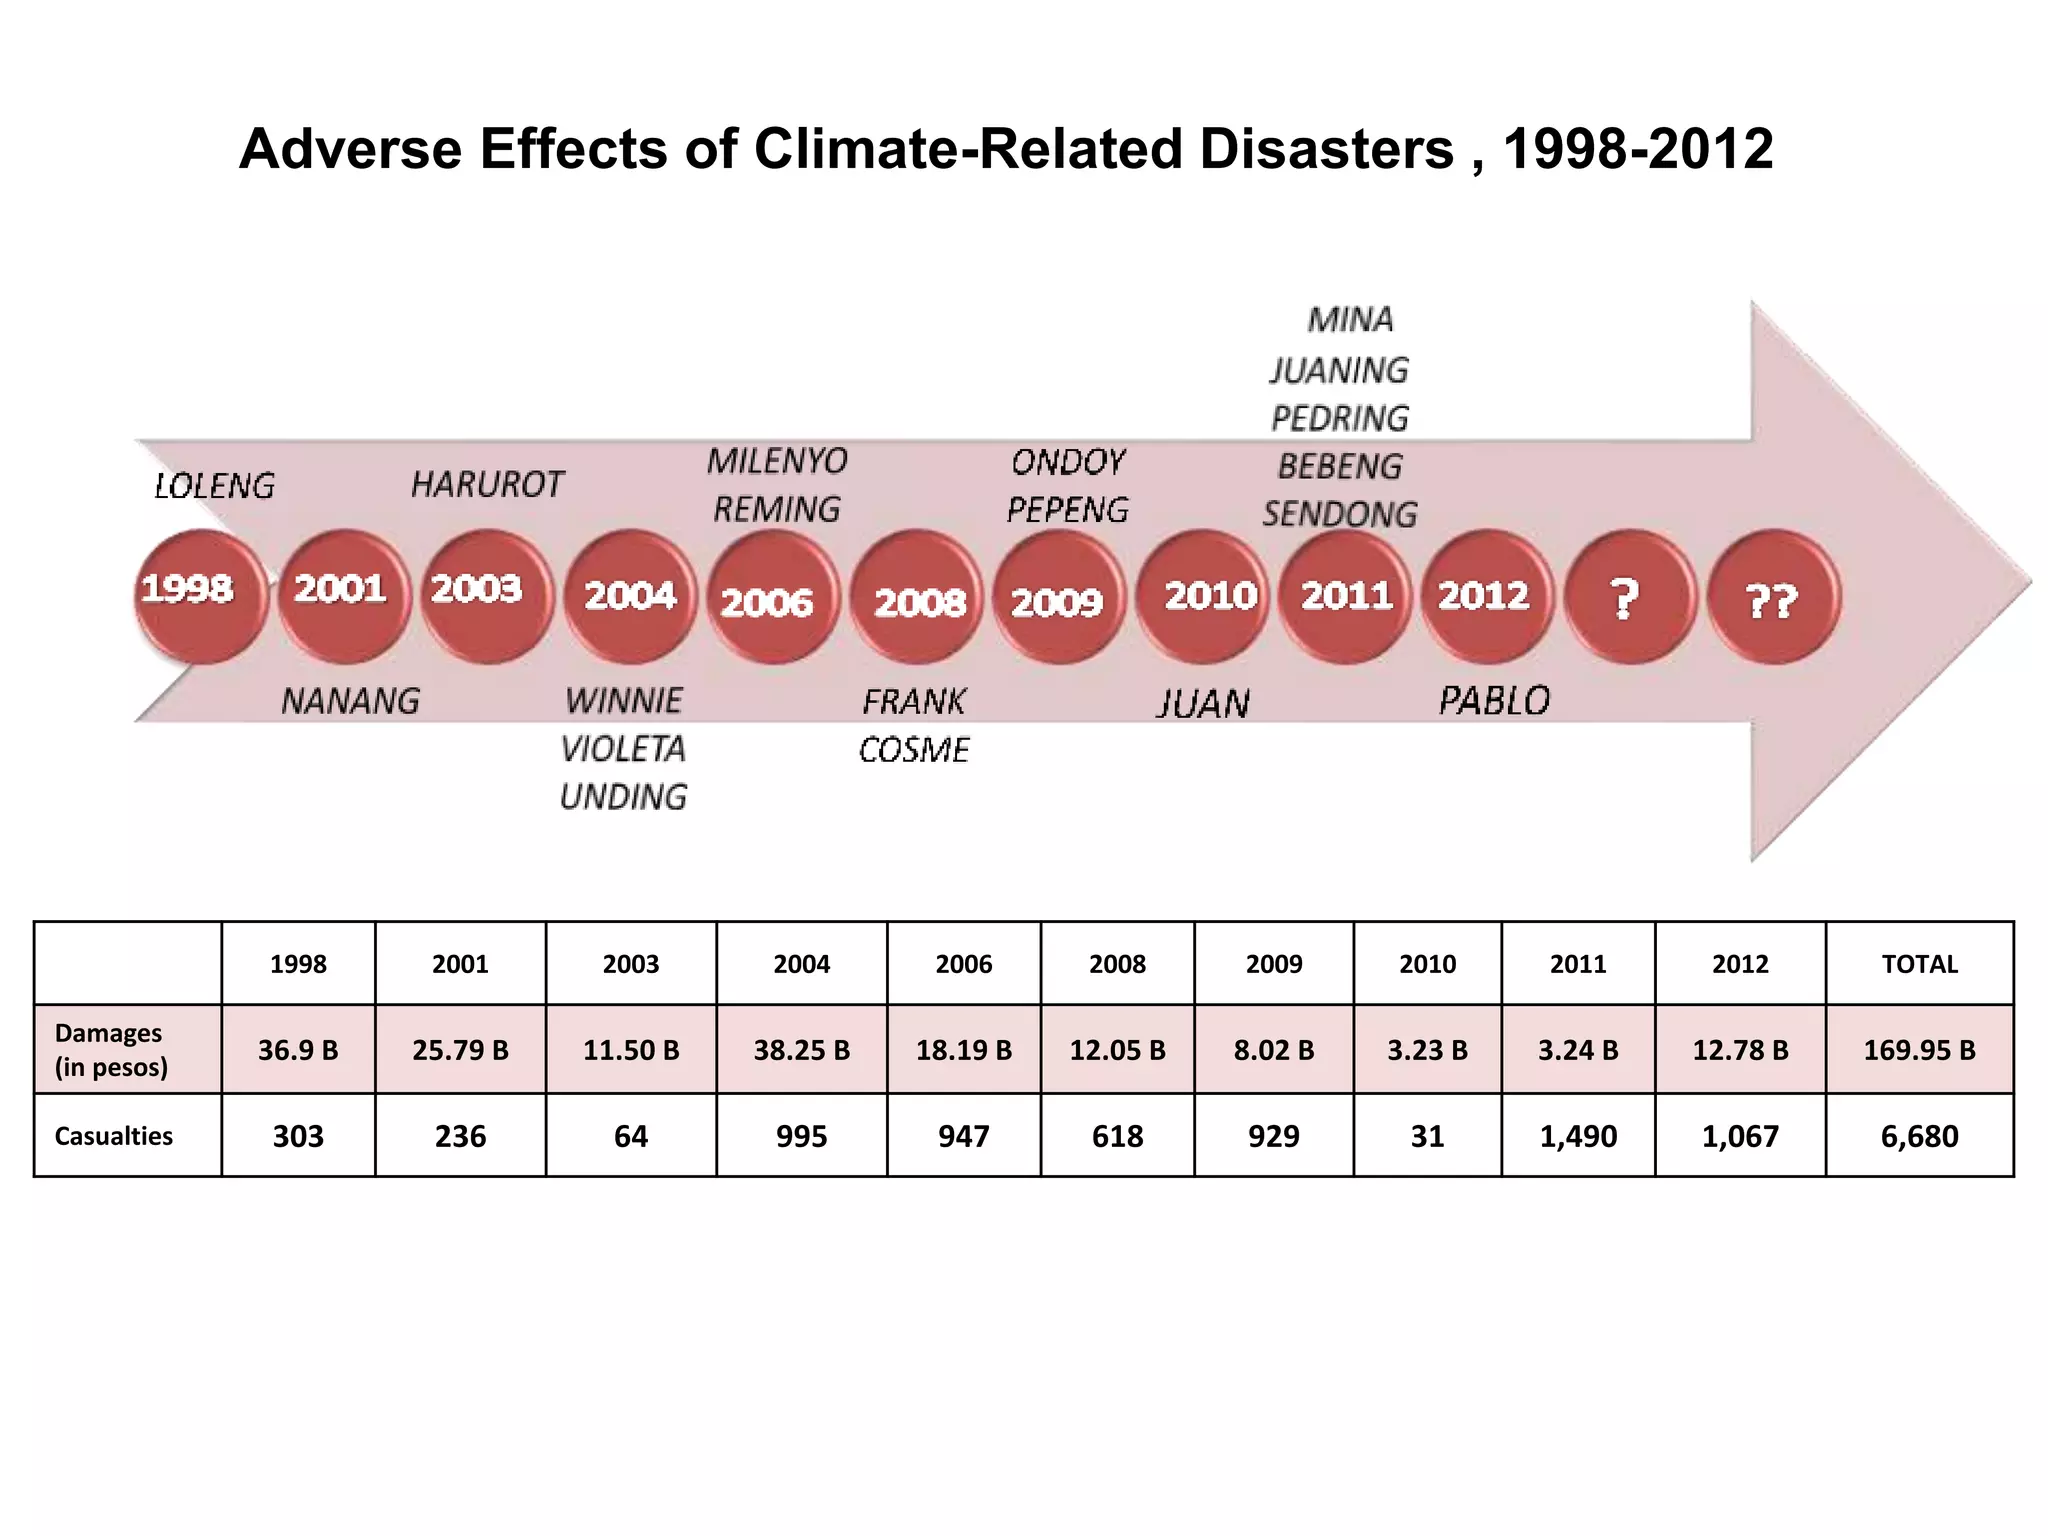
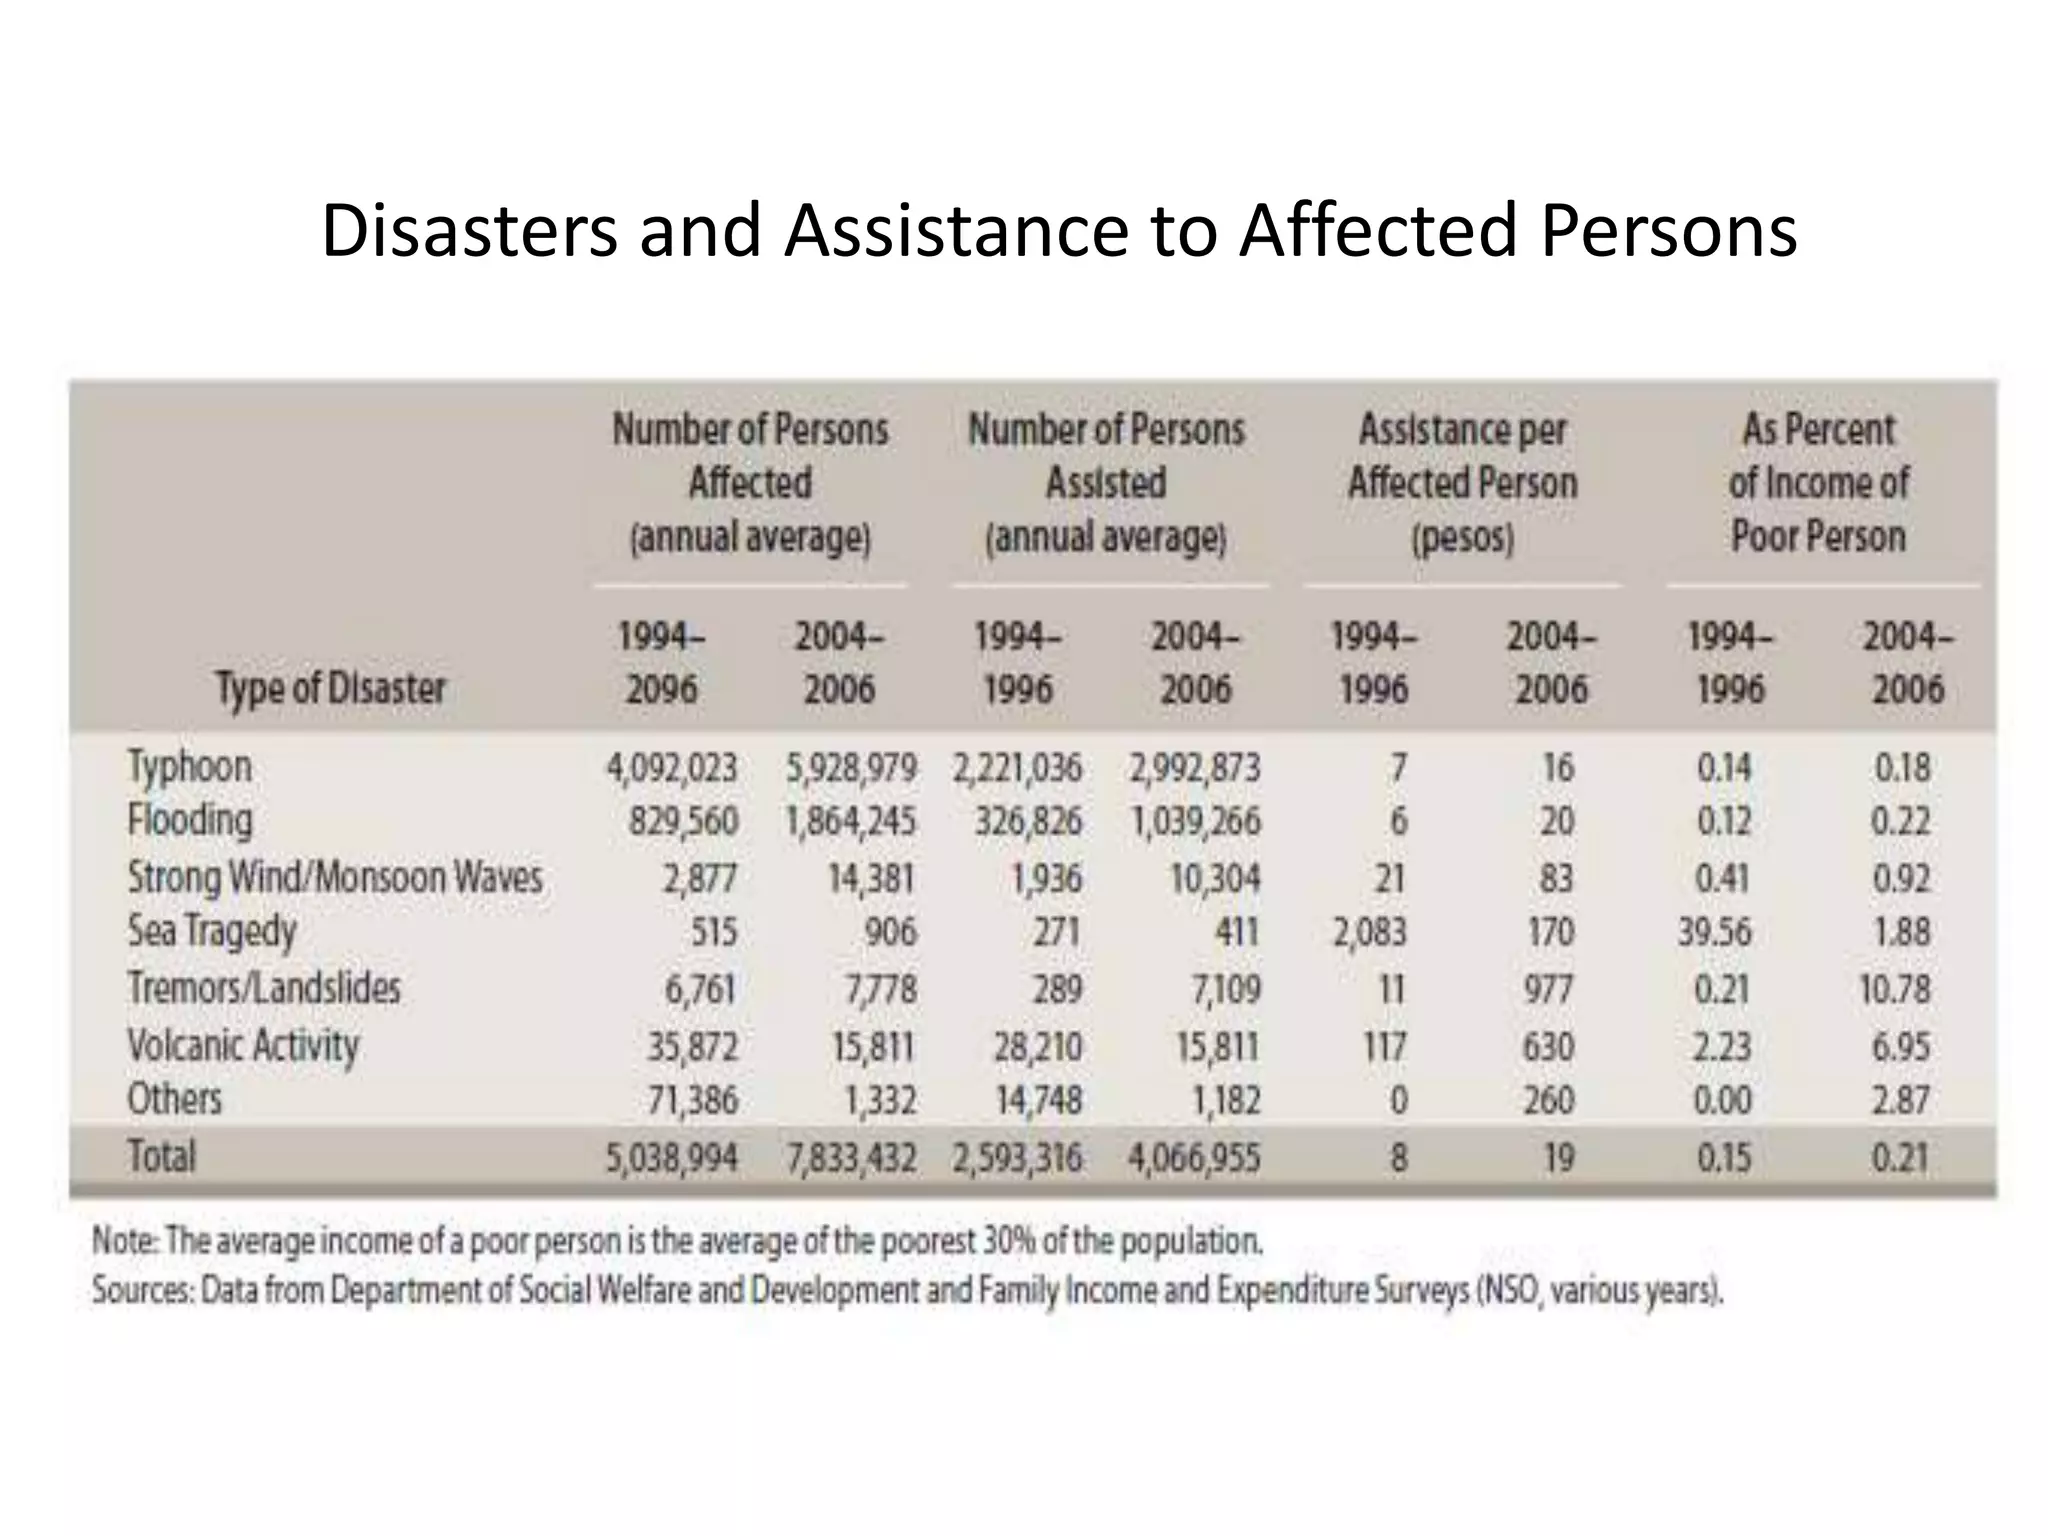
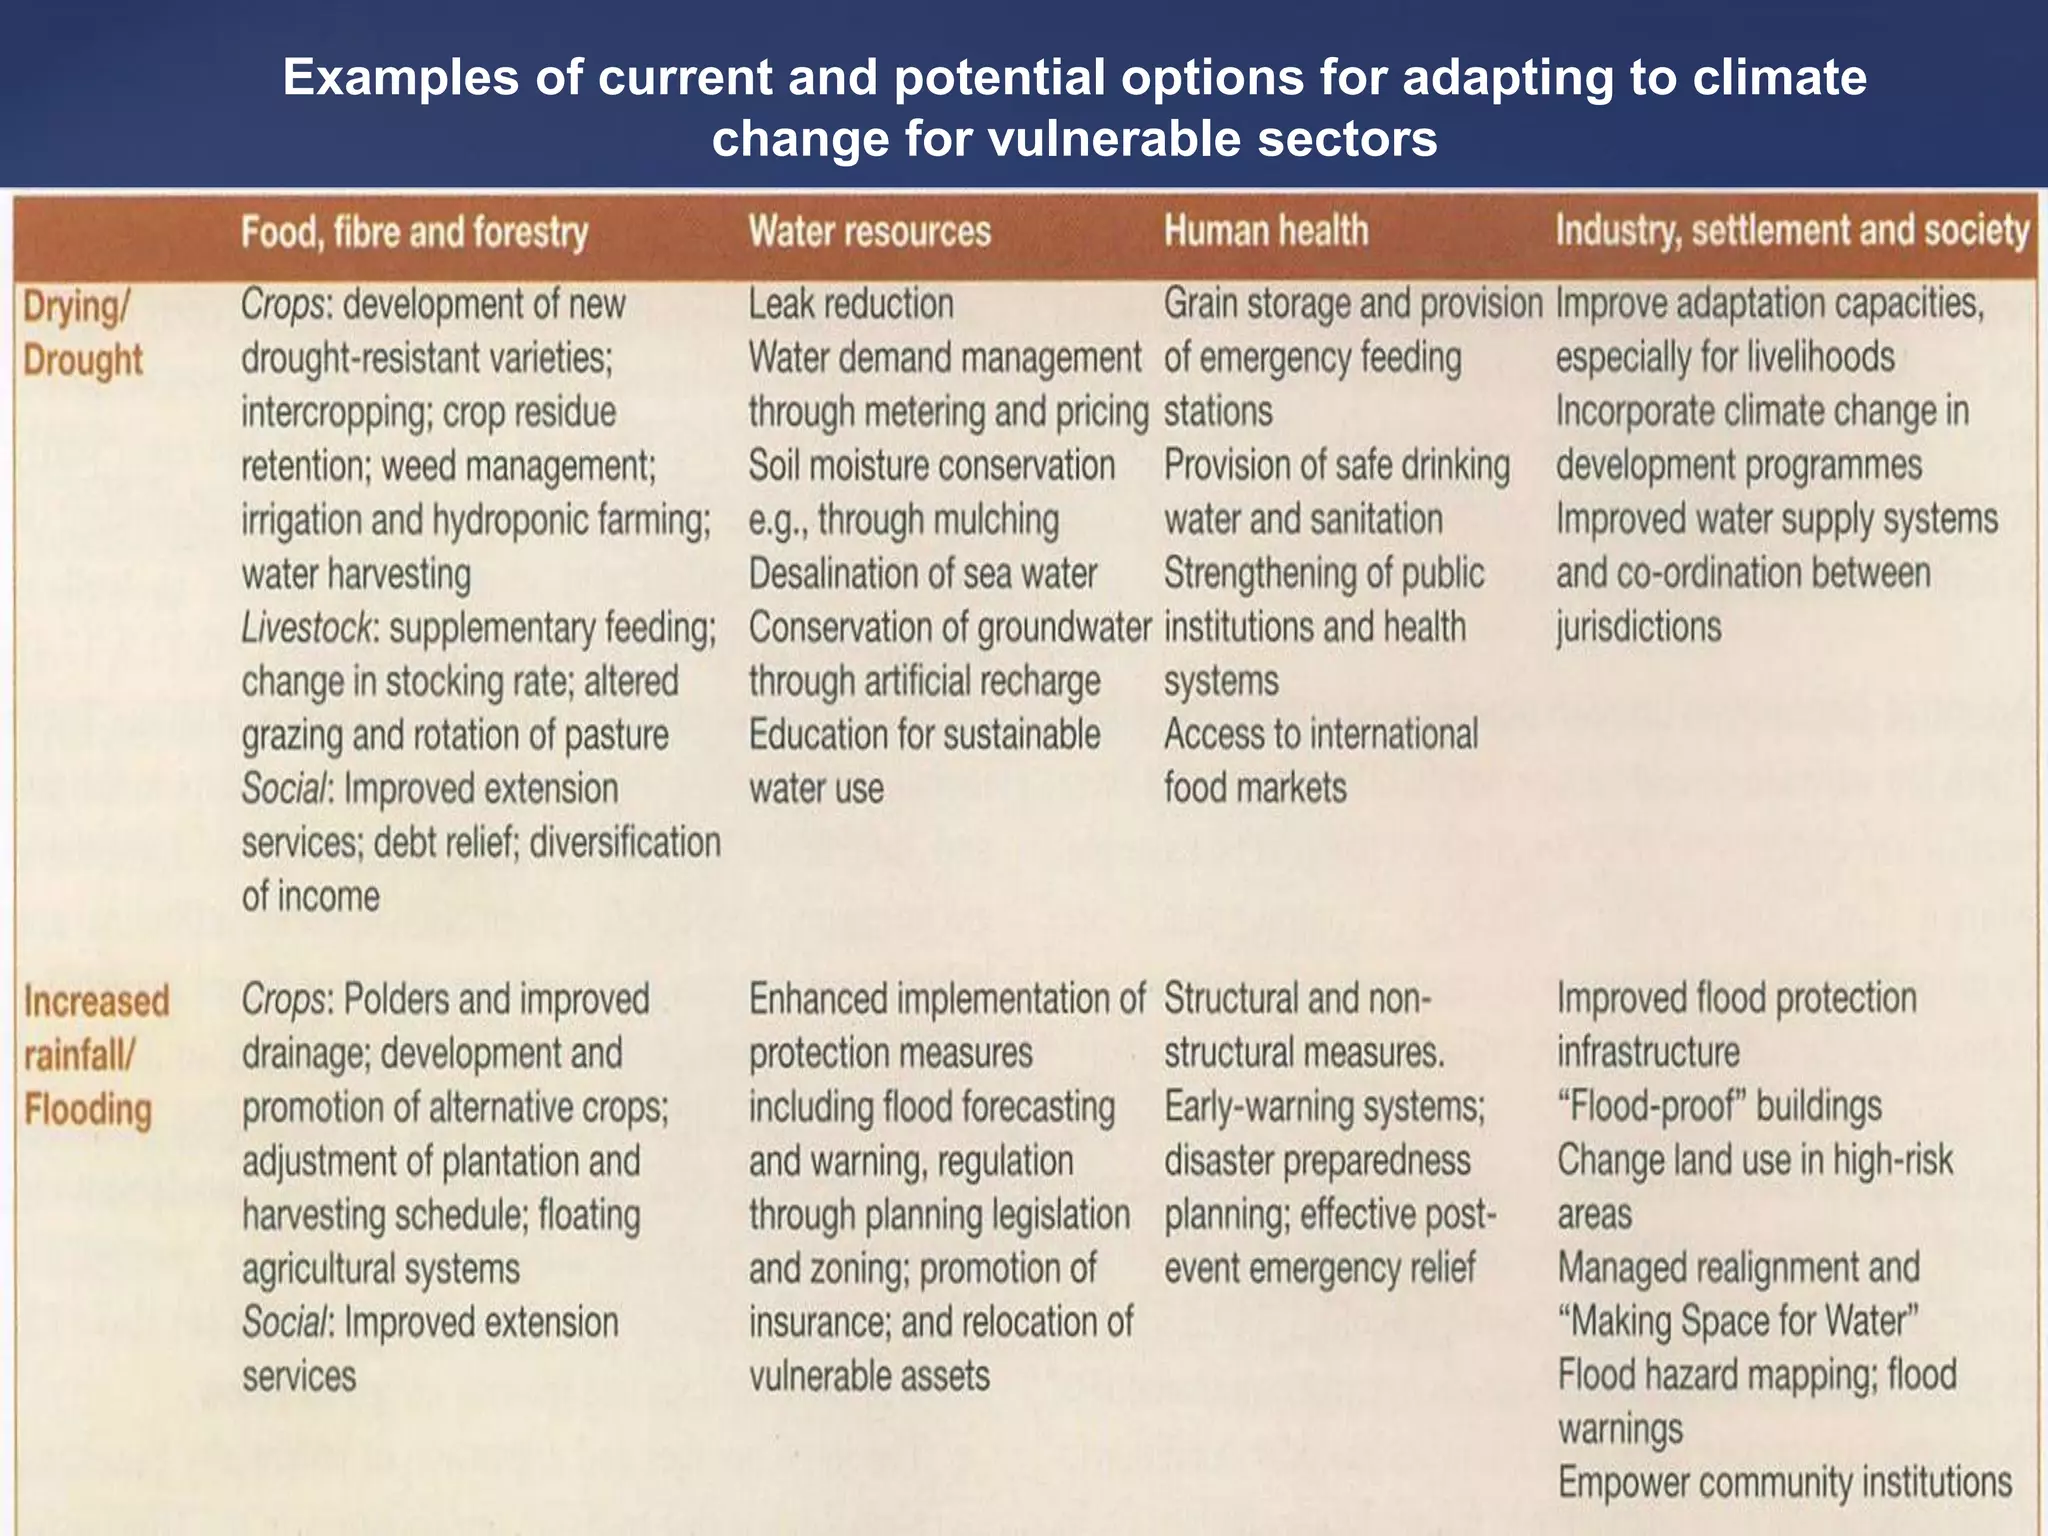
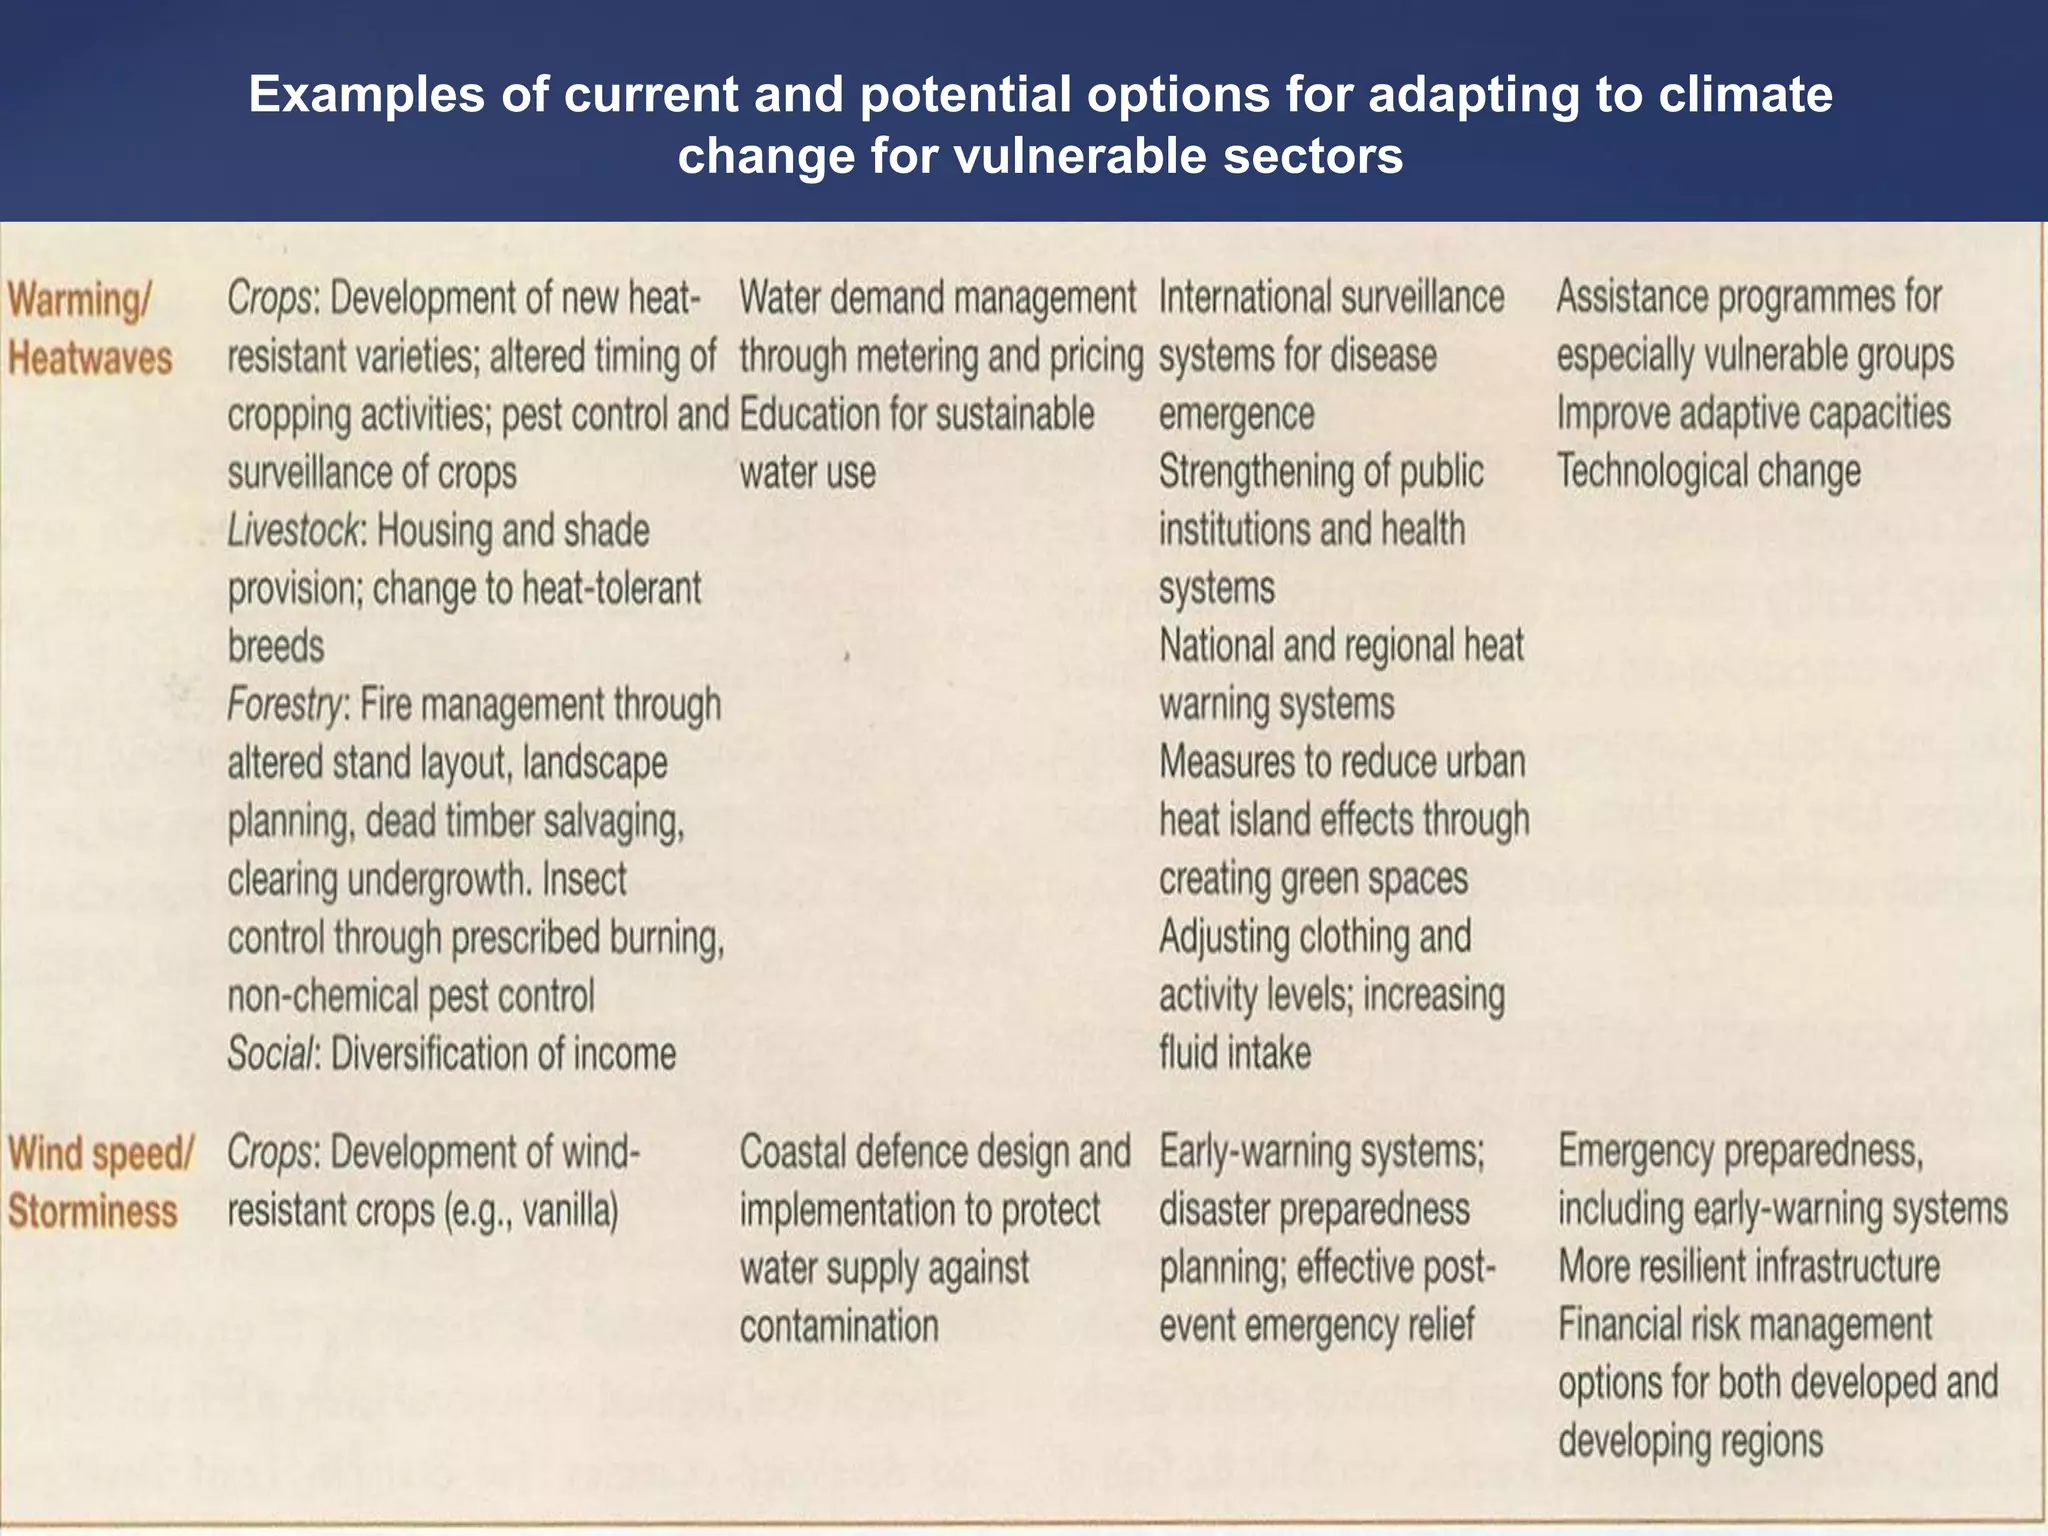


The document discusses climate change projections for the Philippines based on IPCC reports. It finds that the country is highly vulnerable to impacts of climate change like rising temperatures, more extreme rainfall, stronger typhoons, and sea level rise. Projections estimate average temperatures in the Philippines increasing by 0.9-1.1°C by 2020 and 1.9-2.2°C by 2050. Rainfall patterns are also expected to change, with wet seasons getting wetter and dry seasons drier in many areas. Sea level rise poses major risks of flooding and land loss. The document outlines how these changes will severely affect sectors like agriculture, health, and coastal resources.


