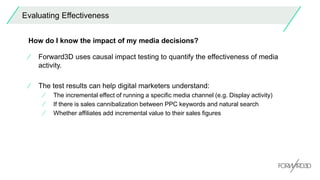
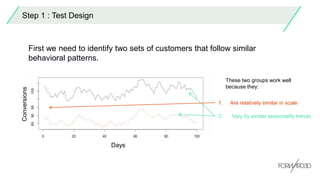
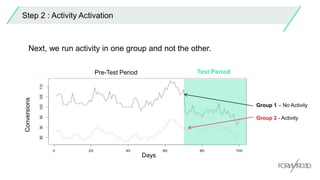
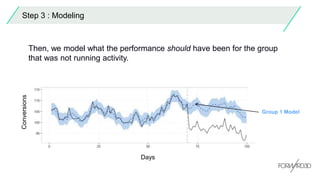
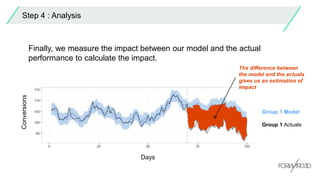
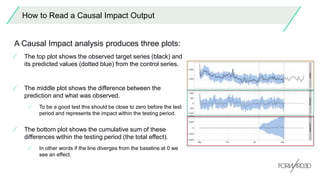
Measure Effectiveness with Causal Impact Analysis
⁄ Forward3D uses causal impact testing to quantify the effectiveness of media
activity.
⁄ The test results can help digital marketers understand:
⁄ The incremental effect of running a specific media channel (e.g. Display activity)
⁄ If there is sales cannibalization between PPC keywords and natural search
⁄ Whether affiliates add incremental value to their sales figures
Evaluating Effectiveness
How do I know the impact of my media decisions?
How does it work?
Step 1 : Test Design
First we need to identify two sets of customers that follow similar
behavioral patterns.
These two groups work well
because they:
Conversions
Days
2. Vary by similar seasonality trends
1. Are relatively similar in scale
Step 2 : Activity Activation
Next, we run activity in one group and not the other.
Conversions
Days
Test PeriodPre-Test Period
Group 1 – No Activity
Group 2 - Activity
Step 3 : Modeling
Then, we model what the performance should have been for the group
that was not running activity.
Conversions
Days
Group 1 Model
Step 4 : Analysis
Finally, we measure the impact between our model and the actual
performance to calculate the impact.
Conversions
Days
Group 1 Model
Group 1 Actuals
The difference between
the model and the actuals
gives us an estimation of
impact
How to Read a Causal Impact Output
A Causal Impact analysis produces three plots:
⁄ The top plot shows the observed target series (black) and
its predicted values (dotted blue) from the control series.
⁄ The middle plot shows the difference between the
prediction and what was observed.
⁄ To be a good test this should be close to zero before the test
period and represents the impact within the testing period.
⁄ The bottom plot shows the cumulative sum of these
differences within the testing period (the total effect).
⁄ In other words if the line diverges from the baseline at 0 we
see an effect.
Step 5 : Recommendations and Strategy
Once we have the test results we can work to build the findings into a
more effective media strategy.
⁄ This could include actions such as:
⁄ Shifting investment into more effective channels
⁄ Incorporating newly tested media activity into the ‘business as usual’ media mix
⁄ Adjusting targeting to improve efficiency

Measuring Effectiveness with Causal Impact Analysis

  • 1.
    Measure Effectiveness withCausal Impact Analysis
  • 2.
    ⁄ Forward3D usescausal impact testing to quantify the effectiveness of media activity. ⁄ The test results can help digital marketers understand: ⁄ The incremental effect of running a specific media channel (e.g. Display activity) ⁄ If there is sales cannibalization between PPC keywords and natural search ⁄ Whether affiliates add incremental value to their sales figures Evaluating Effectiveness How do I know the impact of my media decisions?
  • 3.
  • 4.
    Step 1 :Test Design First we need to identify two sets of customers that follow similar behavioral patterns. These two groups work well because they: Conversions Days 2. Vary by similar seasonality trends 1. Are relatively similar in scale
  • 5.
    Step 2 :Activity Activation Next, we run activity in one group and not the other. Conversions Days Test PeriodPre-Test Period Group 1 – No Activity Group 2 - Activity
  • 6.
    Step 3 :Modeling Then, we model what the performance should have been for the group that was not running activity. Conversions Days Group 1 Model
  • 7.
    Step 4 :Analysis Finally, we measure the impact between our model and the actual performance to calculate the impact. Conversions Days Group 1 Model Group 1 Actuals The difference between the model and the actuals gives us an estimation of impact
  • 8.
    How to Reada Causal Impact Output A Causal Impact analysis produces three plots: ⁄ The top plot shows the observed target series (black) and its predicted values (dotted blue) from the control series. ⁄ The middle plot shows the difference between the prediction and what was observed. ⁄ To be a good test this should be close to zero before the test period and represents the impact within the testing period. ⁄ The bottom plot shows the cumulative sum of these differences within the testing period (the total effect). ⁄ In other words if the line diverges from the baseline at 0 we see an effect.
  • 9.
    Step 5 :Recommendations and Strategy Once we have the test results we can work to build the findings into a more effective media strategy. ⁄ This could include actions such as: ⁄ Shifting investment into more effective channels ⁄ Incorporating newly tested media activity into the ‘business as usual’ media mix ⁄ Adjusting targeting to improve efficiency