Download to read offline
![containing streams were carried out at 773 K to re-oxidize
samples. A thermocouple located within the catalyst bed was
used to measure local temperatures; another thermocouple
inserted within the heater beneath the sample holder recorded
temperatures as much as 100 K above sample temperatures, as
previously reported.9,11 Propane ODH experiments were con-
ducted at 603 K using C3H8 (Airgas, 99.9%) and O2 (Airgas,
99.99%) reactants diluted to the desired partial pressures with
Ar (Airgas, 99.999%). Partial pressures for each reactant were
varied independently from 1.0 to 16 kPa, while keeping the other
reactant at 4.0 kPa; the intervals between composition changes
were 300 s.
Results and Discussion
UV-visible measurements were carried out during transient
ODH reaction conditions. The experiments were carried out
using a catalyst treated for 300 s of exposure to 4.0 kPa O2.The
inlet stream was then switched to one containing C3H8 and O2
for 300 s. The partial pressure of one of the reactants was held
constant for the duration of the ODH experiment, while the other
was varied every 300 s. Absorption intensities (at 1.86 eV) were
converted to extent of reduction and the catalytically irrelevant
portion of the measured absorbance was excluded using methods
previously reported.19,20 Figure 1, which was adapted from a
previous publication,20 shows reduction transients resulting from
step-wise changes in C3H8 pressure at constant O2 pressure; each
cycle feed composition cycle was followed by a treatment in 4
kPa O2 at 603 K for 300 s. Results similar to those shown in
Figure 1 were obtained with O2 partial-pressure cycles (not
shown). In this latter case, the experiment was started by
switching from a stream containing 4 kPa O2 to one consisting
of 16 kPa O2 and 4 kPa of C3H8.
As noted previously,20 transient responses, such as those
shown in Figure 1, contain two componentssa rapid response
with a time-scale of catalytic turnovers (<1000 s) and a
significantly slower process, which reflects changes in the
structure of the vanadia domains or oxygen removal from the
internal crystalline region, without direct relevance to the
dynamics of catalytic turnovers. The procedure described
previously20 was used to isolate the portion of each transient
that reflects catalytically relevant processes. The resulting
transients are shown in Figures 2-4. We note that transients
involving increasing or decreasing concentrations were identical,
except for the sign of the transient, and that repeated transients
were highly reproducible.
The observed transient responses were fitted to the time
dependence of the concentration of reduced centers derived from
a previously reported mechanism of ODH processes,29,30 modi-
fied to account for combustion pathways (Scheme 1, reactions
1-5). The concentrations of four surface intermediates in the
mechanism were considered initially: oxygen ([O*]), vacancies
([*]), hydroxyl groups ([OH*]), and isopropoxide species
([C3H7O*]). The combustion steps were not analyzed in detail,
as indicated by the ellipsis in reactions 3a and 3b. The sequence
of elementary steps leading to combustion products ultimately
results in the formation of the number of reduced-surface species
shown in reactions 3a and 3b. These steps are known to involve
surface oxygen and reduced-surface species because lattice
oxygen atoms from the catalyst are incorporated in all combus-
tion products, as shown by isotopic labeling studies.29-31 The
first step was assumed to be quasi-equilibrated with a small K1
value. Consequently, the concentration of physisorbed propane
[(C3H8O*]) can be neglected in the site balance. Step 2 is the
kinetically relevant step,29-30 and rate constants of subsequent
steps are, therefore, inaccessible from steady-state rate data.
A set of coupled, nonlinear differential equations were derived
to described the time-dependent response of the surface spe-
cies.31 These equations were then non-dimensionalized using
the ratio of each surface species concentration to the total
concentration of active surface sites ([L]). Thus, χ ) [OH*]/
[L], φ ) [*]/[L], θ ) [C3H7O*]/[L], ψ ) [O*]/[L], and χ + φ
+ θ + ψ ) 1. As a result, only three of the differential equations
are independent, and the time-dependent response of the fourth
surface species may be obtained from this overall site balance.
The three differential equations describing the surface-reduced
species and the algebraic equation representing the fraction of
surface oxygen, derived from the site balance, are given by eqs
1-4. A derivation of these equations is given in ref 31.
The dimensionless reduced time, τ, is defined as the actual time
divided by the characteristic time for the kinetically relevant
C-H bond activation step:
Figure 1. Extent of reduction during step changes in C3H8 concentra-
tion of 300 s duration, starting from the fully oxidized catalyst [10
wt% V2O5/Al2O3 (8.0 V nm-2
), 603 K, 4.0 kPa O2, each cycle
progresses through 0, 1.0, 2.0, 4.0, 8.0, 16, 8.0, 4.0, 2.0, 1.0 kPa C3H8,
balance Ar, 603 K]. Adapted from ref 20.
dχ
dτ
) ( 1 - χ - θ - φ)2
+ λ1
1
[C3H8]
θ - 2
2
[C3
H8]
χ2
+
2 3
[H2O]
[C3H8]
(1 - χ - θ - φ)φ (1)
dθ
dτ
) (1 - χ - θ - φ)2
-
1
[C3H8]
θ (2)
dφ
dτ
) λ2
1
[C3H8]
θ +
2
[C3H8]
χ2 - 3
[H2O]
[C3H8]
(1 - χ - θ -
φ)φ - 2 4
[O2]
[C3H8]
φ2
(3)
ψ ) 1 - χ - θ - φ (4)
τ )
t
τr
) K1k2[C3H8]t (5)
Catalytic Oxidation of Alkanes on Vanadium Oxides J. Phys. Chem. B, Vol. 109, No. 6, 2005 2415](https://image.slidesharecdn.com/cat-180426143117/85/Cat-2-320.jpg)
![The other four parameters, i, are defined as
The factors λi are defined as
where x1 and x2 are the fractional selectivities to propene and
CO, respectively.
The numerical solution of eqs 1-4 was fitted to the transient
response data shown in Figures 2-4 by adjusting the values of
k2K1, k3, k4, k-4, and k5. The reactant concentrations used in
eqs 1-4 were those prevailing during the transient. Since the
conversions of C3H8 and O2 were small (<1% and <5%,
respectively), inlet concentrations were used. The water con-
centration during the transient could not be reliably measured
by mass spectroscopy; instead, it was calculated based on the
stoichiometric amount expected for the observed concentrations
of propene, CO, and CO2. Since steady-state observations
showed the selectivity to C3H6 and CO to be nearly independent
of feed composition at low reactant conversions, the values of
x1 and x2 were taken to be constant (see Table 1).2,3
The extent of reduction, defined as the number of one-electron
reduced centers per V atom (nr), was calculated by adding the
fractional coverages of all reduced species after doubling
vacancy concentrations, which represent two-electron reduction
events (eq 8). The parameters τr and i were obtained using
Figure 2. Experimental data (heavy lines) compared with the simplified model results (light lines) for normalized extent of reduction response
during 300 s transients. Figure 2a-e are C3H8 concentration transients [(a) 1.0, (b) 2.0, (c) 4.0, (d) 8.0, and (e) 16 kPa C3H8 at 4.0 kPa O2]. Figure
2f-j are O2 concentration transients [(f) 16, (g) 8.0, (h) 4.0, (i) 2.0, and (j) 1.0 kPa O2 at 4.0 kPa C3H8]. [3.5 wt% V2O5/Al2O3 (2.3 V nm-2
), 603
K].
1 )
k3
k2K1
2 )
k-4
k2K1
3 )
k4
k2K1
4 )
k5
k2K1
(6)
λ1 ) 7 - 6x1 (7a)
λ2 ) 3(2 - 2x1 - x2) (7b)
nr ) χ + θ + 2φ (8)
2416 J. Phys. Chem. B, Vol. 109, No. 6, 2005 Argyle et al.](https://image.slidesharecdn.com/cat-180426143117/85/Cat-3-320.jpg)
![standard nonlinear regression techniques in Mathematica 4.0.
The initial values of τr and i were varied over 8 orders of
magnitude to ensure that the chosen parameters corresponded
to global error minima in the estimation procedure.
These methods of analysis indicate that vacancies are the
predominant reduced species (φ ) [*]/[L] ) 0.05 at 16 kPa
C3H8, 4 kPa O2 on 10 wt% V2O5/Al2O3) at the low-water-
concentration conditions prevalent in this study. The same
conclusion was drawn from steady-state reaction rates.19,20
Vacancies account for most (>90%) of the reduced species for
all catalysts and reactant ratios. Consistent with this, the best
fit of the model to the data was insensitive to the values of 1,
2, and 3. The insensitivity of the model to the value of 1
suggests that isoproproxide conversion rate constants are
significantly larger than those for its formation; hence, θ reaches
steady-state more rapidly than nr. In agreement with this
conclusion, the steady-state values of θ are small, e.g., θ < 4
× 10-4 at 16 kPa C3H8, 4 kPa O2 on 10 wt% V2O5/Al2O3. The
insensitivity of the model to the value of 2 and 3 suggests
that water-formation steps are quasi-equilibrated, as assumed
in previous mechanistic analyses and confirmed by kinetic and
isotopic tracer studies.29-32 The steady-state values of χ are also
small (e.g., χ < 0.003 at 16 kPa C3H8, 4 kPa O2 on 10 wt%
V2O5/Al2O3). The small values of θ and χ lead to a simple
expression for the concentration of reduced centers (eq 9):
The model was then simplified by applying the pseudo-
steady-state hypothesis to θ and χ ([C3H7O*]/[L] and [OH*]/
[L], respectively), which implies that the derivatives of θ and
χ with respect to τ are small and do not vary significantly with
Figure 3. Experimental data (heavy lines) compared with the simplified model results (light lines) for normalized extent of reduction response
during 300 s transients. Figure 3a-e are C3H8 concentration transients [(a) 1.0, (b) 2.0, (c) 4.0, (d) 8.0, and (e) 16 kPa C3H8 at 4.0 kPa O2]. Figure
3f-j are O2 concentration transients [(f) 16, (g) 8.0, (h) 4.0, (i) 2.0, and (j) 1.0 kPa O2 at 4.0 kPa C3H8]. [10 wt% V2O5/Al2O3 (8.0 V nm-2
), 603
K].
nr = 2φ (9)
Catalytic Oxidation of Alkanes on Vanadium Oxides J. Phys. Chem. B, Vol. 109, No. 6, 2005 2417](https://image.slidesharecdn.com/cat-180426143117/85/Cat-4-320.jpg)
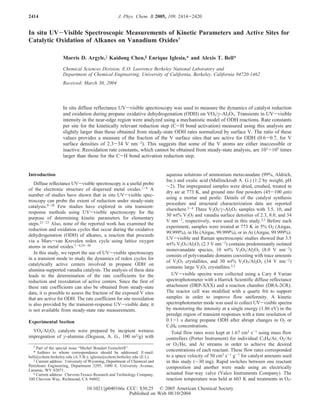
![time in the time scale of the transient response of turnover rates
for the entire catalytic sequence. Since steady-state φ values
are small (<0.05), ψ was taken to be ∼1.0. With these
simplifying assumptions, the time-dependent response of the
Figure 4. Experimental data (heavy lines) compared with the simplified model results (light lines) for normalized extent of reduction response
during 300 s transients. Figure 4a-e are C3H8 concentration transients [(a) 1.0, (b) 2.0, (c) 4.0, (d) 8.0, and (e) 16 kPa C3H8 at 4.0 kPa O2]. Figure
4f-j are O2 concentration transients [(f) 16, (g) 8.0, (h) 4.0, (i) 2.0, and (j) 1.0 kPa O2 at 4.0 kPa C3H8]. [30 wt% V2O5/Al2O3 (34 V nm-2
), 603
K].
TABLE 1: Initial Propane ODH Selectivities to C3H6 (x1),
CO (x2), and CO2 (x3) Obtained from Steady-State ODH
Experiments2,a
catalyst
(wt% V2O5
on Al2O3)
C3H6
selectivity
(x1)
CO
selectivity
(x2)
CO2
selectivity
(x3)
3.5 0.85 0.086 0.064
10 0.84 0.11 0.05
30 0.74 0.19 0.07
a
603 K, 14 kPa C3H8, 1.7 kPa O2, balance He.
SCHEME 1
2418 J. Phys. Chem. B, Vol. 109, No. 6, 2005 Argyle et al.](https://image.slidesharecdn.com/cat-180426143117/85/Cat-5-320.jpg)
![reduced centers reduces to one nonlinear differential equation31
with the solution:
where a ) 2λ2 + (1 + λ1), b2 ) 4 [O2]/[C3H8] evaluated at
the reactant concentrations prevalent during the transient, and
nr
SSi
is the value of nr at steady-state either at the start of the
transient, i ) 1, or at the end, i ) 2.31
At steady-state, the surface concentration of reduced centers,
nr
ss
, is given by:
Equation 13 predicts that for each catalyst, nr
ss
only depends on
([C3H8]/[O2])0.5. Assuming λ1 and λ2 to be independent of feed
composition, 4 can be determined for each catalyst from a fit
of eq 13 to a plot of nr
ss
versus ([C3H8]/[O2])0.5 data, as shown
in Figure 5. The values of 4 determined in this manner are
given in Table 2 for each catalyst.
The transient-response data obtained for each catalyst were
fitted to the numerical model solution of eq 10 by adjusting the
value of K1k2, assuming the value of 4 ) k5/k2K1 to be that
obtained from steady-state data (see Table 2). The results of
the simplified model are compared with experimental data in
Figures 2-4, for 3.5, 10, and 30 wt% V2O5/Al2O3, respectively.
The ordinate in these plots is the normalized extent of reduction,
nr*, which is given by:
In eq 14, nr
SS1
is the extent of reduction at steady-state
immediately before a step change in inlet concentration, and
nr
SS2
is the steady-state extent of reduction reached at the end
of the imposed transient. The dark lines in Figures 2-4 represent
experimental data, and the lighter lines represent model predic-
tions. The leftmost columns in Figures 2-4 (labeled a-e) show
experiments in which C3H8 partial pressure was varied at
constant O2 pressure. The rightmost columns (labeled f-j)
contain results of varying O2 at constant C3H8 partial pressure.
This single-parameter model accurately describes transient
data at short times but becomes less accurate at longer times
(Figures 2-4), suggesting that different types of surface sites
with a range of turnover frequencies may be involved in the
reaction, as expected for surfaces with V atoms in various
geometries (e.g., edges and plateaus). In addition, the model
tends to underestimate the initial slope at low C3H8 and O2
partial pressures and to overestimate the slope at high C3H8 and
O2 partial pressures. No explanation for this behavior can be
given at this time.
Table 3 shows the rate parameters obtained from this transient
model. The values of K1k2 obtained from these data increase
with increasing vanadia surface density in a manner similar to
that observed for the K1k2 values obtained from steady-state
rate data.29,30 As discussed previously,20,29,30 this pattern is
attributable to the greater reducibility of oxide domains as they
evolve from monovanadate to two-dimensional polyvanadate
structures with increasing V surface density. More-reducible
catalysts are able to stabilize most effectively the transition states
Figure 5. Dependence of the extent of catalytically relevant reduction
per surface V atom on the C3H8:O2 ratio for VOx/Al2O3 catalysts during
propane ODH [filled symbols, C3H8 dependence (1.0-16 kPa C3H8,
4.0 kPa O2, balance Ar, 603 K); open symbols, O2 dependence (4.0
kPa C3H8, 1.0-16 kPa O2, balance Ar, 603 K); diamonds, 3.5 wt%
V2O5/Al2O3 (2.3 V nm-2
); squares, 10 wt% V2O5/Al2O3 (8.0 V nm-2
);
triangles, 30 wt% V2O5/Al2O3 (34 V nm-2
); filled circles are C3H8
dependence (8.0 kPa O2, 1.0-12 kPa O2, balance Ar, 603 K) for 10
wt% V2O5/Al2O3 (8.0 V nm-2
)]. Adapted from ref 20.
d(nr)
dτ
)
d(2φ)
dτ
) 2λ2 + (1 + λ1) - 4
[O2]
[C3H8]
(2φ)2
(10)
nr ) (a
b2
)1/2(1 - C1,2e-2τ ab2
)
(1 + C1,2e-2τ ab2
)
(11)
C1,2 )
nr
SS2
- nr
SS1
nr
SS2
+ nr
SS1
(12)
nr
ss
) 2φ ) (2λ2 + (1 + λ1)
4
[C3H8]
[O2] )
0.5
(13)
TABLE 2: Values of E4 Obtained from Steady-State
Propane ODH Experiments20,a
catalyst (wt%
V2O5 on Al2O3) 4
b
3.5 101 000
10 1900
30 1700
a
603 K, 1.0-16 kPa C3H8, 1.0-16 kPa O2, balance He.
TABLE 3: Comparison of Propane ODH Rate Constants
Obtained from UV-Visible Transient Dataa with Those
Obtained from Steady-State Kinetic Experiments2 a
catalyst
(wt% V2O5
on Al2O3)
V surface
density
(V nm-2)
k5
b
[cm3 (mol s
active site)-1]
K1k2
b
[cm3 (mol s
active site)-1]
K1k2
c,d
[cm3 (mol s
Vs)-1]
Vs,cat/
Vs
d,e
3.5 2.3 3.4 × 10⁶ 34 25 0.71
10 8.0 5.9 × 10⁵ 310 180 0.58
30 34 4.6 × 10⁵ 280 190 0.63
a
603 K, 14 kPa C3H8, 1.7 kPa O2, balance He. b
Results from UV-
visible transient experiments. c
Results from steady-state propane ODH
experiments.2 d
Vs represents surface vanadia, assuming that a maxi-
mum of 7.5 V nm-2
are exposed. e
Vs,cat represents catalytically relevant
surface vanadia.
nr* )
(nr - nr
SS1
)
(nr
SS2
- nr
SS1
)
(14)
Catalytic Oxidation of Alkanes on Vanadium Oxides J. Phys. Chem. B, Vol. 109, No. 6, 2005 2419](https://image.slidesharecdn.com/cat-180426143117/85/Cat-6-320.jpg)
![required for C-H bond activation, which in turn require
delocalization of electron density by vanadium centers.
The rate coefficient for reoxidation of catalytically active sites
is large (∼106 cm3 mol-1 s-1), but decreases in magnitude with
increasing vanadia surface density. It is also evident that k5 is
significantly larger than K1k2, consistent with the low extent of
reduction during steady-state catalysis. We also note that for
equal driving forces ([O2] ) [C3H8] and [*] ) [O*]), the rate
of reoxidation (rOx ) k5[O2][*]2/[L]) is about 103 larger than
the rate of reduction (rRed ) K1k2[C3H8][O*]2/[L]) for the range
of O2 and C3H8 partial pressures used in this investigation. The
decrease in the value of k5 with increasing V surface density is
consistent with the observed changes in 4 and K1k2. This
suggests that the activation barrier to reoxidation of reduced
vanadia species in isolated vanadate or small polyvanadate
species is lower that than that for larger polyvanadate species.
Table 3 compares values of K1k2 with those obtained from
steady-state kinetic analysis.2,3 For the analysis of transient-
response data, it is not necessary to measure independently the
number of active surface V atoms in order to calculate an
intrinsic rate parameter per active site. Consequently, the value
of K1k2 determined from the UV-visible results directly reflects
the reactivity of active sites participating in the reaction. In
contrast, measured steady-state ODH rates are normalized by
the number of surface V atoms,20 which may not accurately
represent those accessible or active for catalytic reactions. In
estimating steady-state turnover rates, it was assumed that for
V surface densities of 7.5 V nm-2 or below (the value for a
polyvanadate monolayer), all V centers were accessible to
reactants. For V surface densities greater than 7.5 V nm-2, it
was assumed that the density of V sites available for catalysis
was equivalent to one monolayer of polyvanadate species
because excess VOx species tend to form large V2O5 clusters
that do not contribute significant additional VO surface area.
Dividing the value of K1k2 obtained from the transient-response
experiment by that obtained from steady-state experiments
provides an estimate of the fraction of accessible V centers that
are active for propane ODH reactions at the conditions of our
experiments. These fractions are reported in the last column of
Table 3; they range from 0.71 in 3.5 wt% V2O5/Al2O3 to ∼0.60
in 10 and 30 wt% V2O5/Al2O3. Thus, if the accessibility
assumptions used in estimating steady-states are accurate, most,
but not all of the accessible V atoms are active in ODH
reactions. An alternate possibility is that only 71% of V atoms
in 3.5 wt% V2O5/Al2O3 are accessible and thus active, as a result
of the incipient formation of three-dimensional V2O5 clusters
with a fraction of V species in their inaccessible bulk. Similarly,
for 10 and 30 wt% V2O5/Al2O3 samples, it is possible that only
a fraction of the support surface is covered by a two-dimensional
polyvanadate monolayer and that nucleation of some V2O5
clusters occurs at surface densities below those calculated from
geometric arguments for a theoretical polyvanadate monolayer.
Conclusions
In situ UV-visible spectroscopy can be used to follow the
dynamics of catalyst reduction and oxidation during the oxida-
tive dehydrogenation of propane over alumina-supported va-
nadia. The rate constant for vanadia reduction obtained from
an analysis of the transient-response, UV-visible data can be
compared with the same rate constant obtained from an analysis
of steady-state kinetic rate data to estimate the fraction of the
exposed vanadia that is catalytically active. This fraction lies
between 60 and 70%, suggesting that some of the surface V
atoms are either inaccessible for propane ODH or are not active
catalytically. The rate coefficient for vanadia reoxidation is 3-5
orders of magnitude faster than that for reduction, and conse-
quently, only a small fraction of the catalytically active V sites
is reduced under steady-state conditions.
Acknowledgment. The authors wish to thank Nick Ohler
for providing the Mathematica program used to model the
experimental data and to determine the global minima. This
work was supported by the Director, Office of Basic Energy
Sciences, Chemical Sciences Division of the U.S. Department
of Energy under Contract DE-AC03-76SF00098.
References and Notes
(1) Chen, K. D.; Khodakov, A.; Yang, J.; Bell, A. T.; Iglesia, E. J.
Catal. 1999, 186, 325.
(2) Argyle, M. D.; Chen, K. D.; Bell, A. T.; Iglesia, E. J. Catal. 2002,
208, 139.
(3) Khodakov, A.; Olthof, B.; Bell, A. T.; Iglesia, E. J. Catal. 1999,
181, 205.
(4) Olthof, B.; Khodakov, A.; Bell, A. T.; Iglesia, E. J. Phys. Chem.
B 2000, 104, 1516.
(5) Eon, J. G.; Olier, R.; Volta, J. C. J. Catal. 1994, 145, 318.
(6) Vuurman, M. A.; Wachs, I. E. J. Phys. Chem. 1992, 96, 5008.
(7) Weber, R. S. J. Catal. 1995, 151, 470.
(8) Brus, L. E. J. Chem. Phys. 1984, 80, 4403.
(9) Gao, X.; Jehng, J. M.; Wachs, I. E. J. Catal. 2002, 209, 43.
(10) Puurunen, R. L.; Beheydt, B. G.; Weckhuysen, B. M. J. Catal.
2001, 204, 253.
(11) Gao, X.; Bare, S. R.; Fierro, J. L. G.; Wachs, I. E. J. Phys. Chem.
B 1999, 103, 618.
(12) Gao, X.; BaZares, M. A.; Wachs, I. E. J. Catal. 1999, 188, 325.
(13) Gao, X.; Bare, S. R.; Weckhuysen, B. M.; Wachs, I. E. J. Phys.
Chem. B 1998, 102, 10842.
(14) Wei, D.; Wang, H.; Feng, X.; Chueh, W.; Ravikovitch, P.;
Lyubovsky, M.; Li, C.; Takeguchi, T.; Haller, G. L. J. Phys. Chem. B 1999,
103, 2113.
(15) Melsheimer, J.; Mahmoud, S. S.; Mestl, G.; Schlo¨gl, R. Catal. Lett.
1999, 60, 103.
(16) Weckhuysen, B. M. Chem. Commun. 2002, 97.
(17) Weckhuysen, B. M.; Schoonheydt, R. A. Catal. Today 1999, 49,
441.
(18) Bru¨ckner, A. Chem. Commun. 2001, 2122.
(19) Argyle, M. D.; Chen, K. D.; Resini, C.; Krebs, C.; Bell, A. T.;
Iglesia, E. Chem. Commun. 2003, 2082.
(20) Argyle, M. D.; Chen, K. D.; Resini, C.; Krebs, C.; Bell, A. T.;
Iglesia, E. J. Phys. Chem. B 2004, 108, 2345.
(21) Weckhuysen, B. M.; Verberckmoes, A. A.; Debaere, J.; Ooms, K.;
Langhans, I.; Schoonheydt, R. A. J. Catal. 2000, 151, 115.
(22) Bensalem, A.; Weckhuysen, B. M.; Schoonheydt, R. A. J. Phys.
Chem. B 1997, 101, 2824.
(23) Grubert, G.; Rathousky, J.; Schulz-Ekloff, G.; Wark, M.; Zukal,
A. Microporous Mesoporous Mater. 1998, 22, 225.
(24) Kung, H. H. AdV. Catal. 1994, 40, 1.
(25) Mamedov, E. A.; Corte´s Corbera´n, V. Appl. Catal. A 1995, 127,
1.
(26) Albonetti, S.; Cavani, F.; Trifirb, F. Catal. ReV.sSci. Eng. 1996,
38, 413.
(27) Blasco, T.; Lo´pez Nieto, J. M. Appl. Catal. A 1997, 157, 117.
(28) BaZares, M. A. Catal. Today 1999, 51, 319.
(29) Chen, K. D.; Bell, A. T.; Iglesia, E. J. Phys. Chem. B 2000, 104,
1292.
(30) Chen, K. D.; Iglesia, E.; Bell, A. T. J. Catal. 2001, 192, 197.
(31) Argyle, M. D. Ph.D. Dissertation, University of California, Berkeley,
CA, 2003.
(32) Argyle, M. D.; Chen, K. D.; Bell, A. T.; Iglesia, E. J. Phys. Chem.
B 2002, 106, 5421.
2420 J. Phys. Chem. B, Vol. 109, No. 6, 2005 Argyle et al.](https://image.slidesharecdn.com/cat-180426143117/85/Cat-7-320.jpg)

The document describes an in situ study using UV-visible spectroscopy to measure the kinetics of propane oxidative dehydrogenation (ODH) on vanadium oxide catalysts. Transients in UV-visible intensity during ODH reactions were analyzed using a surface reaction mechanism. Rate constants for the kinetically relevant C-H bond activation step were determined and compared to values from steady-state ODH rates. The ratio of these values provides a measure of the fraction of active vanadium sites. Reoxidation rate constants, which cannot be obtained from steady-state analysis, were also determined and found to be orders of magnitude larger than C-H bond activation rates.


![[Chemical and process engineering] pdu scale experimental results of co2 remo...](https://cdn.slidesharecdn.com/ss_thumbnails/chemicalandprocessengineeringpdu-scaleexperimentalresultsofco2removalwithamppzsolvent-180705065926-thumbnail.jpg?width=640&height=640&fit=bounds)


