This document is an introduction to the Cashew Handbook 2014 published by Cashewinfo.com in association with the African Cashew Alliance. It provides an overview of some of the key focus areas and contributors to the handbook. The handbook focuses on cashew processing technologies and innovations in machinery and system integration that have led to efficiency gains. It thanks external contributors for their insights on various aspects of the cashew industry. It also acknowledges the marketing, editing, and design team for their work in producing the handbook. The goal is to make the handbook accessible to the global cashew industry in print and digital formats.


![CASHEW HANDBOOK 2014 - GLOBAL PERSPECTIVE, SECTION 2
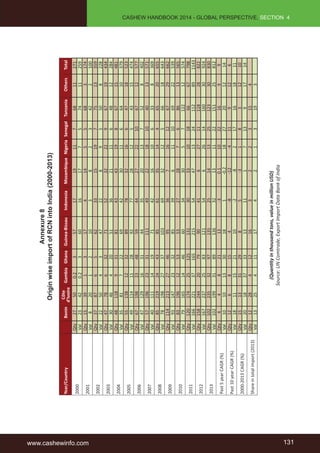
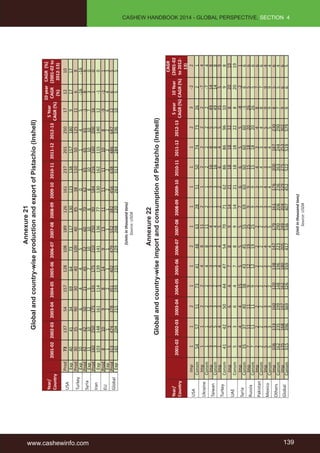
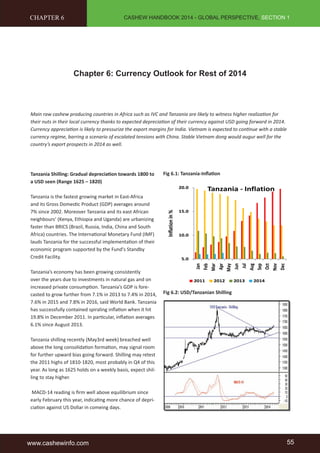
CHAPTER 7
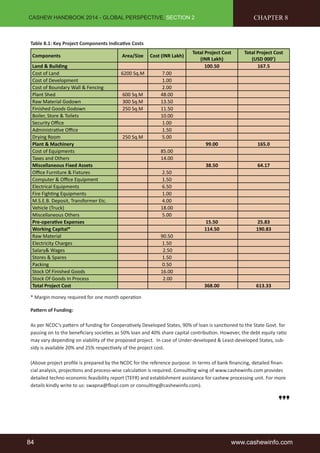
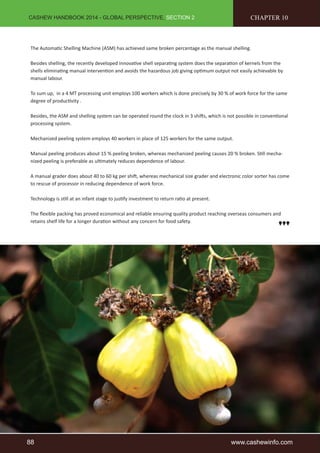
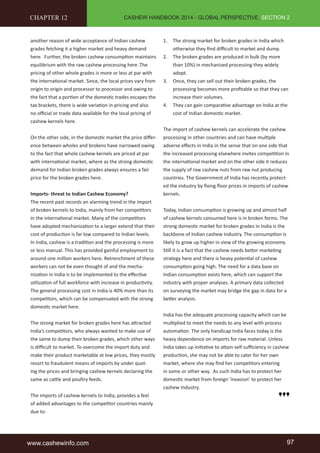
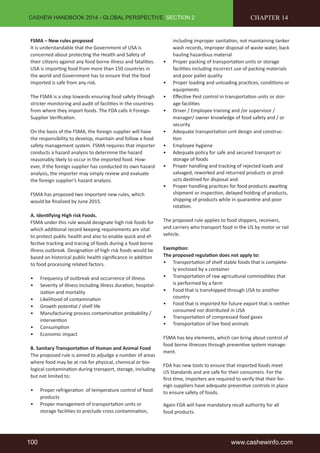
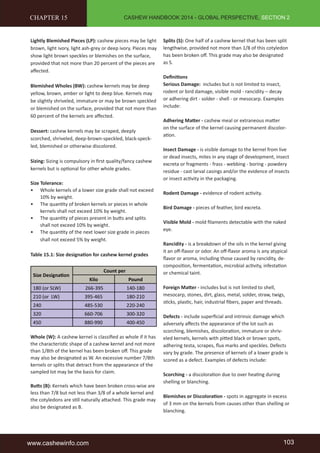
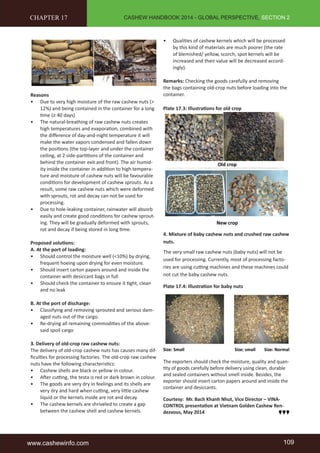
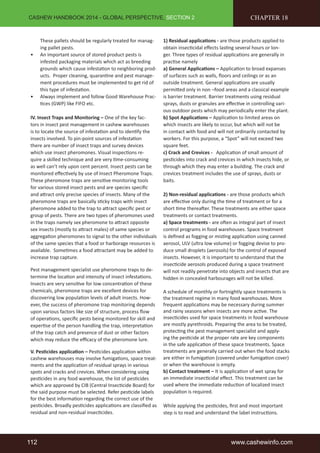
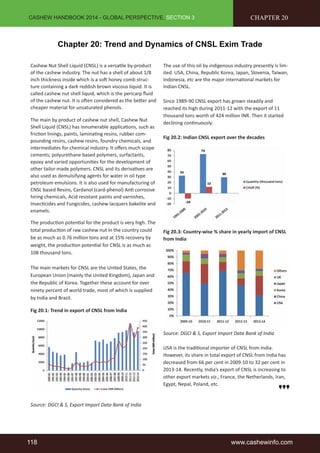
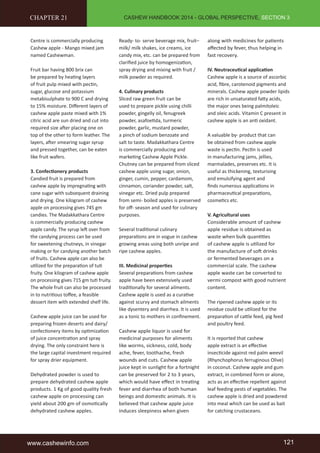
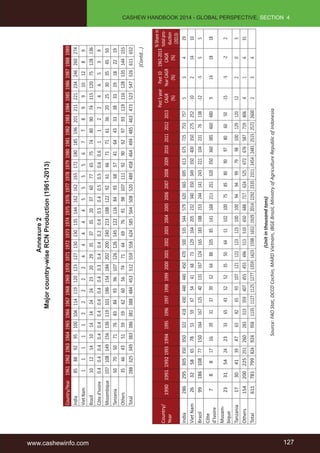
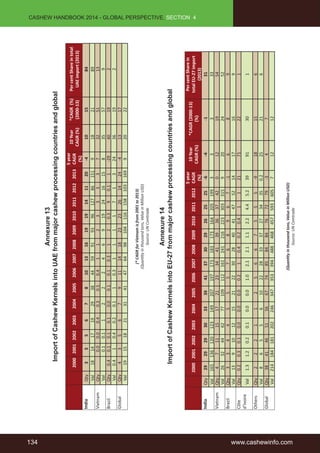
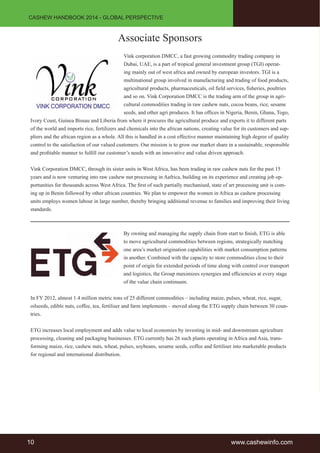
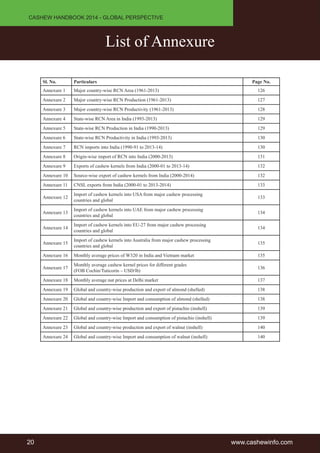
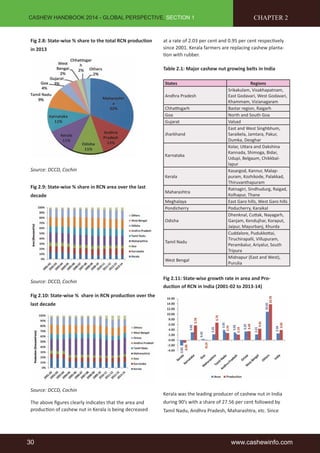
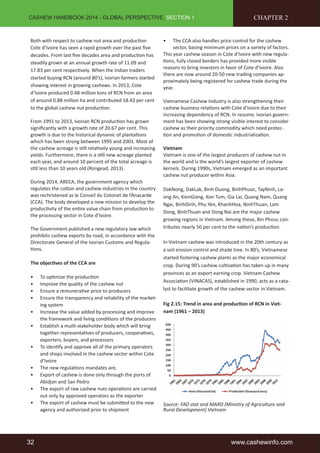
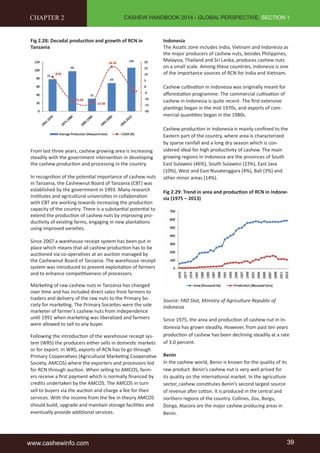
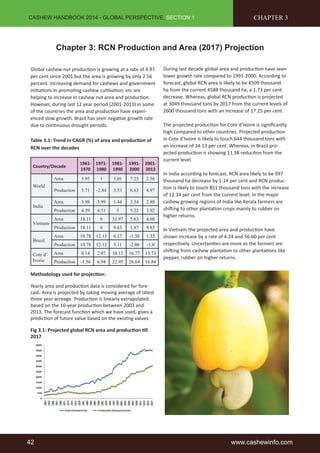
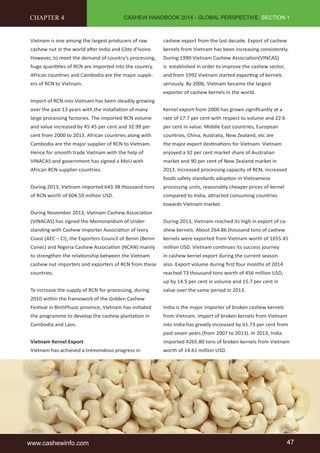
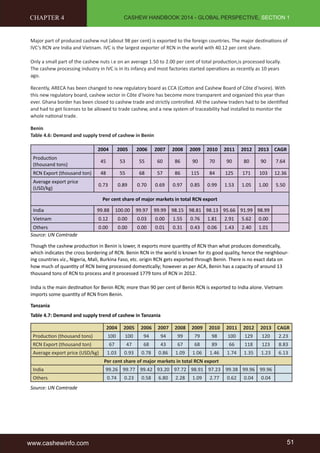
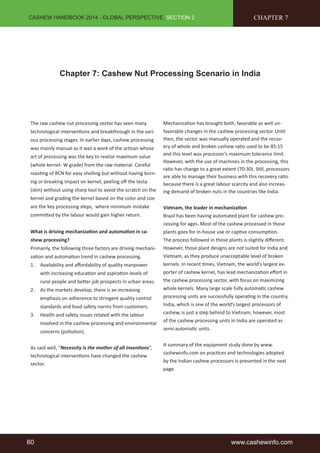
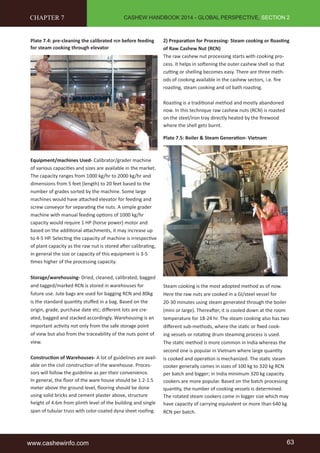
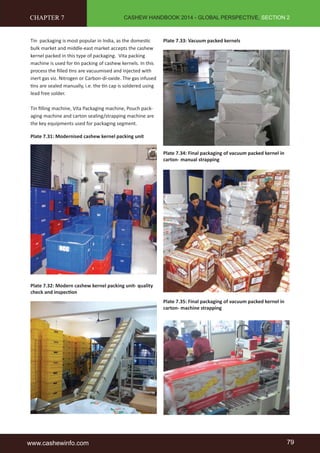
Table 7.1: Decision-making criteria for selecting most appropriate equipment for cashew processing
Sl.No. Crucial Parameters Typical Statistics
1. Projected Capacity 4 MT per day
2. Total no. of workers intended to be employed 125 - 150 Nos.
3. Space availability & total built up area
1 Acre / 12000 Sq. ft built up area (excluding Raw
material storage space)
4 Power availability 100 HP
5. Working Capital Based on individual capacity
6. Market potential for Sales Based on Survey
7. Port connectivity for Import / Export Based on Location
8. Open land / Drying yard facility 0.5 Acre
9. Water availability
4000 to 5000 Ltrs considering [industrial & domestic
consumption]
10. Level of Mechanisation preferred
Selectively mechanised to optimise the yield of whole kernels and
minimum broken
11. Provision for expandability 25%
Based on the above parameters a typical list of equipments required to process assuming 4 MT RCN / day would be as
follows:
Table 7.2: Principal Equipments:
Sl.No. Principal Equipments Qnty Capacity Power reqd. Working space reqd.
1
Material Handling Equip-ments
for the Drying yard
1 Set 10 -20 MT/ day 5 HP Mobile Eqpt
2 Raw Cashew Nut Sorter 1 No. 8 Mt / day 2 HP 400 ft2
3
Elevator for loading RCN
into Sorter
1 No. 12 Mt / day 2 HP 100 ft2
4 Boiler 1 No. 300 kg /hr Steam Generator 2 HP 500 ft2
5 Cookers 2 Nos. 320 Kg /hr --- 250 ft2
6
Elevator for loading RCN
into Cookers
1 No. 12 Mt / day 2 HP 100 ft2
7
Automatic Cutting ma-chines
25 – 32 Nos.
160 Kg / Machine / day shift
Raw Cashew Nuts
16 HP 2500 ft2
8 Steam Drier 2 Nos. 1000 Kgs/ Drier/ day shift 4 HP 1000 ft2
9 Humidification 1 No. 1500 Kg Kernels / day shift 0.5 HP 150 ft2
10
Peeling Machine including
Compressor
1 Set. 1600 Kg Kernels / day shift 32 HP 250 ft2
11
Peeled kernels sorting
conveyor
1 No. 1600 Kg Kernels / day shift 0.5 HP 100 ft2
12 Colour Sorter 1 No. 1000 Kg/ day shift 0.5 HP 75 ft2
13 Kernel Grader 2 Nos. 1200 Kg / day shift 6.0 HP 500 ft2
14 Pieces Sizing Machine 1 No. 1000 Kg / day shift 1.0 HP 100 ft2
15 Husk Winnowing Machine 1 No. 250 Kg Husk / day shift 3 .0 HP 100 ft2
16 Tin Filling Machine 1 No. 1500 Kg Kernels / day shift 1.0 HP 100 ft2
17 Vita Packing Machine 1 No. 2000 Kg Kernels / day shift 1.0 HP 75 ft2
18 Pouch Packing machine 1 No. 2400 Kg Kernels / day shift 7.0 HP 300 ft2
19 Carton Strapping Machine 1 No. 150 Cartons / day shift 1.0 HP 75 ft2
20
a.
b.
c.
d.
e.
f.
Utility Equipments:
Wheel Barrow
Scooping Tables
Peeling Tables
Grading Tables
Platform Trolley
Crate Trolley
2 -3 Nos.
24 -32 Nos.
5 – 8 Nos.
4 -6 Nos.
1 -2 Nos.
2 -3 Nos.
Mobile Eqpt
2000 ft2
750 ft2
500 ft2
Mobile Eqpt
Mobile Eqpt
Courtesy: Abhay Engineers, Mangalore, India
www.cashewinfo.com 81](https://image.slidesharecdn.com/cashewhandbook2014-141201022838-conversion-gate02/85/Cashew-handbook-2014-77-320.jpg)
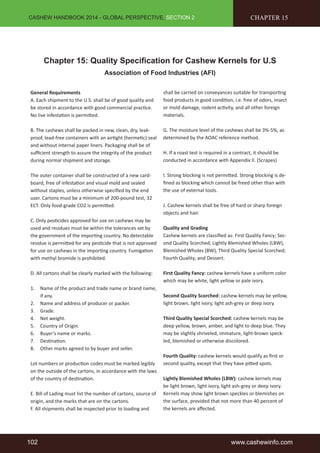
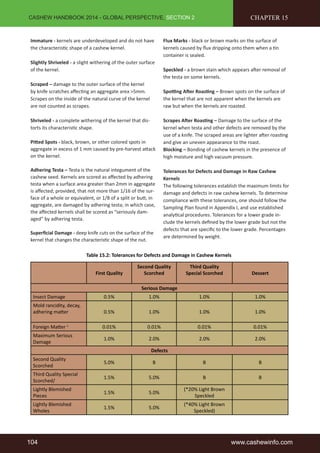
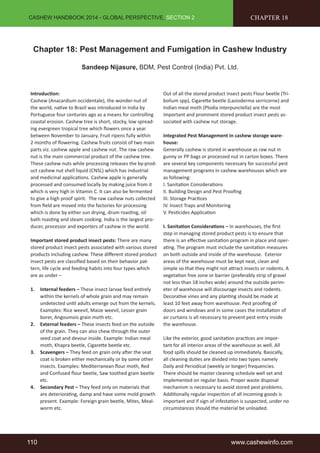
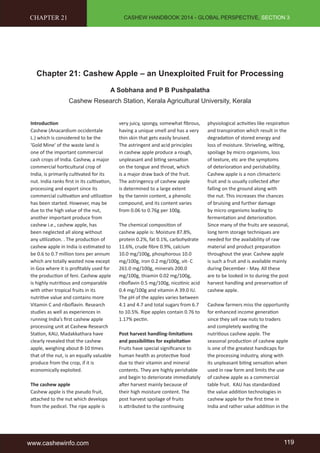
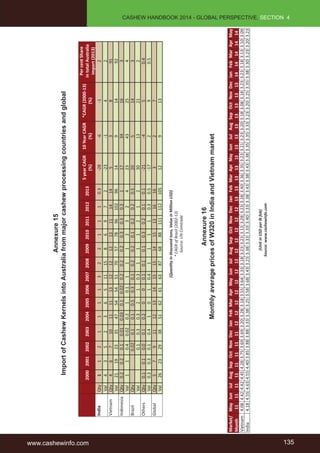
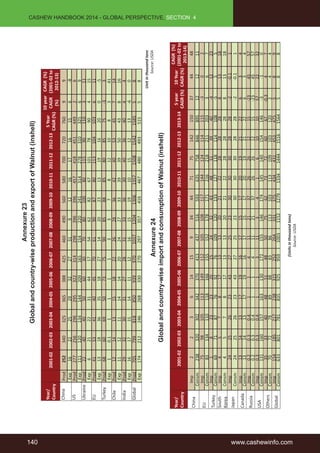
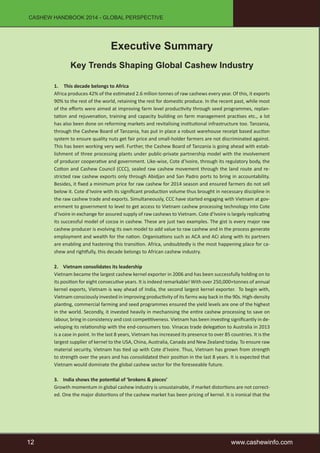
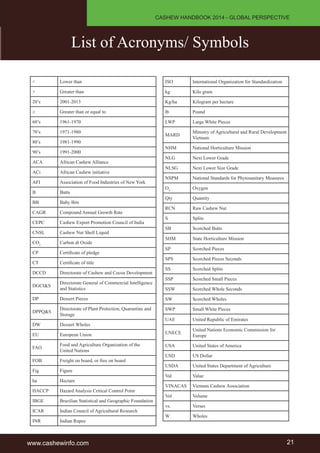
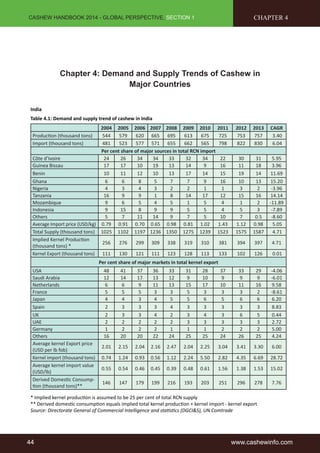
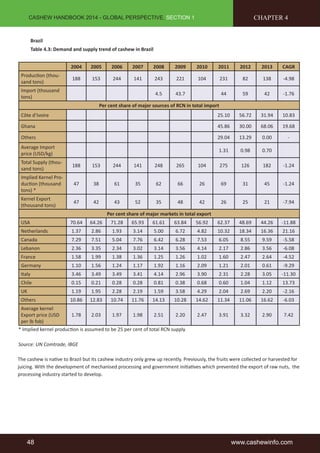
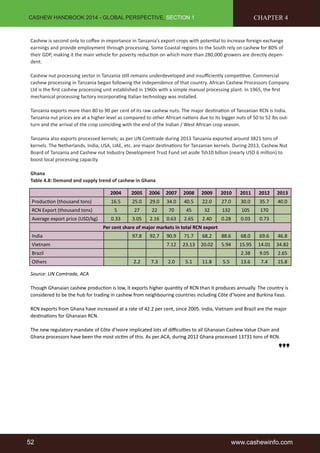
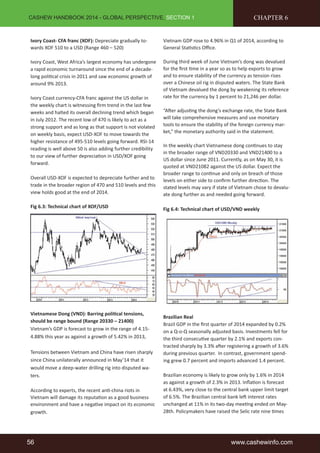
![CASHEW HANDBOOK 2014 - GLOBAL PERSPECTIVE, SECTION 2
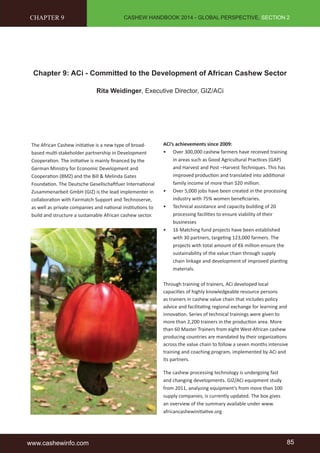
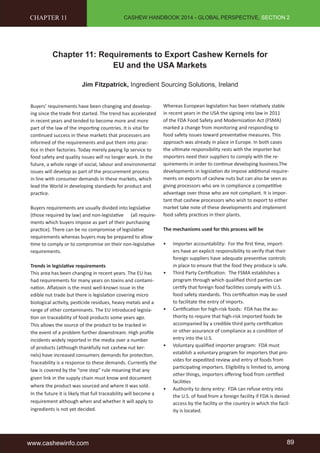
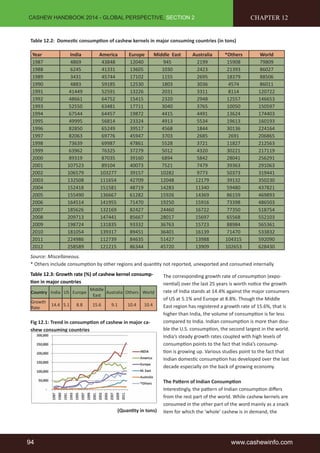
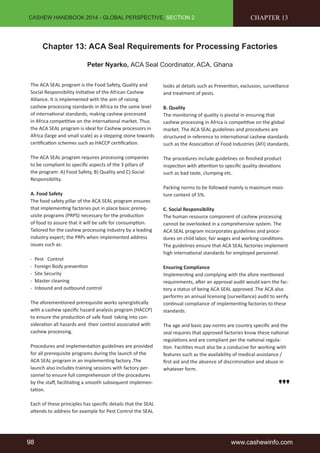
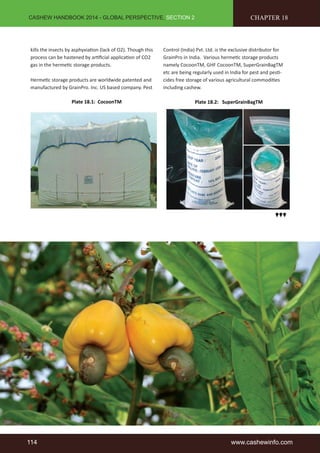
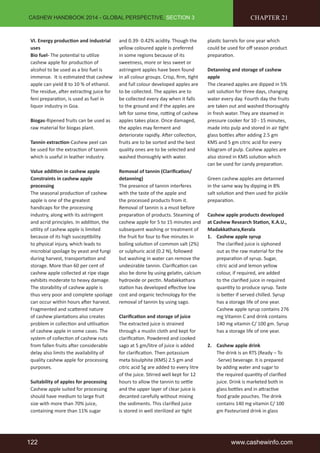
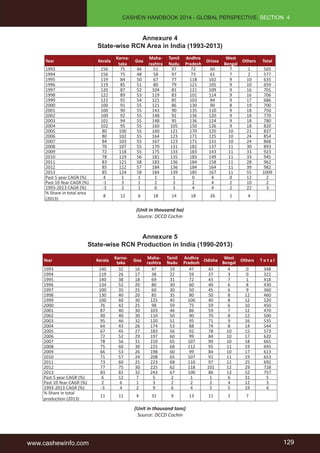
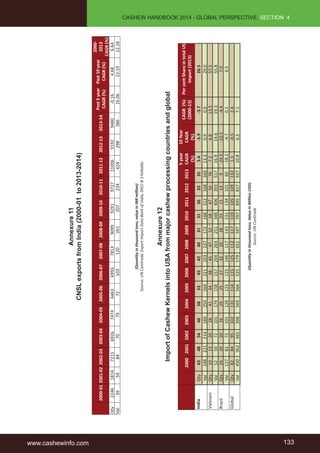
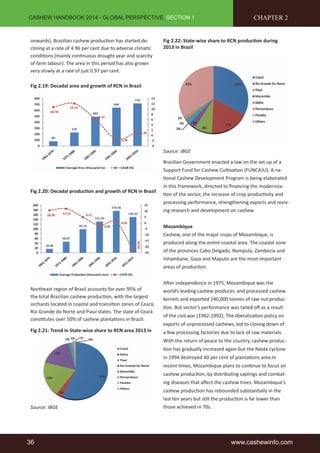
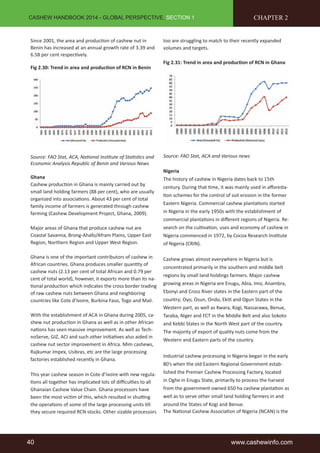
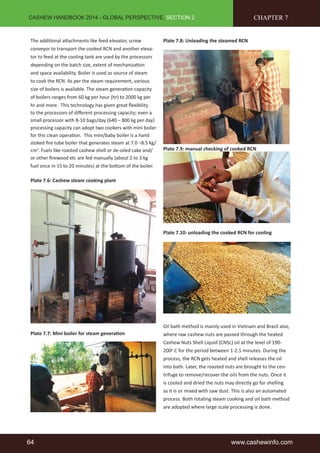
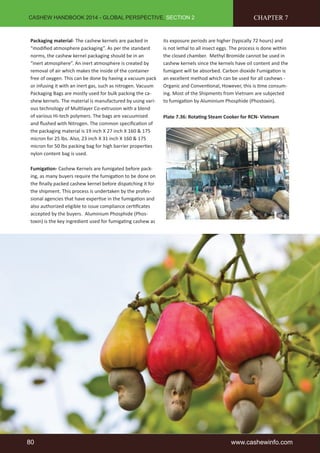
Ministry of Environment and Forest Notification
New Delhi, the 1st January, 2010
CHAPTER 7
G.S.R.1 (E)- in exercise of the power conferred by section 6 and 25 of the environment (protection) act ,1986(29 of
1986),the central government hereby makes the following rules further to amend the environment (protection) rules
, 1986, namely:-
1. These rules may be called the environment (protection) amendment rules, 2010.
They shall come into force on the date of their publication in the official Gazette.
2. In the environment (protection ) rules,1986,in schedule 1 ,after serial number 102 and entries relating
thereto, the following serial number and entries shall be inserted , namely:-
Sl. No. Industry Parameter Standard
(1) (2) (3) (4)
*103
Cashew seed
processing industry
A-Emission standards
process
Limiting concentration in
mg/Nm3
Particulate matter
Roasting 250
Cooking(roasted shell/
150
deoiled cake as fuel)
Borma oven
heater(roasted shell/
deoiled cake as fuel)
150
Minimum(meters)
Stake height Roasting 20
Cooking 15
Borma oven heater 15
Note:
• All value of particular matter shall be corrected at4% Carbon Dioxide.
• Each stake shall be at least 2 meters above the top most point of the building, shed or plant in the industry.
• The emission from ‘Dog-House’ shall be channelized along with roasting –drum emissions and shall pass
through wet scrubber.
• Bio-gas shall be installed if roasted shells are used as fuel in the unit.
Sl. No. Industry Parameter Standard
(1) (2) (3) (4)
B-effluent standard
Limiting concentration in mg/l, except for pH
Inland surface water Public sewer Land for irrigation
PH 6.5 to 8.5 6.5 to 8.5 6.5 to 8.5
Oil & greases 10 20 10
BOD(3 days,27
30 250 100
degree Celsius)
Suspended solids 100 600 200
phenols 1.0 5.0 -“
[F.NO.Q-15017/23/2008-CPW]
RAJNEESH DUBE, Jt. Secy.
82 www.cashewinfo.com](https://image.slidesharecdn.com/cashewhandbook2014-141201022838-conversion-gate02/85/Cashew-handbook-2014-78-320.jpg)