Download to read offline

![To figure out the performance level of BSS (Bid Support Staff), using
average transaction time related with BSS work. We can define rank 10
(10%) Best & Worst Employee as below.
TOP 10 - BEST Performance BOTTOM 10 - WORST Performance
- Geography
: Japan, South America
- Seller
: 10 Best BSS work for 10 Seller
(1:1 matching)
- Geography
: EMEA, South America, North America
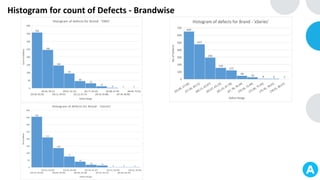
- Brand
: The most time consuming brand were
Consulting(30.64) and ESW(30.81)
- Seller
: 10 Worst BSS work for 15 Seller
(1:1.5 matching)
Investigation
Performance Level
※ Performance Level = Total time of BSS Transaction / Total Bid Size($)
Performance Evaluation for BSS
Performance Level
※ BSS related transaction = ([ZQT2]+[ZQT3]+[ZQT4]+[ZQT5]+[ZQT6]+[ZQT8])](https://image.slidesharecdn.com/scm517lss1-230225073057-687057c3/85/Case-Study-Deficit-Analysis-14-320.jpg)

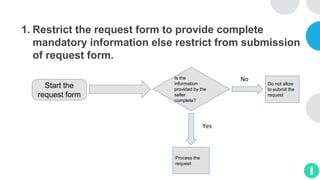
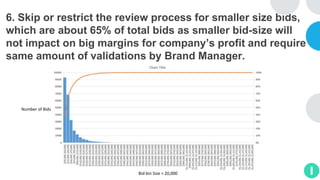
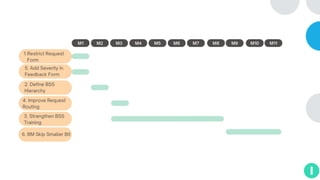
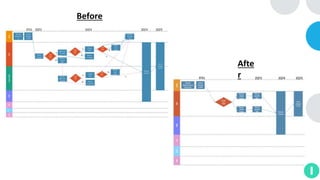
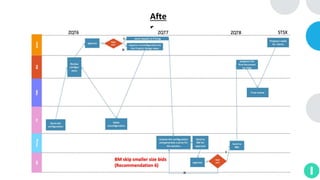


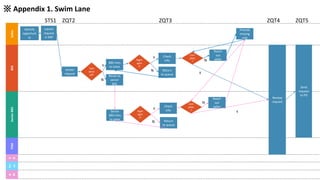
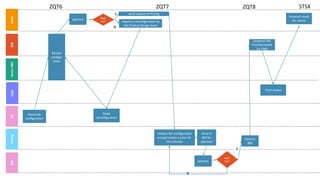
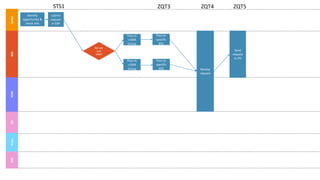
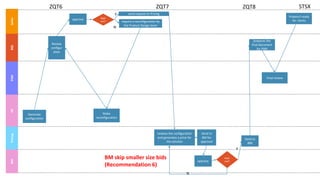

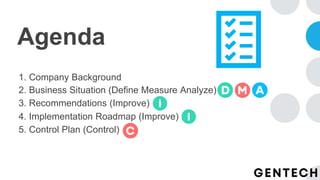
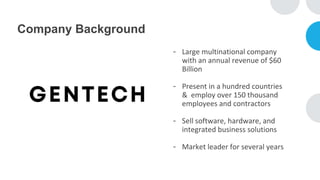
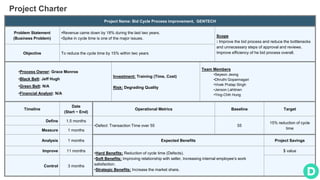
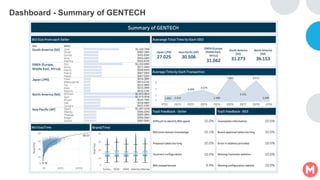
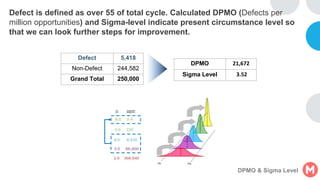
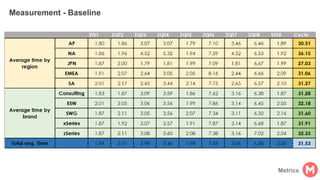
GENTECH is analyzing its bid cycle process to reduce cycle times and increase efficiency. The document outlines the company background, defines the problem of increased cycle times hurting revenue, and presents an analysis of the current process. It identifies timestamps where most time is spent, and issues like lack of domain expertise and information sharing between roles. Recommendations include restricting incomplete requests, routing by bid size and expertise, cross-training, and skipping smaller bid reviews. A roadmap and control plan are proposed to implement and ensure the effectiveness of the recommendations.


