This document is a thesis submitted by Milan Bouda in partial fulfillment of the requirements for a Doctor of Philosophy degree. The thesis is dedicated to Bayesian estimation of DSGE models. It first outlines the history and development of DSGE modeling in the Czech Republic and worldwide. It then describes the comprehensive DSGE framework and provides details on specifying and estimating DSGE models within this framework. The thesis contains two empirical studies - the first estimates a New Keynesian DSGE model for the Czech Republic using Bayesian techniques, and the second develops a Small Open Economy DSGE model for the Czech Republic with a housing sector.


![Chapter 2. DSGE framework 28
DSGE model is a set of equations characterizing the equilibrium of examined system.
This system may be specified in accordance with Real Business Cycle or New Keynesian
theory. Nothing prevents to specify DSGE model according to some other economic
theory.
2.2.1 Derivation of the first order conditions
After economic formulation of the DSGE model it is necessary to find equations char-
acterizing the equilibrium, i.e. constraints, first-order conditions, etc. To solve opti-
mization problems, one should use the techniques of dynamic programming described
by Stokey and Lucas (1989). The calculation of first-order conditions of optimality is
performed using the Lagrangian. The method of Lagrange multipliers is a strategy for
finding the local maximum and minimum of a function subject to equality constraints.
This technique is described in Uhlig (1995).
Subsequently, the non-linear system with rational expectations may be written in com-
pact notation as
Et [fθ (xt+1, xt, xt−1, εt)] = 0, (2.1)
where x is the vector collecting all the exogenous variables, ε is the vector collecting the
exogenous stochastic shocks and θ is the vector collecting the ”deep” parameters of the
model.
2.2.2 Log-linearization
Log-linearization of the necessary equations (2.1) characterizing the equilibrium of the
system makes the equations approximately linear in the log-deviations from the steady
state. The basic principle of log-linearization is to use a Taylor approximation around
the steady state to replace all equations by approximations, which are linear functions
in the log-deviations of the variables. Formally, let Xt be a vector of variables, ¯X their
steady state and xt = log Xt − log ¯X the vector of log-deviations. The vector xt · 100 is
interpreted as the difference of the variables from their steady state levels in period t in
percent. The necessary equations which characterize the equilibrium may be written as
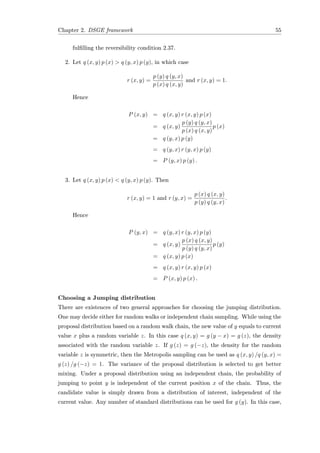
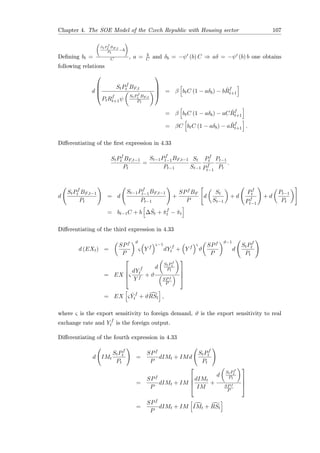
1 = f (xt, xt−1) (2.2)
1 = Et [g (xt+1, xt)] , (2.3)](https://image.slidesharecdn.com/1bf6d3f8-fa4d-44f0-acbb-72ca0d6f6621-161008083948/85/Thesis-39-320.jpg)
![Chapter 2. DSGE framework 29
where f (0, 0) = 1 and g (0, 0) = 1, i.e. the left-hand side of 2.2 and 2.3. Taking
first-order approximations around (xt, xt−1) = (0, 0) yields
0 ≈ f1 · xt + f2 · xt−1
0 ≈ Et [g1 · xt+1 + g2 · xt] .
One obtains a linear system in xt and xt−1 in the deterministic equations and xt+1 and
xt in the expectational equations. This linear system can be solved with the method of
undetermined coefficients. In the large majority of cases, there is no need to differenti-
ate the functions f and g explicitly. Instead, the log-linearized system can usually be
obtained as follows. Multiply out everything before log-linearizing. Replace a variable
Xt with Xt = ¯Xext , where xt is a real number close to zero. Let likewise yt be a real
number close to zero. Take logarithms, where both sides of an equation only involve
products, or use the following three building blocks, where a is some constant
ext+ayt
≈ 1 + xt + ayt
xtyt ≈ 0
Et [aext+1
] ≈ Et [axt+1] up to a constant.
For example, these examples yield
ext
≈ 1 + xt
aXt ≈ a ¯Xxt up to a constant
(Xt + a) Yt ≈ ¯X ¯Y xt + ¯X + a ¯Y yt up to a constant.
If the equations satisfy steady state relationships then these constants are eliminated.
2.3 Bayesian estimation
2.3.1 Literature review
There are many papers on how to take DSGE models to the data and how to work with
these models empirically. At the beginning of this macroeconometric research field clas-
sical estimation techniques prevailed. There has been a trend toward advanced econo-
metric methods for the last several years due to better computational skills. Bayesian
estimation is now the most common technique when working with DSGE models. The
classical approach (non-Bayesian) has been elaborated extensively. Surveys of these](https://image.slidesharecdn.com/1bf6d3f8-fa4d-44f0-acbb-72ca0d6f6621-161008083948/85/Thesis-40-320.jpg)


![Chapter 2. DSGE framework 37
The set of equilibrium conditions of a DSGE models take the form of a non-linear rational
expectation system of variables vector st and innovations ut and it may be written in
the form
Et [Gt (st+1, st, ut)] = 0.
The rational expectations system has to be solver before the model can be estimated
and the solution takes the form
st = At (st−1, ut, θ) , (2.6)
where st may be seen as a state vector and the equation 2.6 is a nonlinear state transition
equation. The parameter vector θ in the equation 2.6 indicates the dependence of the
solution on a parameter constellation. Currently, a lot of numerical techniques are
available to solve rational expectations systems. The algorithms to construct a second-
order accurate solution have been developed by Judd (1998), Kim, Kim, Schaumburg,
and Sims (2005), Collard and Juillard (2001) and Schmitt-Grohe and Uribe (2004). The
so called perturbation methods which includes higher order terms in the approximation,
and therefore takes both curvature and risk into account are discussed in Juillard (1996)
and Judd (1998).
In the context of system-based DSGE model estimation linear approximation methods
are very popular because they lead to state-space representation of the DSGE model
that can be analyzed with the Kalman filter (see algorithm 4). Application of linear
approximation makes feasible even the large scale DSGE models. Several solution algo-
rithms have been put forward by Blanchard and Kahn (1980), Uhlig (1995), Anderson
(2010), Klein (2000) and Sims (2002). The solution of the DSGE model may be: un-
stable, stable (determinacy), or there are multiple stable solutions (indeterminacy). In
this thesis estimation follows the assumption of determinacy. Since the linearized model
cannot be solved analytically because of singularity problem, it is decided to apply the
method by Sims (2002).
The method involves using the QZ decomposition1 (which is described later) to solve
the generalized eigenvalue problem. It produces the solution quickly and enables us to
solve the model for many different values of the underlying parameters in a reasonable
amount of time.
The transformation of DSGE model into a state space model (the 1. step of the algorithm
1) might be detailed as follows. The model’s equation are log-linearized around the non-
stochastic steady state vector s, where s is the solution of (Gt (s, s, 0) = 0). The log-
linearized equations yield a first order linear difference equation system of the following
1
often called Generalized Schur decomposition](https://image.slidesharecdn.com/1bf6d3f8-fa4d-44f0-acbb-72ca0d6f6621-161008083948/85/Thesis-48-320.jpg)

![Chapter 2. DSGE framework 39
denoted by ψi = ωii
λii
, is unique. Furthermore, we can always choose the matrices Λ,
Ω and Z in a way that the generalized eigenvalues are organized in exceeding order.
Defining rt≡Z st and pre-multiplying 2.7 by Q we obtain the transformed system of the
form
Λrt = Ωrt−1 + QΠηt + QΨut. (2.8)
Let ξ denote the maximum growth rate allowed for any component of s. ξ may be
available from the transversality condition of the economic problem. For growth rate
larger than ξ the system become explosive. In particular we can partition the system
2.8 so that |ψi| ≥ ξ for all i > k and |ψi| < ξ for all i≤k. Hence the system 2.8 may be
expanded as
Λ11 Λ12
0 Λ22
r1
t
r2
t
=
Ω11 Ω12
0 Ω22
r1
t−1
r2
t−1
+
Q1
Q2
[Πηt + Ψut] . (2.9)
Because of the way the generalized eigenvalues are grouped, the lower block of equations
2.9 is purely explosive. It has a solution that does not explode as long as we solve it
forward to make r2 a function of future u s and η s, such that the latter offset the
exogenous process in a way that put r2 on a stationary path
Z·2st = r2
t Ω22−1
Λ22r2
t+1 − Ω22−
1Q2· [Πηt+1 + Ψut+1] (2.10)
= −
∞
i=1
Ω−1
22 Λ22
i−1
Ω−1
22 Q2· [Πηt+1 + Ψut+i]
Taking expectations conditional on information available at time t leaves the left hand
side of 2.10 unchanged, i.e. Etr2
t = r2
t . The right hand side becomes then
−
∞
i=1
Ω−1
22 Λ22
i−1
Ω−1
22 Q2· [Πηt+1 + Ψut+i]
= −Et −
∞
i=1
Ω−1
22 Λ22
i−1
Ω−1
22 Q2· [Πηt+1 + Ψut+i] (2.11)
Since Etηt+1 = 0 and Etut+i = 0 for i ≥ 1, we get Z·2st = r2
t = 0 as a solution for the
explosive block. The equality in 2.10 follows on the assumption that Ω−1
22 Λ22
t
→ 0
as t → ∞. Note that if some of diagonal elements of Λ = 0, there are equations in 2.9
containing no current values of r and this corresponds to the singularity in matrix Γ0.
While these cases does not imply explosive paths, the corresponding components of 2.10
are still valid. For instance we have 0ri
t = ψiiri
t−1 + F (ηt, ut). It can be still solved for
ri
t−1 producing corresponding component of 2.10. For further details see Sims (2002). In
the absence of any additional constraints, this implies that the upper block of equation](https://image.slidesharecdn.com/1bf6d3f8-fa4d-44f0-acbb-72ca0d6f6621-161008083948/85/Thesis-50-320.jpg)
![Chapter 2. DSGE framework 40
2.9 can support any solution of the form
[Λ11] r1
t = [Ω11] r1
t−1 + [Q1.] [Πηt + Ψut] ,
which still depends on the endogenous ηt. The equality 2.11 imposes, however, certain
constraints on the left-hand side and on ηt. Knowing that Etηt+i = 0 and Etut+i = 0
we obtain
−
∞
i=1
Ω−1
22 Λ22
i−1
Ω−1
22 Q2· [Πηt+1 + Ψut+i] .
We further notice that all future shocks can be eliminated by taking expectations condi-
tional on information available at time t + 1. After doing som and shifting the equation
one period backward we obtain
Q2.Πηt = −Q2.Ψut. (2.12)
Sims (2002) concludes from 2.12 that a necessary and sufficient condition for existence
of a solution is that the space of Q2.Ψ is to be contained in that of Q2.Π. Assuming a
solution exists, we can combine 2.12 with some linear combination of equations in 2.9
to obtain a new complete system in r that is stable. What remains to be done is to
free the new equation from references to the endogenous form η. Form 2.12 we see that
Q2.Πηt depends on exogenous shock at time t. The 2.9 involves, however, other linear
combination of η, Q1.Πηt. In general it is possible that knowing Q2.Πηt is not sufficient
to tell the value of η, Q1.Πηt, in which case the solution to the model is not unique. To
assure that solution is unique it is necessary and sufficient that the row space of Q1. be
contained in that of Q2.. Which is equivalent to
Q1.Π = ΦQ2.Π
for some matrix Φ. Pre-multiplying 2.9 by matrix [I − Φ] we obtain the system free of
reference to η
Λ11 Λ12 ΦΛ22
r1
t
r2
t
= Ω11 Ω12 ΦΩ22
r1
t−1
r2
t−1
+ [0] η + [Q1.Ψ − ΦQ2.Ψ] ut.
(2.13)
Combining 2.13 with 2.10 we obtain
Λ11 Λ12 − ΦΛ22
0 I
r1
t
r2
t
=
Ω11 Ω12 − ΦΩ22
0 0
r1
t−1
r2
t−1
+Et
0
−
∞
i=1
Ω−1
22 Λ22
i−1
Ω−1
22 Q2·Ψut+i
+
Q1·Ψ − ΦQ2·Ψ
0
ut.](https://image.slidesharecdn.com/1bf6d3f8-fa4d-44f0-acbb-72ca0d6f6621-161008083948/85/Thesis-51-320.jpg)


![Chapter 3. The NKM and Alternative Monetary Policy Rules 77
makers consider only current information when making policy decisions and this view is
at odds with the forward-looking nature of central banks.
Finally, many economists demonstrated that the parameterization chosen by Taylor
reflected exactly the preference of the American monetary authority but they must
differ across countries. It may be observed that there are some limitations therefore it is
necessary to perform some modifications of the Taylor rule. Subsequently, the NKM is
estimated with modified Taylor rule. The NKM with modified Taylor rule is formulated
in the same way as the benchmark model. Finally, models are compared using technique
called Bayesian comparison. The first modification is for the sake of simplification. Here,
I suppose that central bank takes into account only the level of inflation and the output
gap is not relevant for central bank’s decision making process. The simple monetary
policy rule can be written as follows
it = ρ + φππt + υt. (3.9)
This simple rule is an alternative to the Taylor rule used in benchmark model.
The second modification is based on Taylor (1993) and discussed by Svensson (2000).
According to Srour (2001), there are many reasons for interest rate smoothing. First, the
behaving of the central bank is important for investors and smoothing of interest rates
can reduce volatility of a term premium and therefore volatility of long-term interest
rates and other financial market instruments. Second, the central bank has usually
limited information about the shocks hitting the economy. Third, many shocks are
serially correlated. The Svensson specification takes the following form
it = (1 − φi) [¯i + φππt + φy ˜yt] + φiit−1 + υt. (3.10)
where φi is the interest rate smoothing parameter and ¯i is the steady state value of
short-term interest rate.
The third modification is not taken from previous papers. This modification is proposed
by the author and its goal is simple. It is desirable to incorporate forward looking
information into the interest rate rule. It may be observed that basic versions of the NKM
do not take into account forward looking information. Two important modifications
of the Taylor rule have received wide acceptance. First, Clarida, Gali, and Gertler
(1997) departed from the original backward looking Taylor rule to a forward looking
specification, which arguably better represents the objectives of central banks. In order
to control inflation, the policy instrument would respond to the deviation of the inflation
forecast from its assumed target. Second, Orphanides (2000) stressed the importance of
policy rules being operational by showing that there are significant differences between](https://image.slidesharecdn.com/1bf6d3f8-fa4d-44f0-acbb-72ca0d6f6621-161008083948/85/Thesis-88-320.jpg)
![Chapter 3. The NKM and Alternative Monetary Policy Rules 78
Parameter Prior Posterior Lower Upper Distribution
α 0.50 0.50 0.41 0.57 beta
φ 0.80 0.80 0.73 0.89 beta
φπ 1.50 1.49 1.40 1.57 norm
Table 3.3: Estimation results with the simple Taylor rule
monetary policy evaluated over revised data and over the real time data (i.e. data
available to policymakers at the time they are making decisions). Undoubtedly, this
is an important topic. This is supported by fact that National Bureau of Economic
Research dedicated one chapter in volume about monetary policy rules to the forward
looking rules for monetary policy. For details see Batini and Haldane (1999). The main
goal of the third modification is to specify the forward looking Taylor rule which is not
specified in previous papers. This modifications is based on 3.10 which was specified by
Svensson. The expected level of inflation and output gap plays a crucial role as well.
The interest rule contains expectations of the central bank and is specified as follows
it = (1 − φi) {¯i + E [φππt+1] + E [φy ˜yt+1]} + φiit−1 + υt, (3.11)
where E is the operator for rational expectations.
3.7 Results of modified models
This chapter describes results of all modified NKM. The shock decomposition is not
commented because this type of chart is the same for all modified NKM. For brevity,
only the results of posterior distribution are presented. Model evaluation is performed
using marginal likelihood which is discussed in 2.3.7.1.
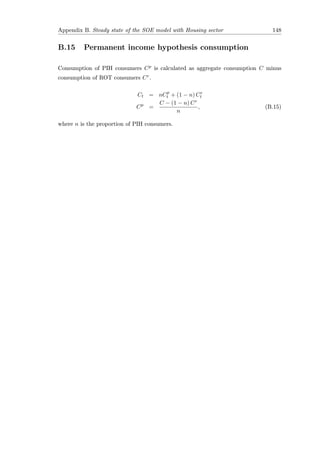
The marginal likelihood p (YT |M) is calculated as follows
p (YT |M) = p (YT |θ, M) p (θ|M)dθ, (3.12)
where YT are the observations until period T, M stands for specific model and θ rep-
resents the parameters of model M. Marginal likelihood p (YT |M) measures how well
model M predicts the observed data YT .
Posterior results for simple Taylor rule 3.9 are shown in the Table 3.3. Marginal like-
lihood is -209.4762 which is in absolute value lower benchmark model (-210.1844). It
means that NKM with simple Taylor rule does not fit data as good as benchmark model.](https://image.slidesharecdn.com/1bf6d3f8-fa4d-44f0-acbb-72ca0d6f6621-161008083948/85/Thesis-89-320.jpg)


![Chapter 4. The SOE Model of the Czech Republic with Housing sector 91
several times from standard DSGE framework. These diversions are described in section
4.6 (Bayesian estimation). For sake of clarity Dynare code which contains log-linearized
equations is in Appendix D. This code enables replication of this study.
4.2.1 Firms
Goods are produced by firms. The goods are differentiated so that there is monopolistic
competition and each producer has a certain degree of market power in the short run.
The market power consist in the ability to set their prices. Firms are assumed to be
domestically owned. This assumption is arguably strong because in the Czech Republic
we have high degree of foreign ownership. Thus, I neglect the need to consider equity
investment flows. Next, no firm dividend is explicitly modeled to keep the model as
simple and clear as possible. Logically, ownership of firms would be on the shoulders of
PIH households as ROT households are unable to build up savings in order to purchase
an equity stake. However, if PIH households do not view changes to firm dividends
as permanent income changes, then they will not alter their consumption behavior in
response. The combination of labor and imported intermediate goods is used together
with an exogenously given level of technology as inputs by firms. The CES production
function us used for a production of consumption goods. The output of firm z is given
by
yt (z) = [αIMt(z)γ
+ (1 − α) (AtLt (z))γ
]
1
γ , (4.1)
where IMt(z) is the quantity of intermediate imports used by firm z, Lt (z) is labor
demand, At is the level of technology, α is the weight given to imports and 1 − α is
the weight on labor and 1
1−γ is the elasticity of substitution between labor and imports.
Log-linearizing and aggregating across all firms
log Yt = log [αIMγ
t + (1 − α) (AtLt)γ
]
1
γ
ˆYt =
1
Yt
1
γ
Y 1−γ
t αIMγ
t IMt + (1 − α) (AtLt)γ ˆAt − ˆLt
which around the steady state reduces to
ˆYt = ϕIMt + (1 − ϕ) ˆAt − ˆLt , (4.2)
where
ϕ =
αIMγ
αIMγ + (1 − α) (AL)γ .](https://image.slidesharecdn.com/1bf6d3f8-fa4d-44f0-acbb-72ca0d6f6621-161008083948/85/Thesis-102-320.jpg)
![Chapter 4. The SOE Model of the Czech Republic with Housing sector 92
4.2.2 Input demand determination
The cost minimization problem for the firms is defined as follows
L = WtLt + StPf
t IMt + λt yt − [αIMγ
t + (1 − α) (AtLt)γ
]
1
γ , (4.3)
where Wt is the nominal wage rate, St is the nominal exchange rate (measured in do-
mestic currency units per foreign currency unit) and Pf
t is the price level of foreign
goods.
Differentiating 4.3 with respect to Lt
dL
dLt
= Wt − λt
1
γ
[αIMγ
t + (1 − α) (AtLt)γ
]
1
γ
−1
(1 − α) γ(AtLt)γ−1
At
= Wt − λty1−γ
t (1 − α) (AtLt)γ−1
At
= Wt − λty1−γ
t (1 − α) At
yt
(AtLt)
1−γ
λt =
W
(1 − α) Aγ
t
yt
Lt
1−γ . (4.4)
4.4 is interpreted as the marginal cost condition aggregating across firms with respect
to labor. Differentiating 4.3 with respect to IMt
dL
dIMt
= StPf
t − λt
1
γ
[αIMγ
t + (1 − α) (AtLt)γ
]
1
γ
−1
αγIMγ−1
= StPf
t − λtα
yt
IMt
1−γ
λt =
StPf
t
α yt
IMt
1−γ . (4.5)
Hence equating marginal costs across labor and intermediate imports yields
Wt
(1 − α) Aγ
t
yt
Lt
1−γ =
StPf
t
α yt
IMt
1−γ
wt
RSt
=
(1 − α) Aγ
t
yt
Lt
1−γ
α yt
IMt
1−γ ,
where wt = Wt
Pt
is the real wage rate and RSt is the real exchange rate. The yt can be
canceled and then this is expressed as follows
IMt
Lt
1−γ
Aγ
t =
α
(1 − α)
wt
RSt
.](https://image.slidesharecdn.com/1bf6d3f8-fa4d-44f0-acbb-72ca0d6f6621-161008083948/85/Thesis-103-320.jpg)

![Chapter 4. The SOE Model of the Czech Republic with Housing sector 94
and
mct = ˆwt − γ ˆAt − (1 − γ) ϕ IMt − ˆLt + (1 − ϕ) ˆAt
= ˆwt − (1 − γ) ϕ IMt − ˆLt [(1 − γ) (1 − ϕ) + γ] ˆAt. (4.8)
4.2.4 Resource constraint
Output of firms is consumed by domestic consumers, government and foreign consumers
or utilized in the production of housing
Yt = ct + It + Gt + EXt
dYt
Yt
=
ct
Yt
dct
ct
+
It
Yt
dIt
It
+
Gt
Yt
dGt
Gt
+
EXt
Yt
dEXt
EXt
ˆYt =
ct
Yt
ˆct +
It
Yt
ˆIt +
Gt
Yt
ˆGt +
EXt
Yt
EXt.
Because of steady state one can drop the time subscripts for the levels variables
ˆYt =
c
Y
ˆct +
I
Y
ˆIt +
G
Y
ˆGt +
EX
Y
EXt, (4.9)
where ct represents domestic consumption of consumption goods, It is investment in
housing, Gt represents government spending and EXt is consumption goods exported
to foreign consumers.
4.2.5 Export demand
Foreign demand for firm z’s output is given as follows
EXt (z) =
S−1
t Pt (z)
S−1
t Pc,t
−
EXt
=
Pt (z)
Pc,t
−
EXt.
Following McCallum and Nelson (1999), I assume that aggregate export demand is given
by
EXt =
StPf
t
Pt
υ
Y f
t
ς
EXt = ϑRSt + ς ˆY f
t , (4.10)
where RSt =
StPf
t
Pt
is the real exchange rate, Y f
t is foreign output, and ϑ > 0 and ζ > 0.](https://image.slidesharecdn.com/1bf6d3f8-fa4d-44f0-acbb-72ca0d6f6621-161008083948/85/Thesis-105-320.jpg)


![Chapter 4. The SOE Model of the Czech Republic with Housing sector 108
Hence
βC bt (1 + aδ) − a ˆRf
t+1 = bt−1C + b ∆ ˆSt + ˆπf
t − ˆπt
−EX ς ˆY f
t + υRSt +
SPf
P
IM IMt + RSt (4.34)
4.2.16 New Keynesian Phillips curve
Prices are sticky according to Calvo (1983). Firms reset their prices each period with
a probability 1 − θ. Hence firm z that is able to reset its price in period t will seek to
optimize
L = Et
∞
k=0
(θβ)k
λk [p∗
t (z) yt+k (z) − TCt+k (yt+k (z))]
= Et
∞
k=0
(θβ)k
λk p∗
t (z)
p∗
t (z)
Pc,t+k
−
Yt+k − TCt+k
p∗
t (z)
Pc,t+k
−
Yt+k
= Et
∞
k=0
(θβ)k
λk p∗
t (z)1− 1
Pc,t+k
−
Yt+k − TCt+k
p∗
t (z)
Pc,t+k
−
Yt+k ,
where θ is the probability that firms do not reset their prices, β is the discount rate,p∗
t (z)
is the optimal price of firm z at time t, yt+k (z) is the output of firms z at time t + k,
TCt+k represents total costs at time t + k, is the price elasticity of demand faced by
each firm, Pc,t+k is the aggregate price for all consumer goods at time t + k and Yt+k is
the aggregate goods output of all firms.
Differentiating with respect to p∗
t (z) yields
∂L
∂p∗
t (z)
= Et
∞
k=0
(θβ)k
λk (1 − ) p∗
t (z)1− 1
Pc,t+k
−
Yt+k
− MCt+k (.) (− ) p∗
t (z)− −1 1
Pc,t+k
−
Yt+k
= Et
∞
k=0
(θβ)k
λk (1 − )
p∗
t (z)
Pc,t+k
−
Yt+k − MCt+k (.)
p∗
t (z)
p∗
t (z)
Pc,t+k
−
Yt+k ,
where MCt+k represents marginal costs at time t + k.
Setting to zero
0 = Et
∞
k=0
(θβ)k 1 −
p∗
t (z)
λkyt+k (z) p∗
t (z) −
− 1
MCt+k (.)
p∗
t (z) Et
∞
k=0
(θβ)k
λkyt+k (z) =
− 1
Et
∞
k=0
(θβ)k
λkyt+k (z)MCt+k (z).](https://image.slidesharecdn.com/1bf6d3f8-fa4d-44f0-acbb-72ca0d6f6621-161008083948/85/Thesis-119-320.jpg)


![Chapter 4. The SOE Model of the Czech Republic with Housing sector 115
Labor market equilibrium (4.8) is characterized as
mct = ˆwt − (1 − γ) ϕ IMt − ˆLt [(1 − γ) (1 − ϕ) + γ] ˆAt,
where mct is the real marginal cost.
Resource constraint (4.9) is represented by
ˆYt =
c
Y
ˆct +
I
Y
ˆIt +
G
Y
ˆGt +
EX
Y
EXt,
where ct is the goods consumption, It is the housing investment, Gt is the government
spending and EXt is the net export.
Export demand (4.10) is defined as
EXt = ϑRSt + ς ˆY f
t ,
where ϑ is the export sensitivity to real exchange rate and Y f
t is the foreign output.
Following expression (4.12) is an identity.
ˆXc,t = −
1 − υ
υ
Xh
Xc
1−η
ˆXh,t,
where Xc,t is the relative price of the representative consumption good, υ is the steady
state goods consumption as a proportion of overall consumption and Xh,t is the relative
price of rental services.
Demand for consumption goods (4.13) and housing services (4.14) are defined as
ˆct = ˆCt − η ˆXc,t,
ˆht = ˆCt − η ˆXh,t,
where Ct is the aggregate consumption, η is the consumer substitution between housing
and goods coefficient and ht is the housing stock.
Consumption of PIH consumers (4.18) follows
ˆCP
t = Et
ˆCP
t+1 − ˆRt+1,
where CP
t is the PIH consumption, Et. is the rational expectation operator and Rt is
the real domestic interest rate.](https://image.slidesharecdn.com/1bf6d3f8-fa4d-44f0-acbb-72ca0d6f6621-161008083948/85/Thesis-126-320.jpg)


![Appendix A
Derivation of the New Keynesian
model
A.1 Households
Assume a representative infinitely-lived household, seeking to maximize
E0
∞
t=0
βt
U (Ct, Nt),
where βt is discount factor, Nt denotes hours of work and Ct is a consumption index
given by
Ct ≡
1
0
Ct(i)1−1
ε di
ε
ε−1
,
where Ct (i) representing the quantity of good i consumed by the household in period
t. Assume the existence of a continuum of goods represented by the interval [0, 1].
Parameter ε denotes the elasticity of substitution. The period budget constraint now
takes the form
1
0
Pt (i) Ct (i) di + QtBt ≤ Bt−1 + WtNt + Tt
for t = 0, 1, 2 . . ., where Pt (i) is the price of good i, Wt is the nominal wage, Bt represents
purchases of one period bonds at a price Qt, and Tt is the lump sum component of income
which may include for example dividends from ownership of firms. The households
must decide how to allocate its consumption expenditures among the different goods.
This requires that the consumption index Ct being maximized for any given level of
expenditures
1
0 Pt (i) Ct (i) di. The solution of that problem provides Galí (2008) and
136](https://image.slidesharecdn.com/1bf6d3f8-fa4d-44f0-acbb-72ca0d6f6621-161008083948/85/Thesis-147-320.jpg)
![Appendix A. Derivation of the NKM 137
yields the set of demand equations
Ct (i) =
Pt (i)
Pt
−ε
Ct (A.1)
for all i ∈ [0, 1], where Pt ≡
1
0 Pt(i)1−ε
di
1
1−ε
is an aggregate price index. Furthermore,
and conditional on such optimal behavior
1
0
Pt (i) Ct (i)di = PtCt
i.e., total consumption expenditures can be written as a product of the price index times
the quantity index. Plugging the previous expression into the budget constraint yields
PtCt + QtBt ≤ Bt−1 + WtNt + Tt.
The optimal consumption/savings and labor supply decisions are described by the fol-
lowing conditions
−
Un,t
Uc,t
=
Wt
Pt
,
Qt = βEt
Uc,t+1
Uc,t
Pt
Pt+1
.
Under the assumption of a period utility given by
U (Ct, Nt) =
C1−σ
t
1 − σ
−
N1+φ
t
1 + φ
and the resulting log-linear versions of the above optimality conditions take the form
wt − pt = σct + φnt, (A.2)
ct = Et {ct+1} −
1
σ
(it − Et {πt+1} − ρ) ,
where it ≡ − log Qt is the short term nominal rate and ρ ≡ − log β is the discount rate,
and where lowercase letters are used to denote the logs of the original variables. The
previous conditions are supplemented with an ad-hoc log-linear money demand equation
of the form
mt − pt = yt − ηit.](https://image.slidesharecdn.com/1bf6d3f8-fa4d-44f0-acbb-72ca0d6f6621-161008083948/85/Thesis-148-320.jpg)
![Appendix A. Derivation of the NKM 138
A.2 Firms
Assume a continuum of firms indexed by i ∈ [0, 1]. Each firm produces a differentiated
good, but they all use an identical technology, represented by the production function
Yt (i) = AtNt(i)1−α
, (A.3)
where At represents the level of technology, assumed to be common to all firms and
to evolve exogenously over time. All firms face an identical isoelastic demand schedule
given by A.1, and take the aggregate price level Pt and aggregate consumption index
Ct as given. Following the formalism proposed in Calvo (1983), each firm may reset its
price only with probability 1 − θ in any given period, independent of the time elapsed
since the last adjustment. Thus, each period a measure 1 − θ of producers reset their
prices, while a fraction θ keep their prices unchanged. As a result, the average duration
of a price is given by (1 − θ)−1
. In the context, θ becomes a natural index of price
stickiness. The aggregate price dynamics is described by the equation
Π1−ε
t = θ + (1 − θ)
P∗
t
Pt−1
1−ε
,
where Πt ≡ Pt
Pt−1
is the gross inflation rate between t − 1 and t, and P∗
t is the price set
in period t by firms re-optimizing their price in that period. Furthermore, a log-linear
approximation to the aggregate price index around that steady state yields
πt = (1 − θ) (p∗
t − pt−1) . (A.4)
A firm re-optimizing in period t will choose the price P∗
t that maximizes the current
market value of the profits generated while that price remains effective. Formally, it
solves the problem
max
P∗
t
∞
k=0
θk
Et Qt,t+k P∗
t Yt+k|t − ψt+k Yt+k|t
subject to the sequence of demand constraints
Yt+k|t =
P∗
t
Pt+k
−ε
Ct+k
for k = 0, 1, 2, . . ., where Qt,t+k ≡ βk(Ct+k/Ct )−σ
(Pt/Pt+k ) is the stochastic discount
factor for nominal payoffs, ψ (·) is the cost function, and Yt+k|t denotes output in period
t + k for a firm that last reset its price in period t. The first order condition takes the](https://image.slidesharecdn.com/1bf6d3f8-fa4d-44f0-acbb-72ca0d6f6621-161008083948/85/Thesis-149-320.jpg)

![Appendix A. Derivation of the NKM 140
A.3 Equilibrium
Yt (i) = Ct (i)
for all i ∈ [0, 1] and all t. Letting aggregate output to be defined as Yt ≡
1
0 Yt(i)1−1
ε di
ε
ε−1
it follows that
Yt = Ct
must hold for all t. One can combine the above goods market clearing condition with
the consumer’s Euler equation to yield the equilibrium condition
yt = Et {yt+1} −
1
σ
(it − Et {πt+1} − ρ) . (A.8)
Market clearing in the labor market requires
Nt =
1
0
Nt (i) di.
Using A.3 one obtain
Nt =
1
0
Yt (i)
At
1
1−α
di =
Yt
At
1
1−α 1
0
Pt (i)
Pt
− ε
1−ε
di,
where the second equality follows from A.1 and the goods market clearing condition.
Taking logs,
(1 − α) nt = yt − at + dt,
where dt ≡ (1 − α) log
1
0 (Pt (i)/Pt)− ε
1−ε and di is a measure of price dispersion across
firms. Thus we can write the following approximate relation between aggregate output,
employment, and technology as
yt = at + (1 − α) nt. (A.9)
Next an expression is derived for an individual firm’s marginal cost in terms of the
economy’s average real marginal cost. The latter is defined by
mct = (wt − pt) − mpnt
= (wt − pt) − (at − αnt) − log (1 − α)
= (wt − pt) −
1
1 − α
(at − αyt) − log (1 − α)](https://image.slidesharecdn.com/1bf6d3f8-fa4d-44f0-acbb-72ca0d6f6621-161008083948/85/Thesis-151-320.jpg)


![Appendix B. Steady state of the SOE model with Housing sector 144
B.1 Ex-ante return on housing
The long term return from housing asset may be expressed as follows
EtRh,t+1 = f
Nt+1
qtht+1
Rt+1
Rh = f
N
qh
R, (B.1)
where Rh is the return on housing, N is the net worth, q is the real house price, h is the
housing stock and R is the real domestic interest rate.
B.2 Relative price of rental
Relative price of renting may be derived from model equation as follows
EtRh,t+1 = Et
Xh,t+1 + (1 − δ) qt+1
qt
Rh =
Xh
q
+ (1 − δ)
Xh = [Rh − (1 − δ)] q, (B.2)
where Xh is the relative price of renting which is in long-term period derived using the
Rh the return on housing, δ the housing depreciation rate and q the real house price.
B.3 Relative price of consumption goods
The relative price of consumption goods Xc is derived as follows
Pt = υP1−η
c,t + (1 − υ) P1−η
h,t
1
1−η
1 = υX1−η
c,t + (1 − υ) X1−η
h,t
1
1−η
1 = υX1−η
c + (1 − υ) X1−η
h
1
1−η
, (B.3)
where Xh is the relative price of rental services and υ represents the share of expenditure
on consumer goods.](https://image.slidesharecdn.com/1bf6d3f8-fa4d-44f0-acbb-72ca0d6f6621-161008083948/85/Thesis-155-320.jpg)

![Appendix B. Steady state of the SOE model with Housing sector 146
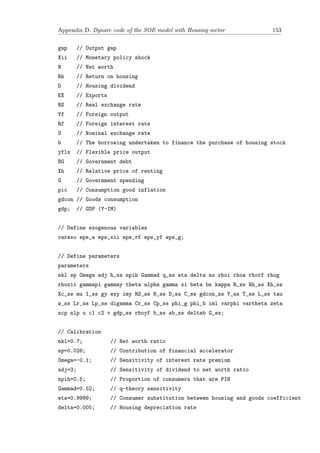
B.7 Investement
Investments into the housing stock I are determined by the housing depreciation rate δ
and h housing stock.
ht+1 = ht + It − δht
I = δh. (B.7)
B.8 Resource constraint
Resource constraint says that output of firms Y is consumed by domestic consumers c,
government G, foreign consumers EX or utilized in the production of housing.
Yt = ct + It + Gt + EXt
Y = c + I +
G
Y
Y +
EX
Y
Y
Y 1 −
G
Y
−
EX
Y
= c + I
Y =
c + I
1 − G
Y − EX
Y
. (B.8)
B.9 Aggregate labor
Aggregate labor is expressed using the Y output, γ labor-imports substitution coefficient,
IM imports and α import weight in the production function.
Yt (z) = [αIMt (z) + (1 − α) (AtLt (z))γ
]
1
γ
L =
Y γ − IMγ
1 − α
. (B.9)
B.10 Goods producers first order conditions
This relationship is equivalent to the log-linearized model equation.
IMt
Lt
1−γ
=
α
1 − α
wt
RSt
IM
L
1−γ
=
α
1 − α
w
RS
. (B.10)](https://image.slidesharecdn.com/1bf6d3f8-fa4d-44f0-acbb-72ca0d6f6621-161008083948/85/Thesis-157-320.jpg)


![Bibliography 169
Smets, F., and R. Wouters (2007): “Shocks and frictions in US business cycles: a
Bayesian DSGE approach,” Working Paper Series 722, European Central Bank.
Spence, A. M. (1974): Market Signaling - Informational Transfer in Hiring and Related
Screening Processes. Harvard University Press, Cambridge, MA.
Srour, G. (2001): “Why Do Central Banks Smooth Interest Rates?,” Working Papers
01-17, Bank of Canada.
Stiglitz, J., and A. Weiss (1983): “Alternative Approaches to Analyzing Markets
with Asymmetric Information: Reply [The Theory of ’Screening,’ Education, and the
Distribution of Income],” American Economic Review, 73(1), 246–49.
Stokey, N. L., and R. E. Lucas (1989): Recursive Methods in Economic Dynamics.
Harvard University Press.
Štork, Z. (2012): “Term Structure of Interest Rates: Macro-Finance Approach,” Ph.D.
thesis, University of Economics, Prague.
Štork, Z., and J. Závacká (2010): “Macroeconomic Implications of Fiscal Policy
Measures in DSGE,” Ministry of Finance of the Czech Republic: Working Papers, 1,
34.
Štork, Z., J. Závacká, and M. Vávra (2009): “HUBERT: A DSGE Model of the
Czech Republic,” Ministry of Finance of the Czech Republic: Working Papers, 1, 36.
Svensson, L. E. O. (2000): “Open-Economy Inflation Targeting,” NBER Working
Papers 6545, National Bureau of Economic Research, Inc.
Taylor, J. B. (1980): “Aggregate Dynamics and Staggered Contracts,” Journal of
Political Economy, 88(1), 1–23.
Taylor, J. B. (1993): “Discretion versus policy rules in practice,” Carnegie-Rochester
Conference Series on Public Policy, 39(1), 195–214.
Thoenissen, C. (2004): “Real exchange rates, current accounts and the net foreign as-
set position,” Money Macro and Finance (MMF) Research Group Conference 2004 71,
Money Macro and Finance Research Group.
Tobin, J. (1969): “A General Equilibrium Approach to Monetary Theory,” Journal of
Money, Credit and Banking, 1(1), 15–29.
Tonner, J. (2011): “Expectations and monetary policy in open economy,” Ph.D. thesis,
Masaryk University.](https://image.slidesharecdn.com/1bf6d3f8-fa4d-44f0-acbb-72ca0d6f6621-161008083948/85/Thesis-180-320.jpg)


