The document provides an overview of the cardiovascular system including the heart, circulation, cardiac muscle contraction, conduction system, cardiac cycle, electrocardiogram (ECG), and ECG leads and placement. Key points include:
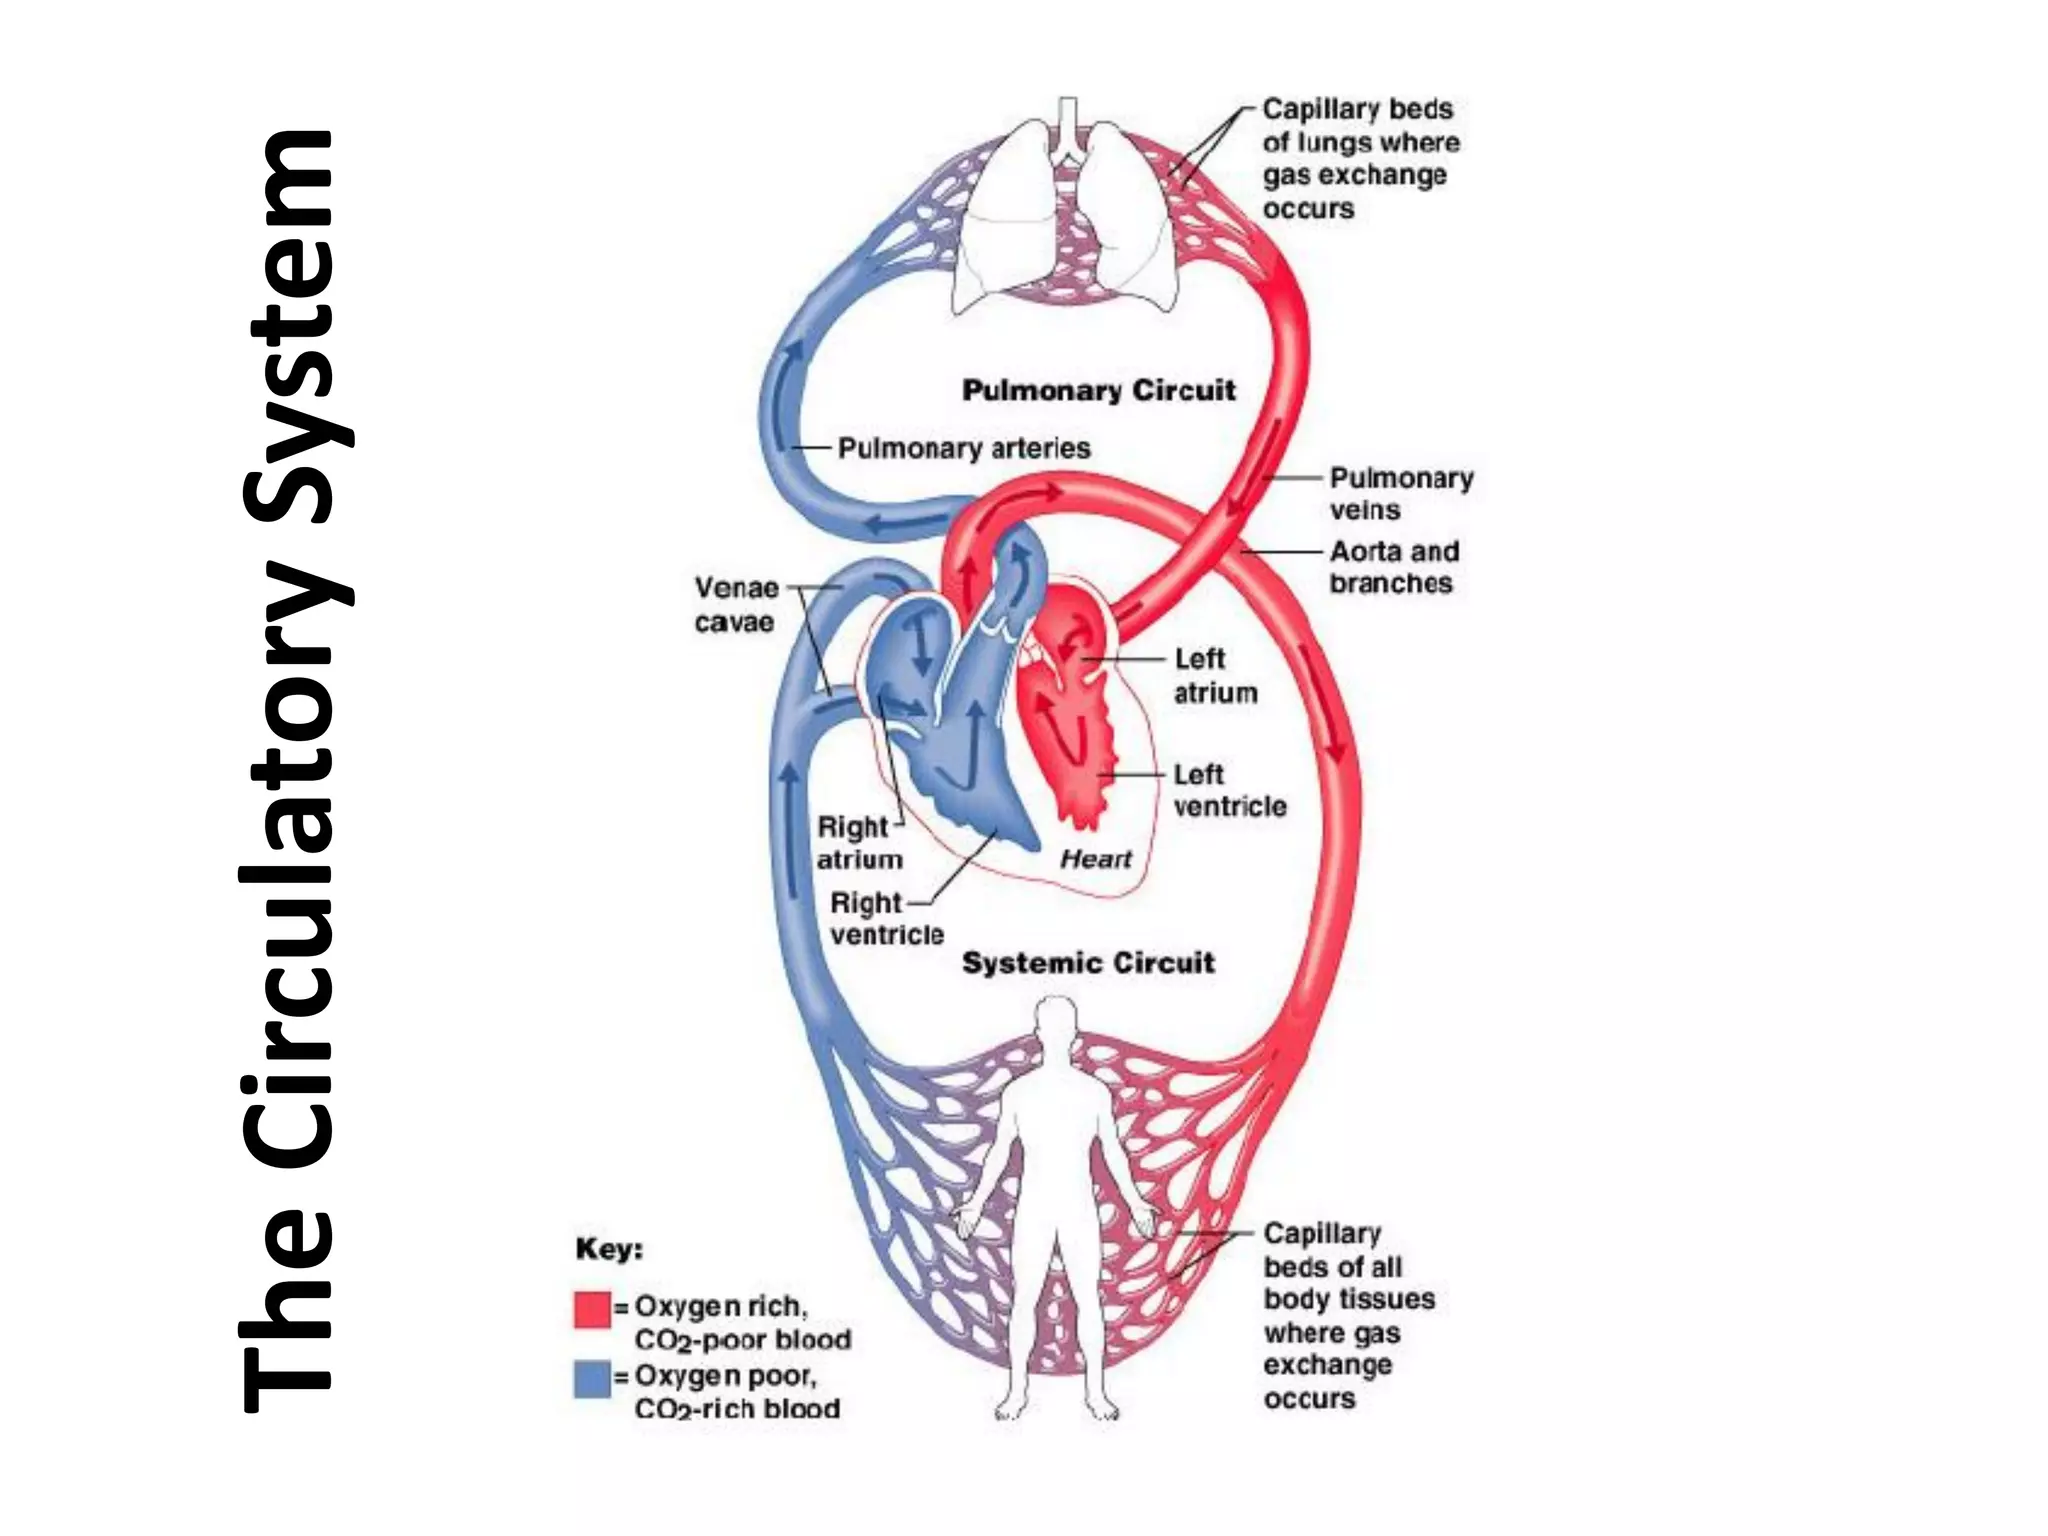
- The cardiovascular system includes the heart and blood vessels which work together to circulate blood throughout the body to supply nutrients and oxygen and remove waste.
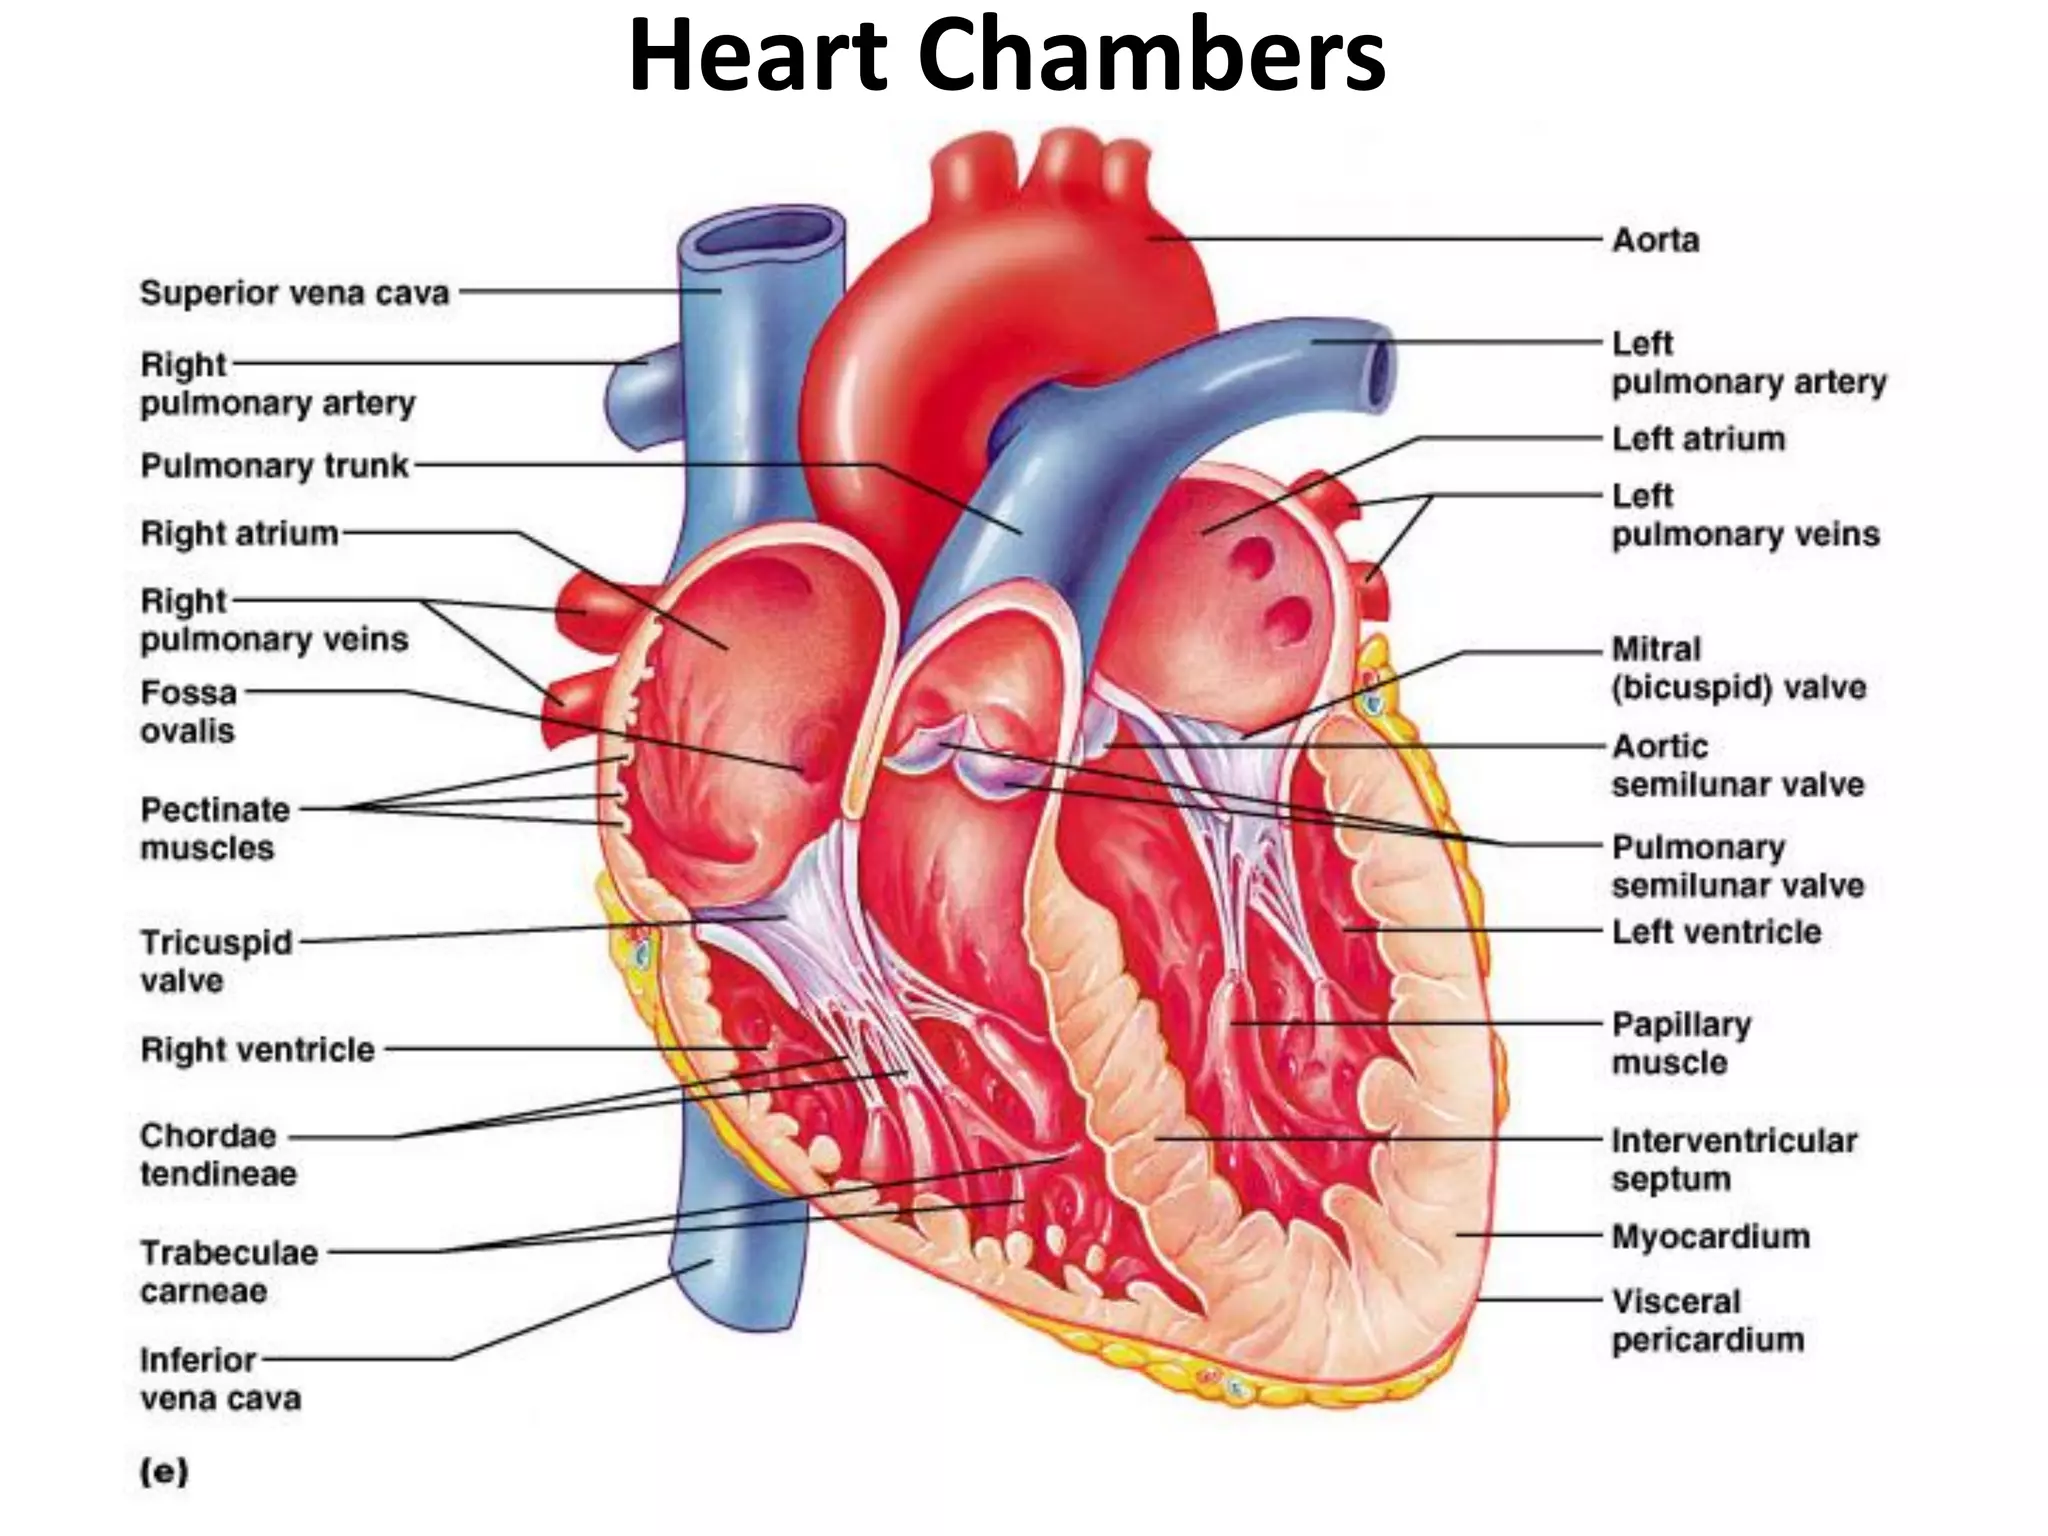
- The heart has four chambers (two atria and two ventricles) and is made of cardiac muscle. It pumps blood through two circuits: systemic and pulmonary circulation.
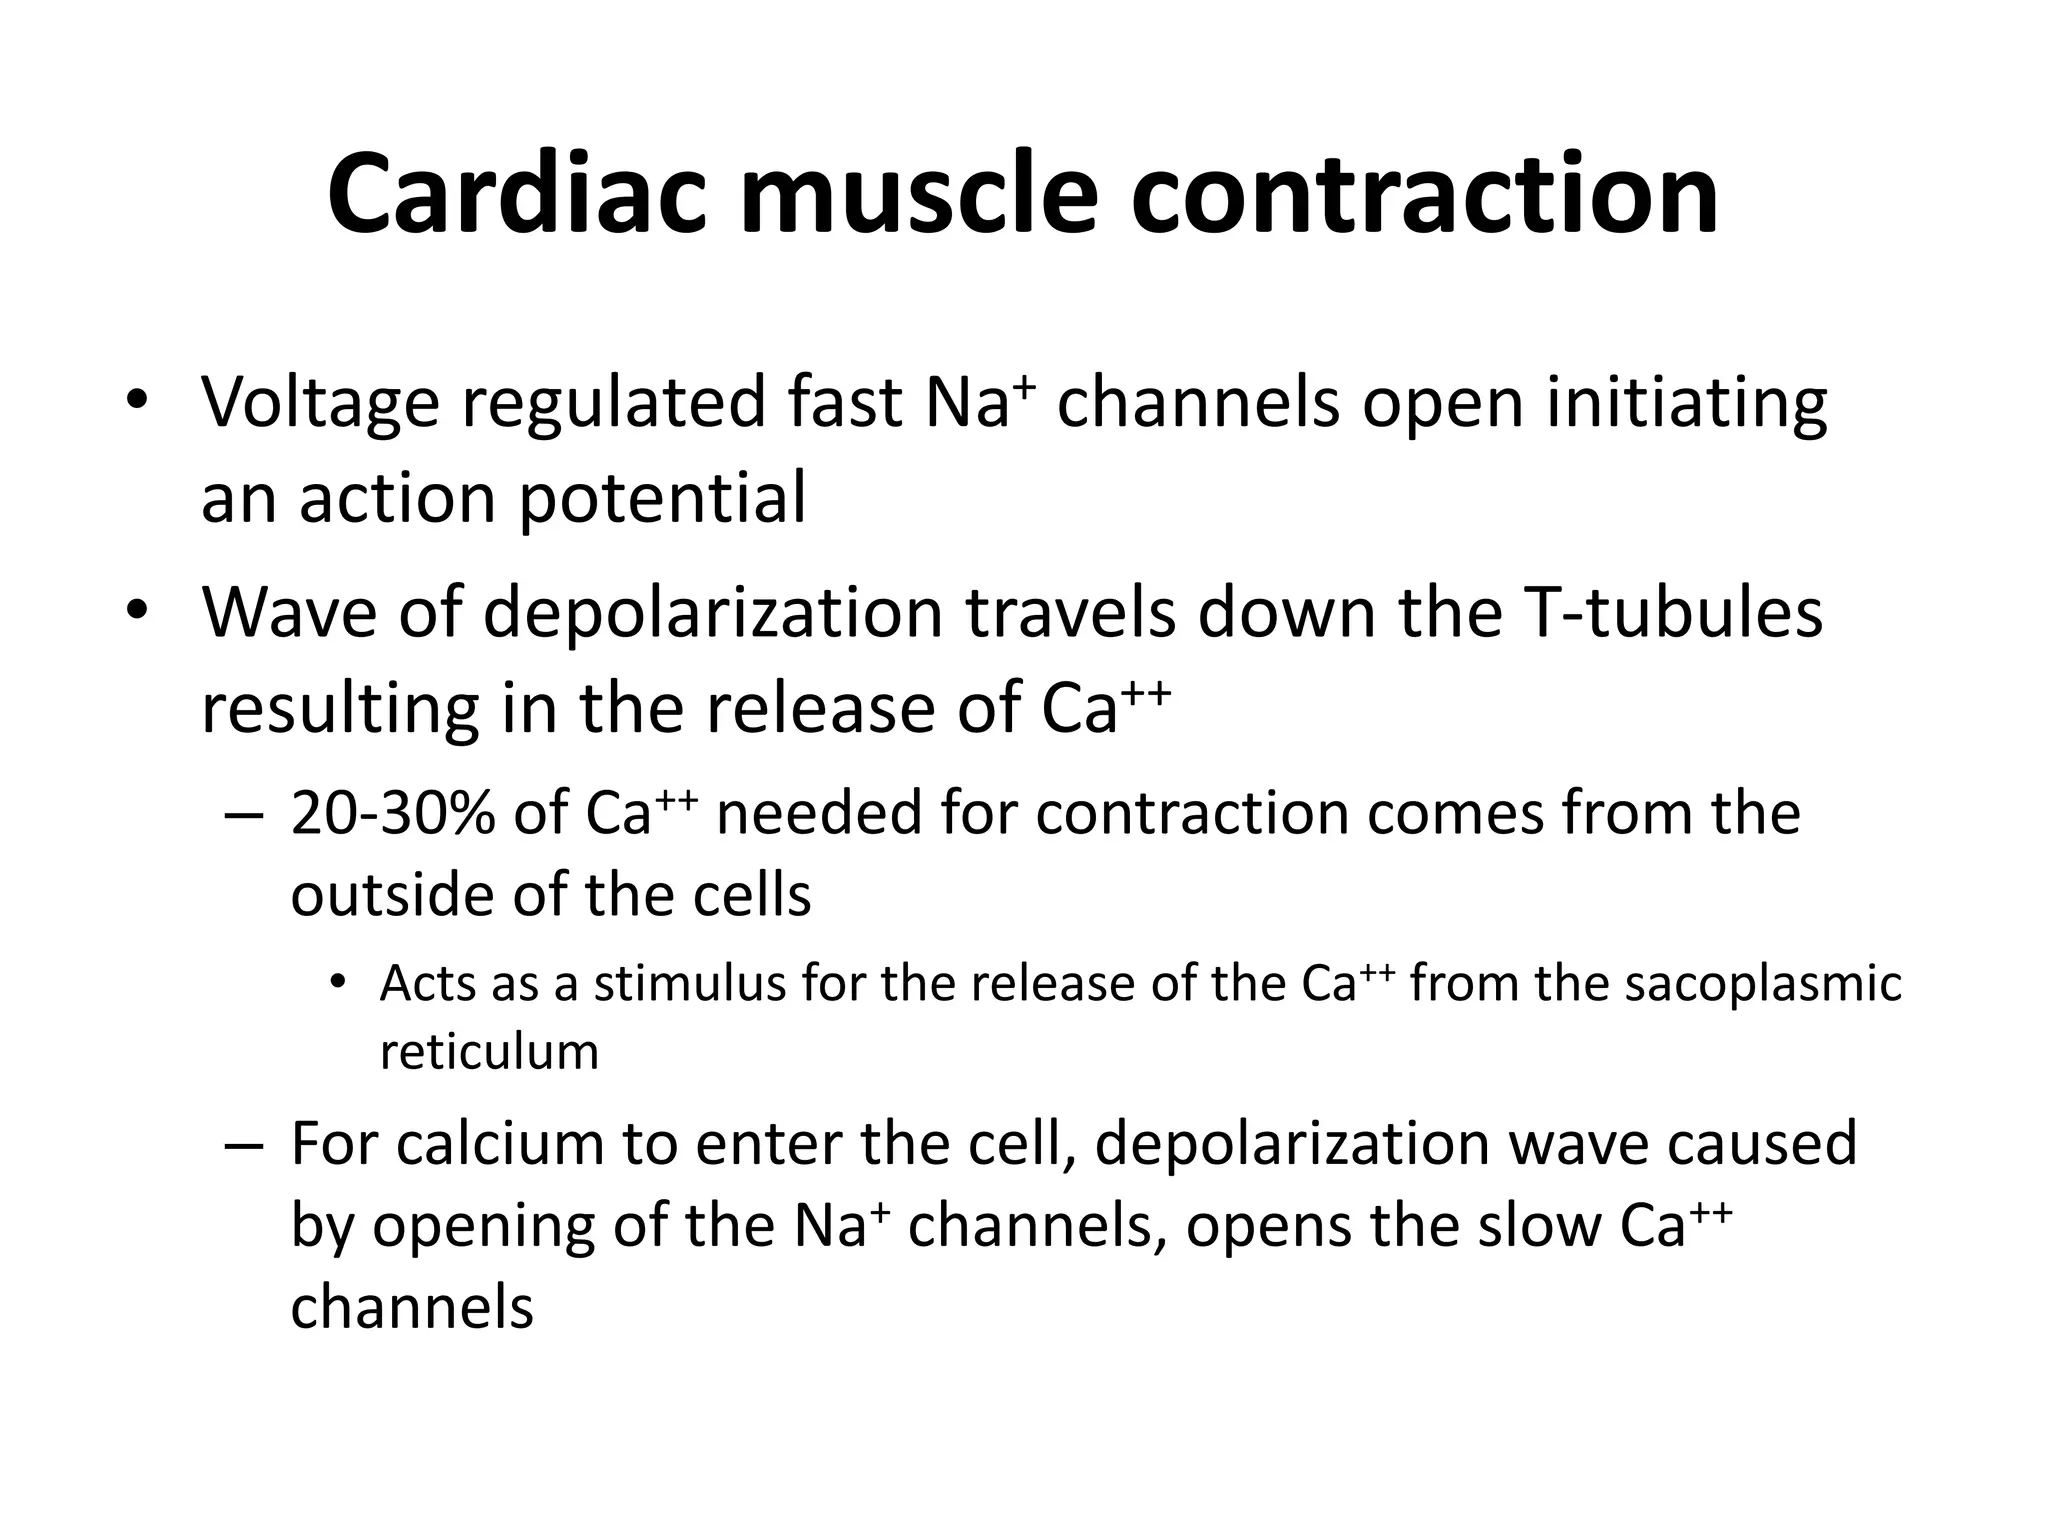
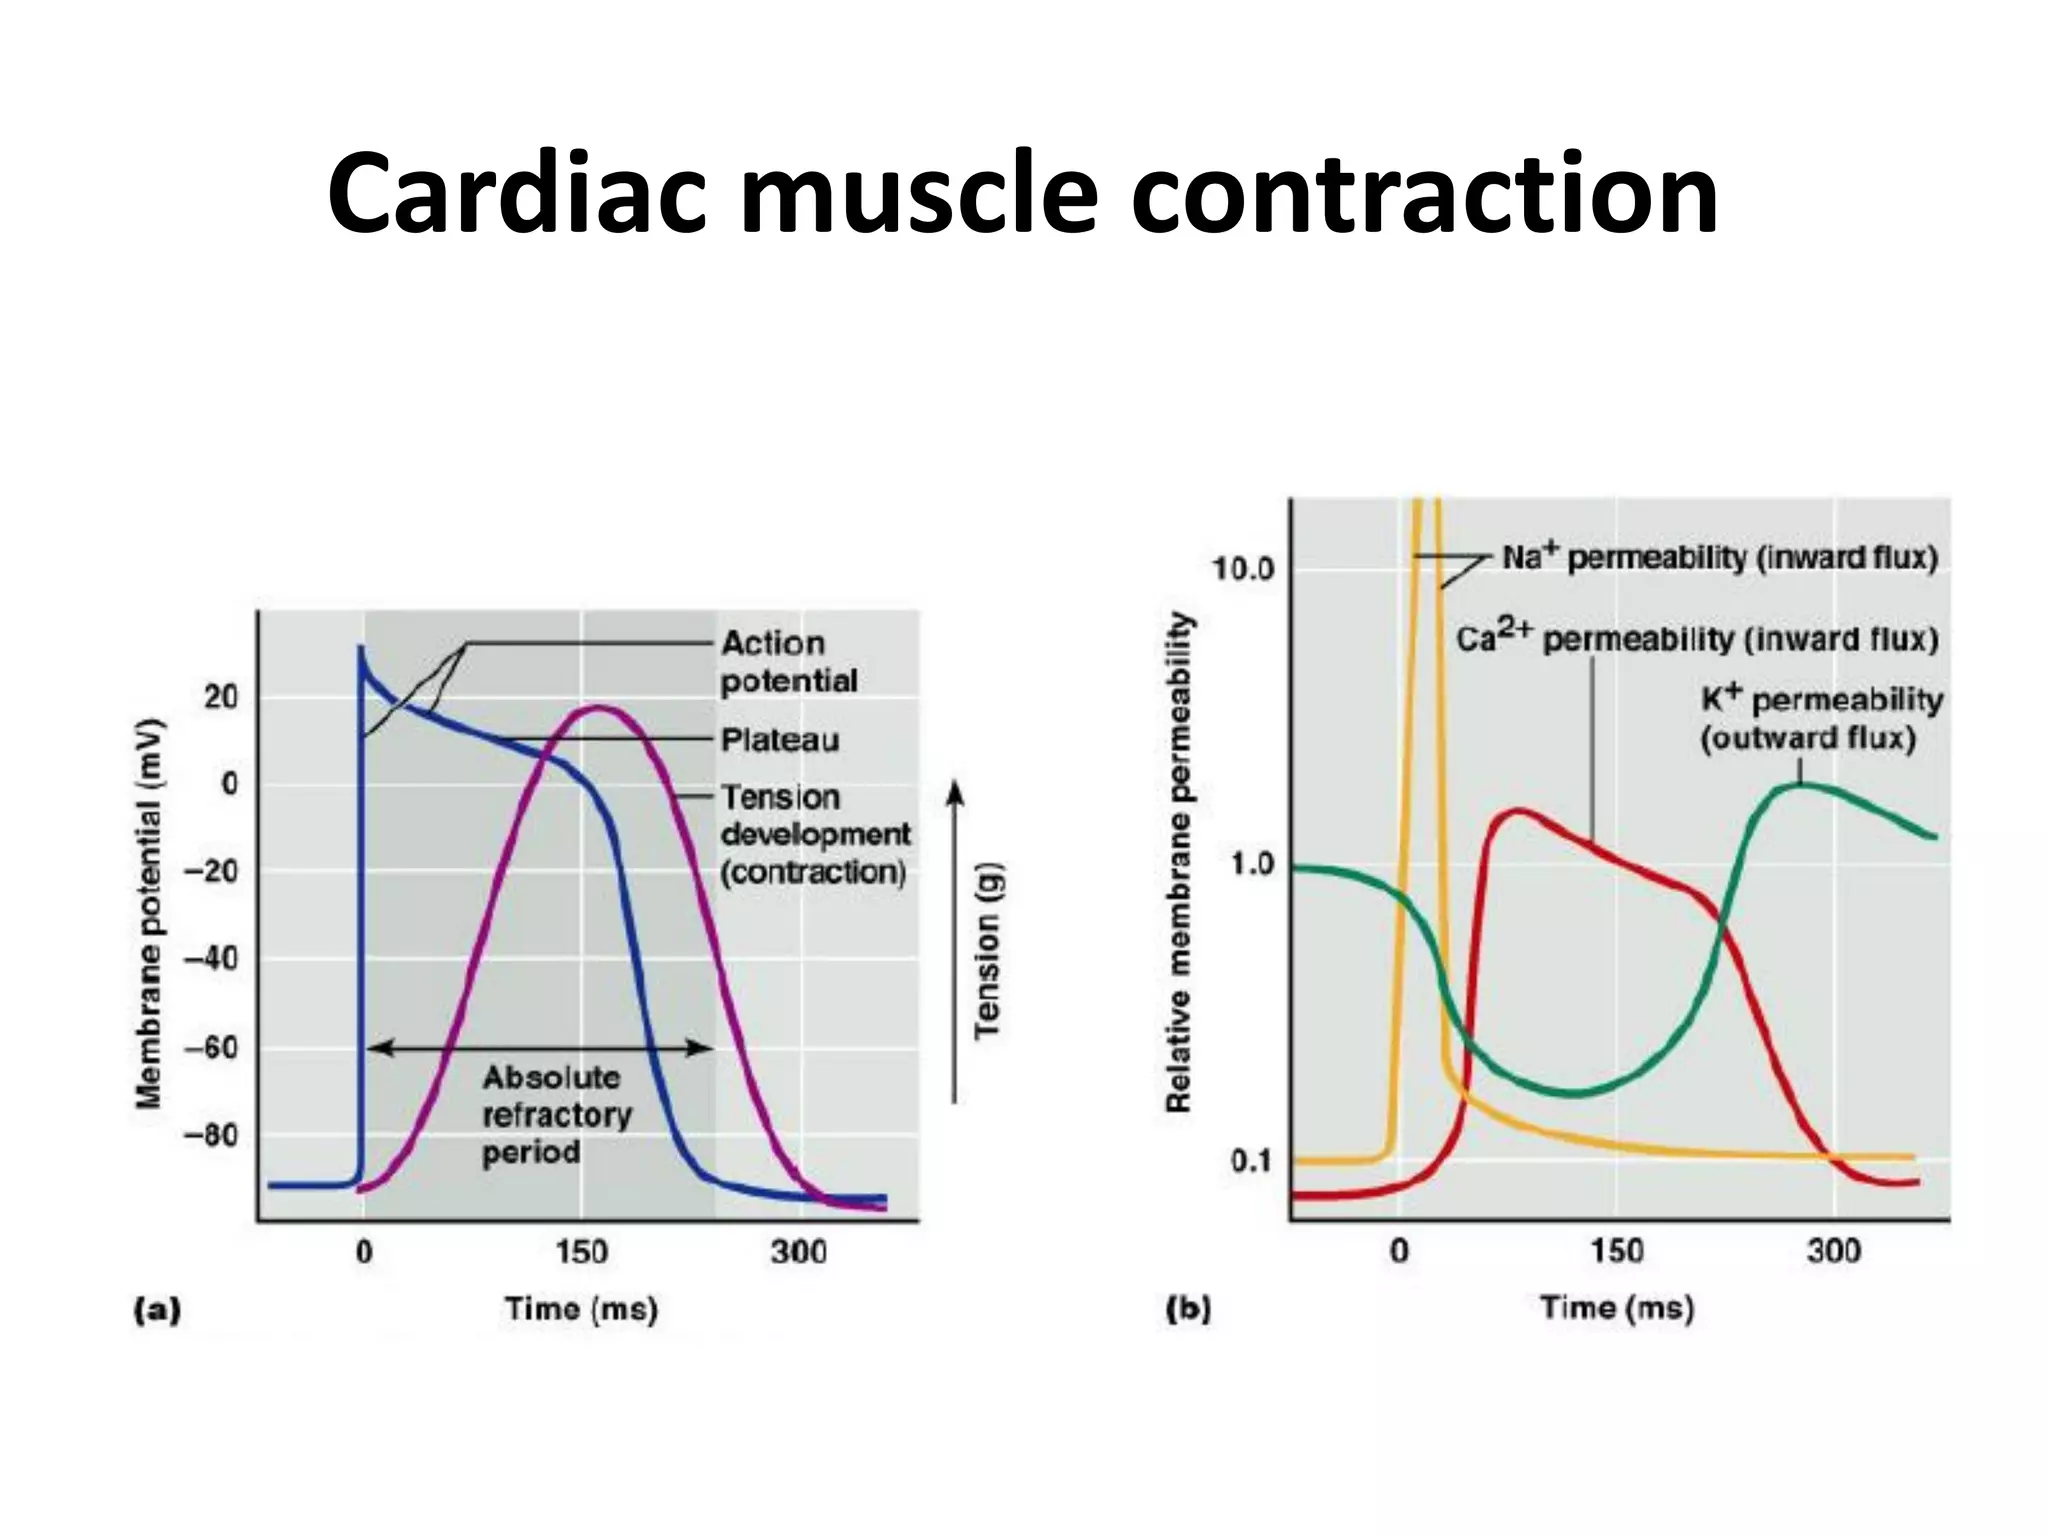
- Cardiac muscle contraction is stimulated by electrical impulses that cause calcium release and muscle contraction.
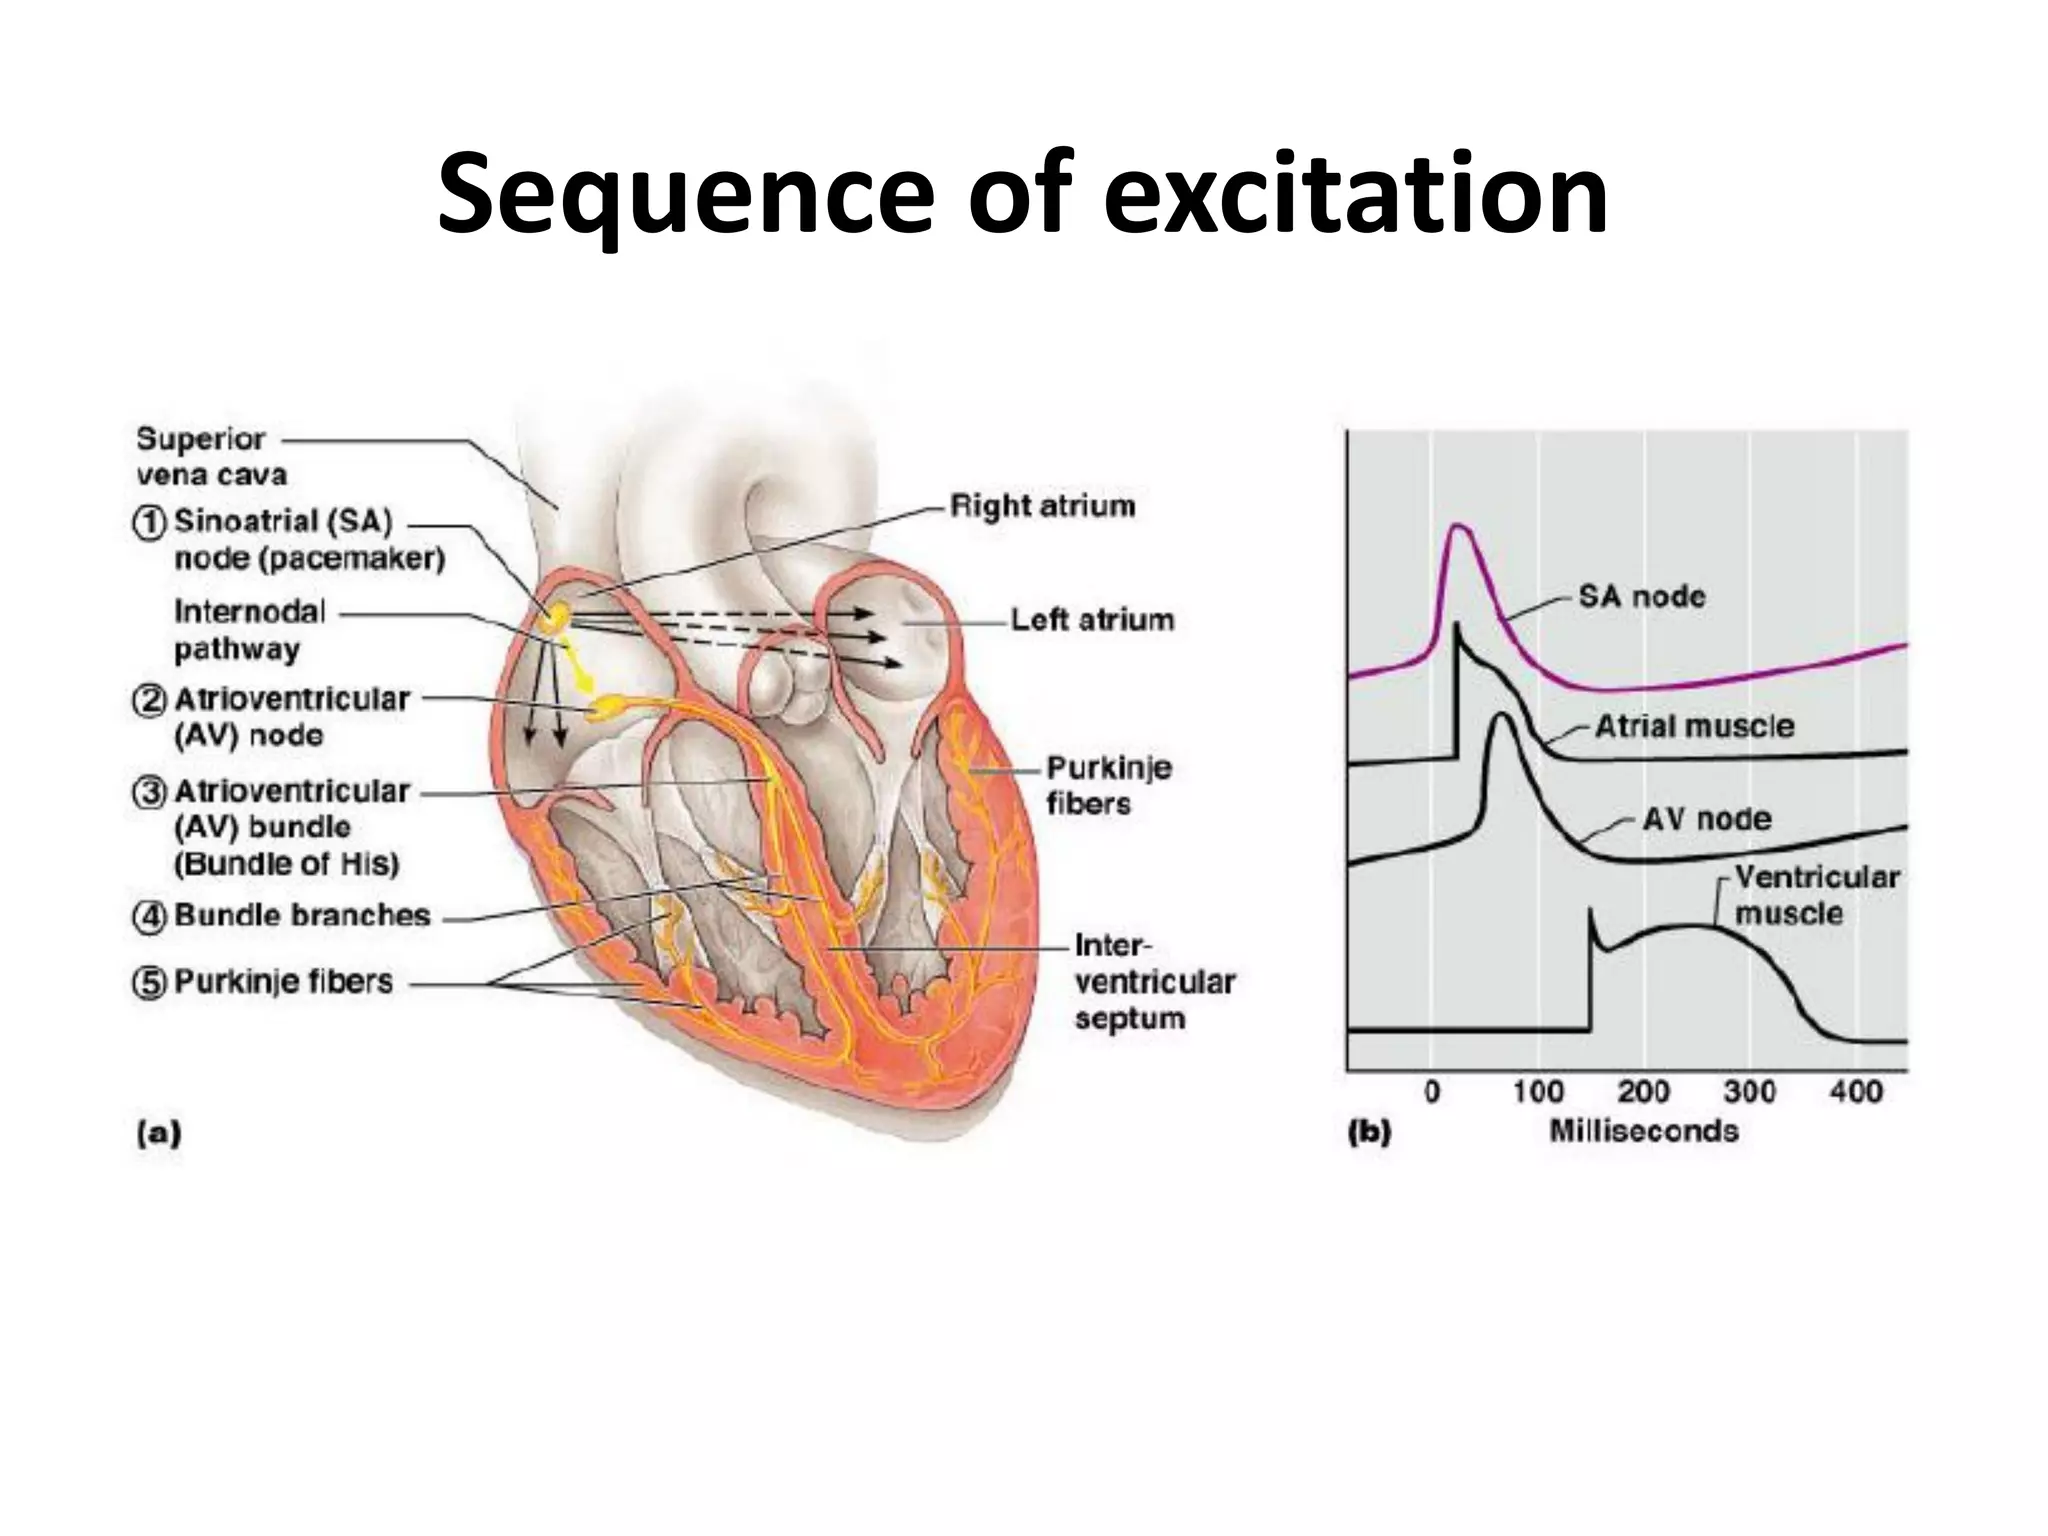
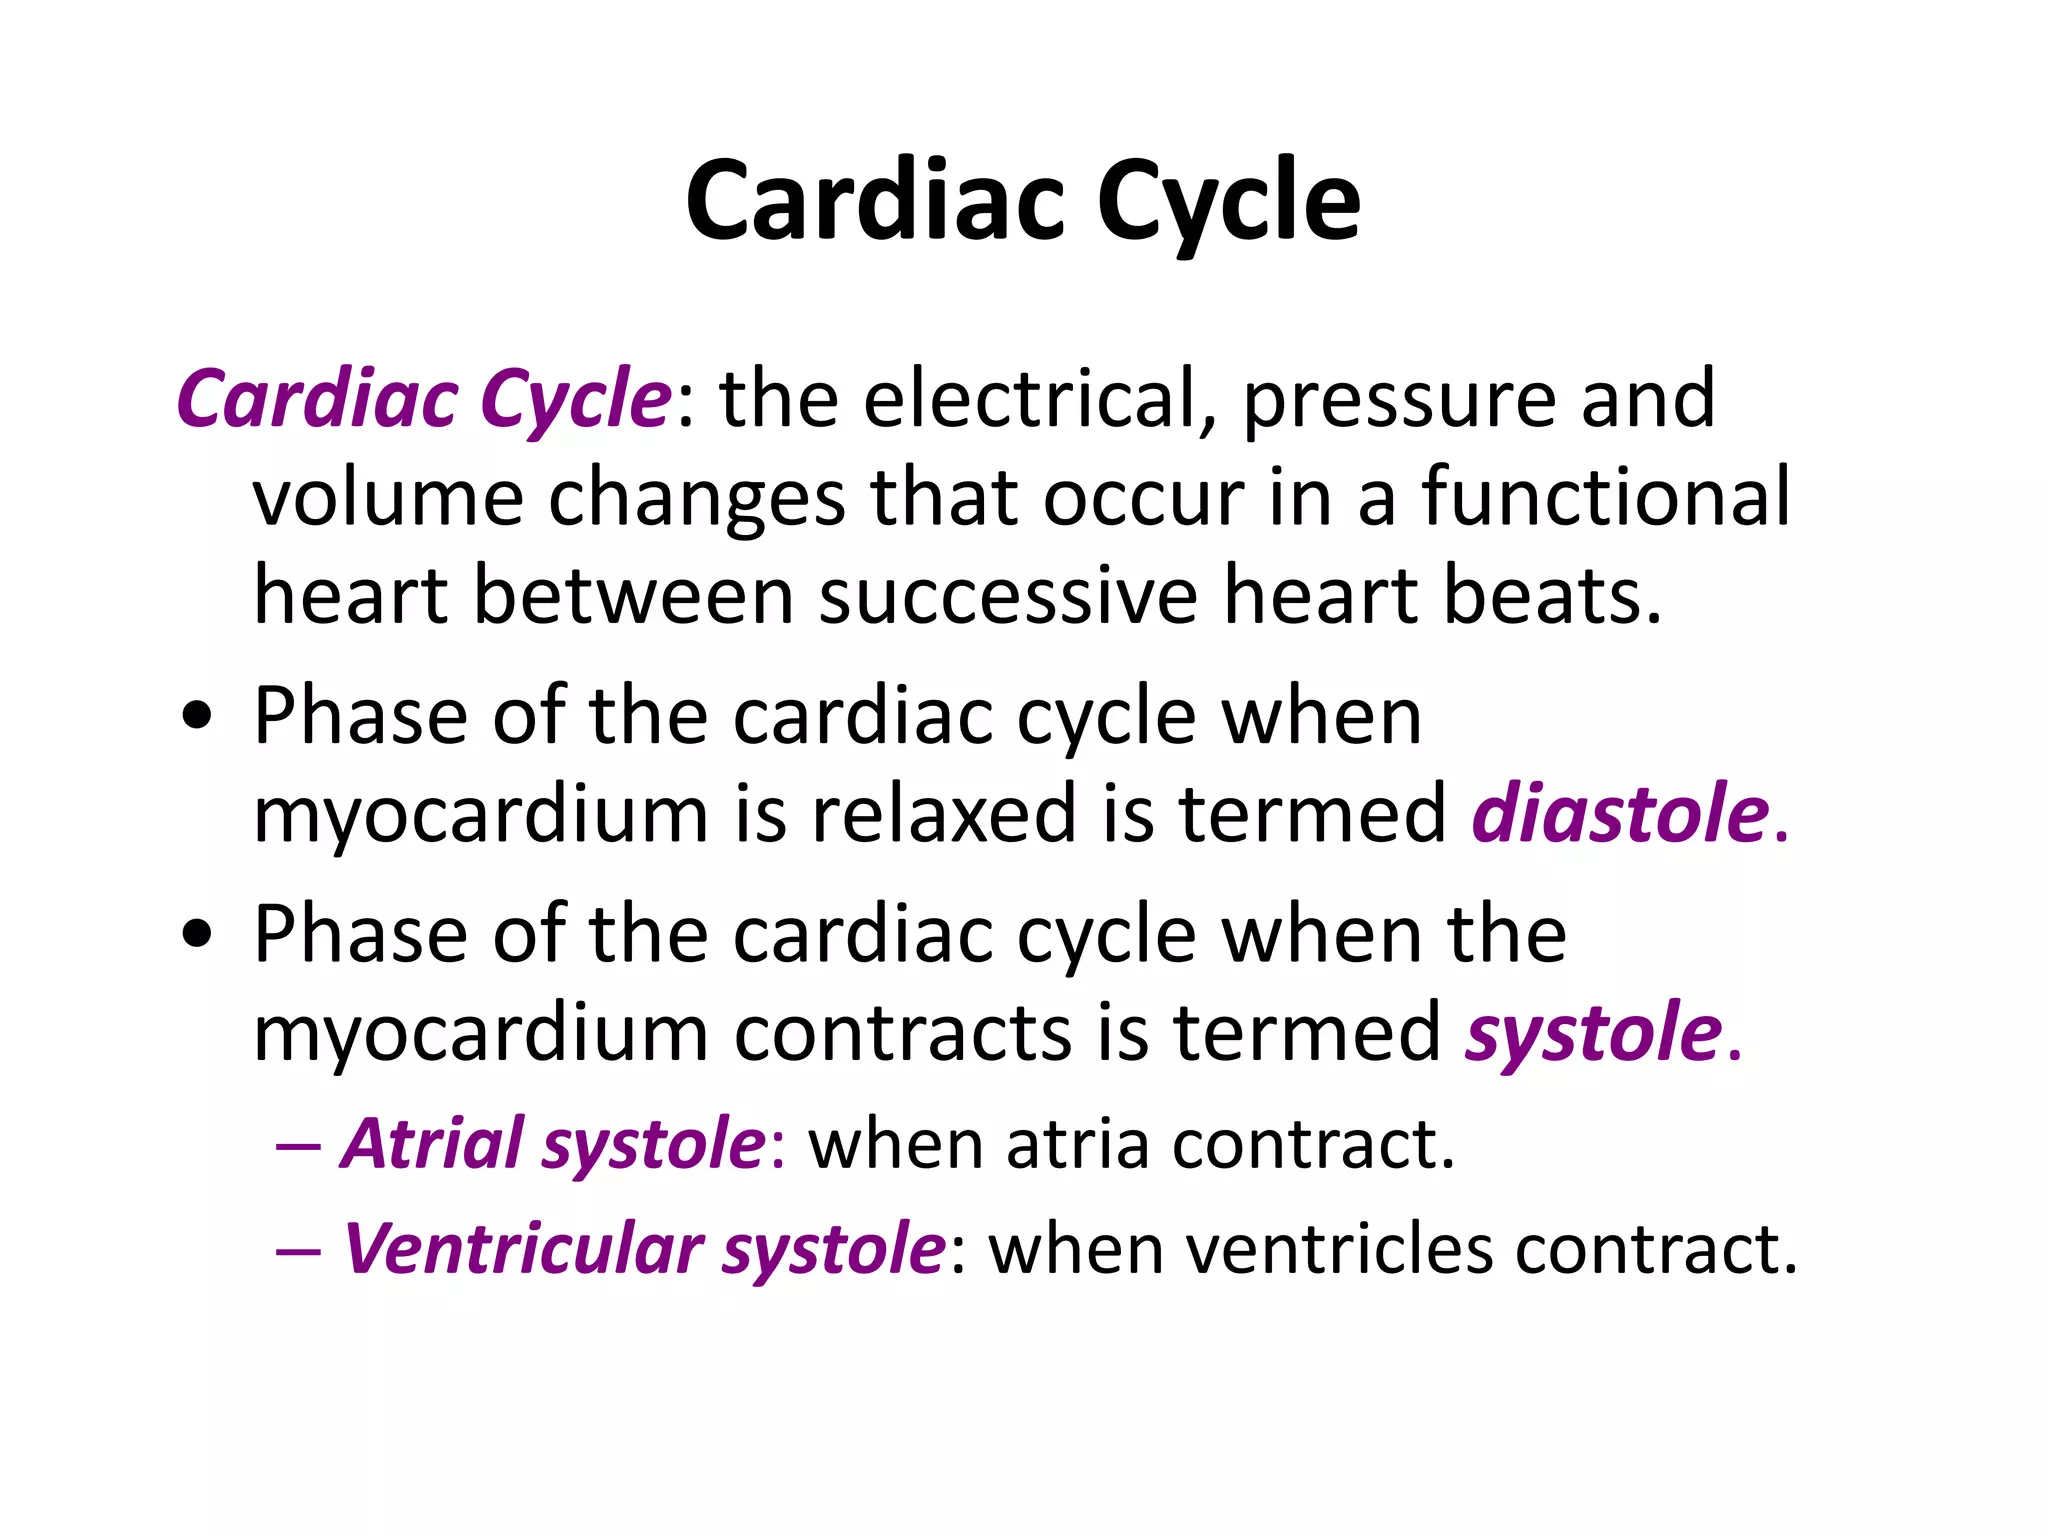
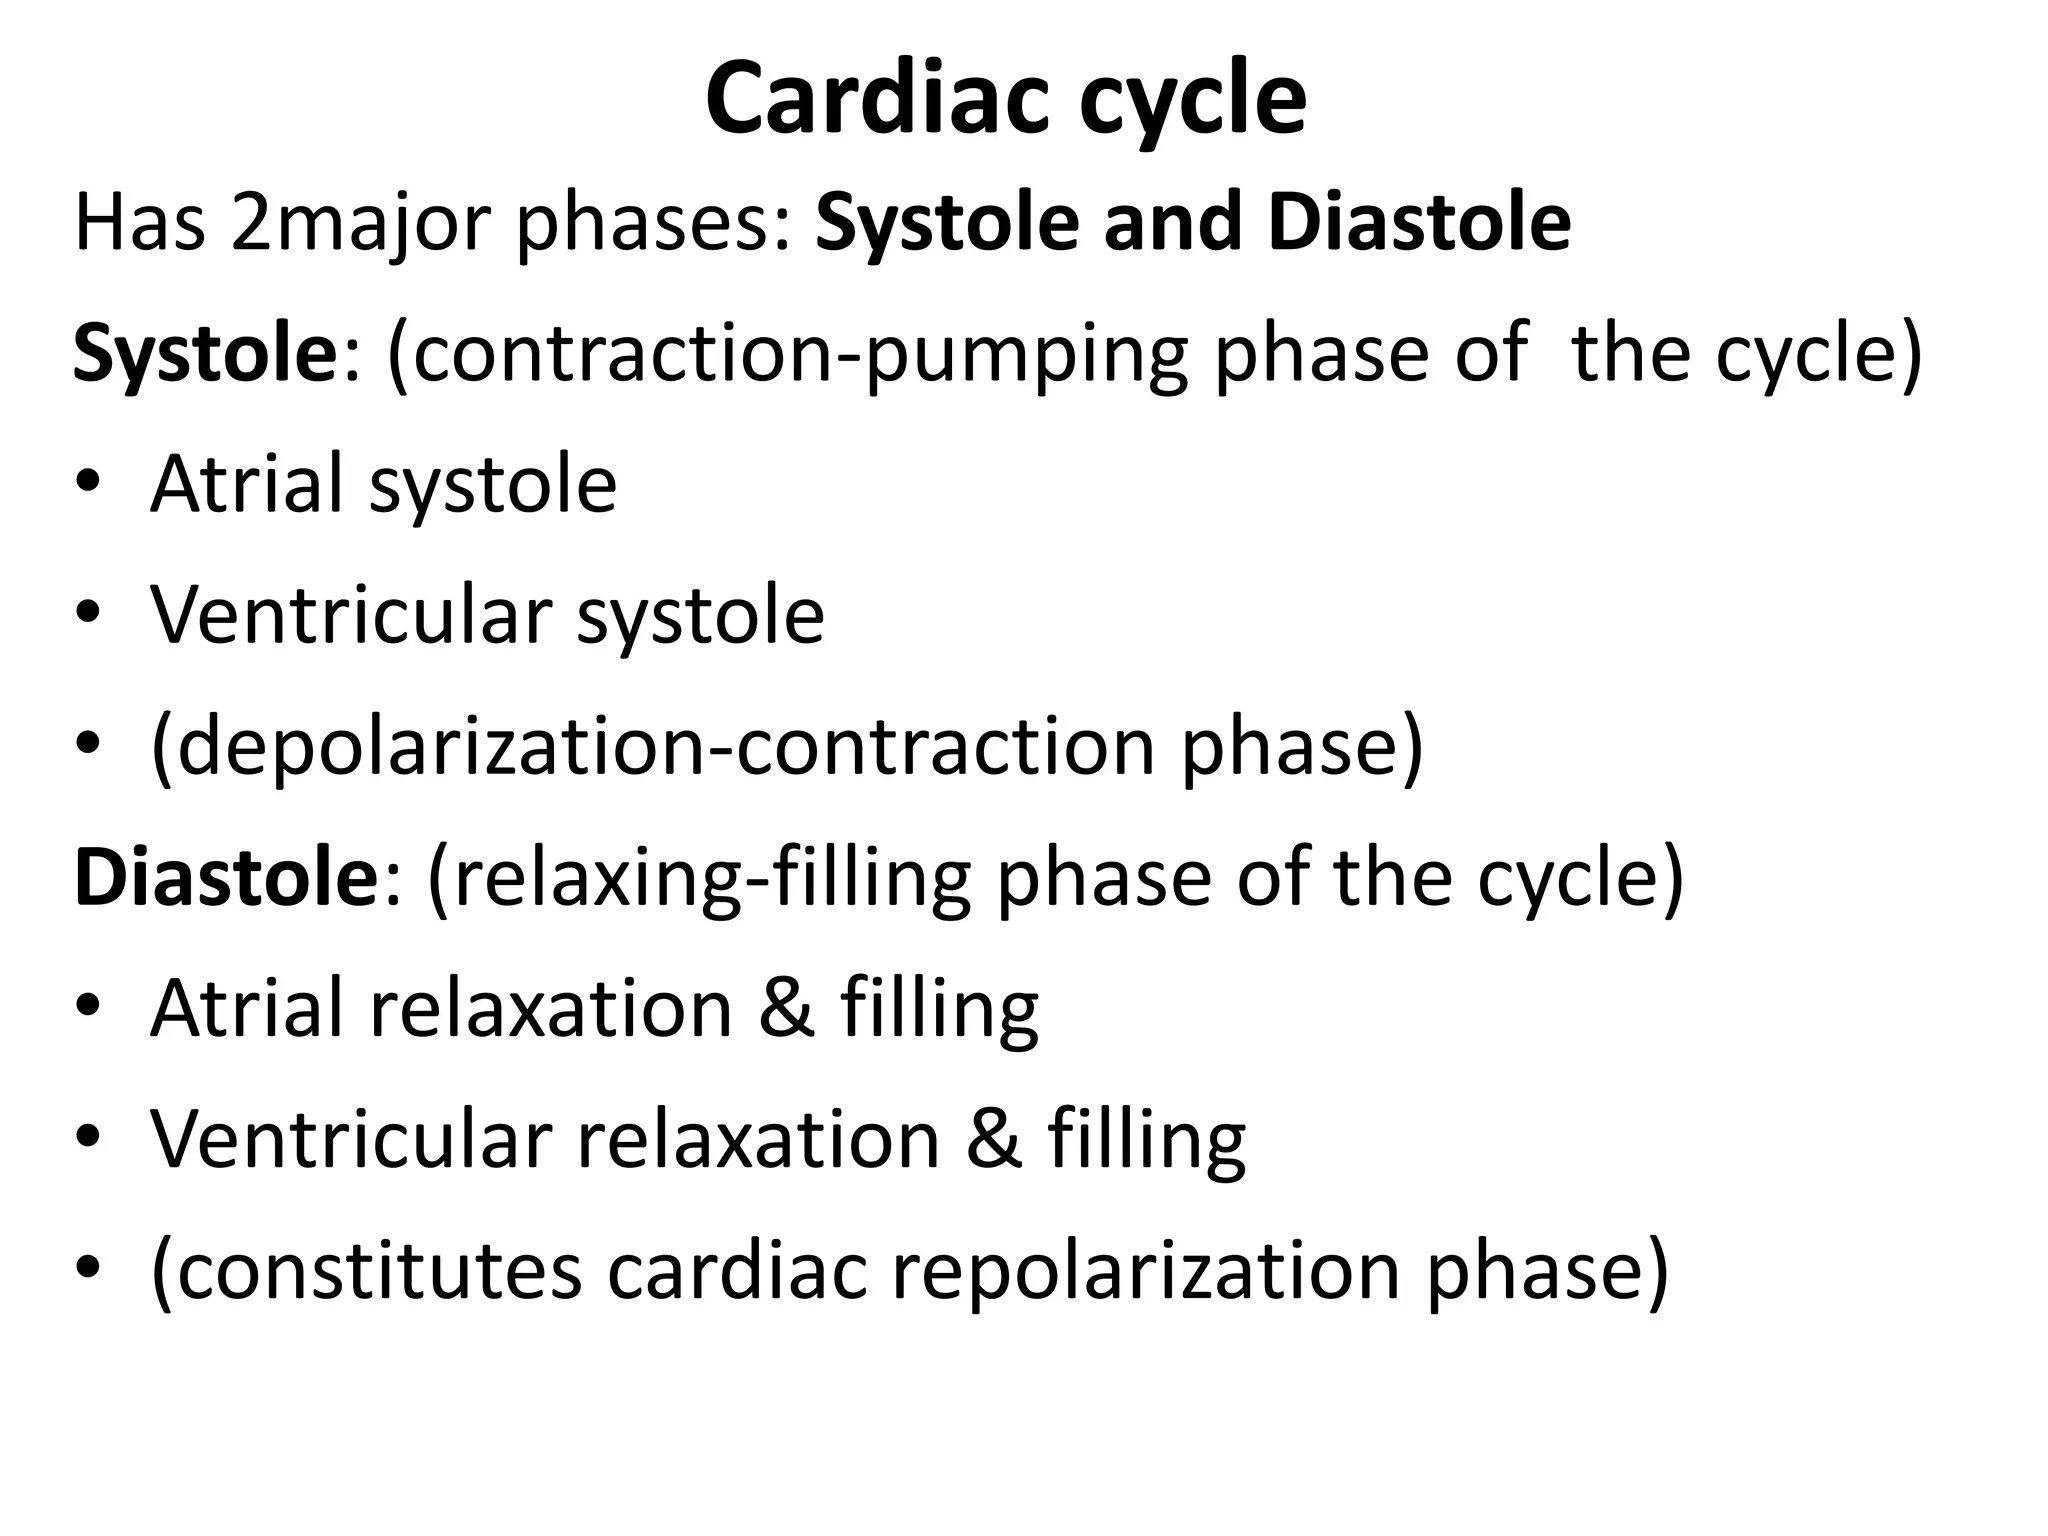
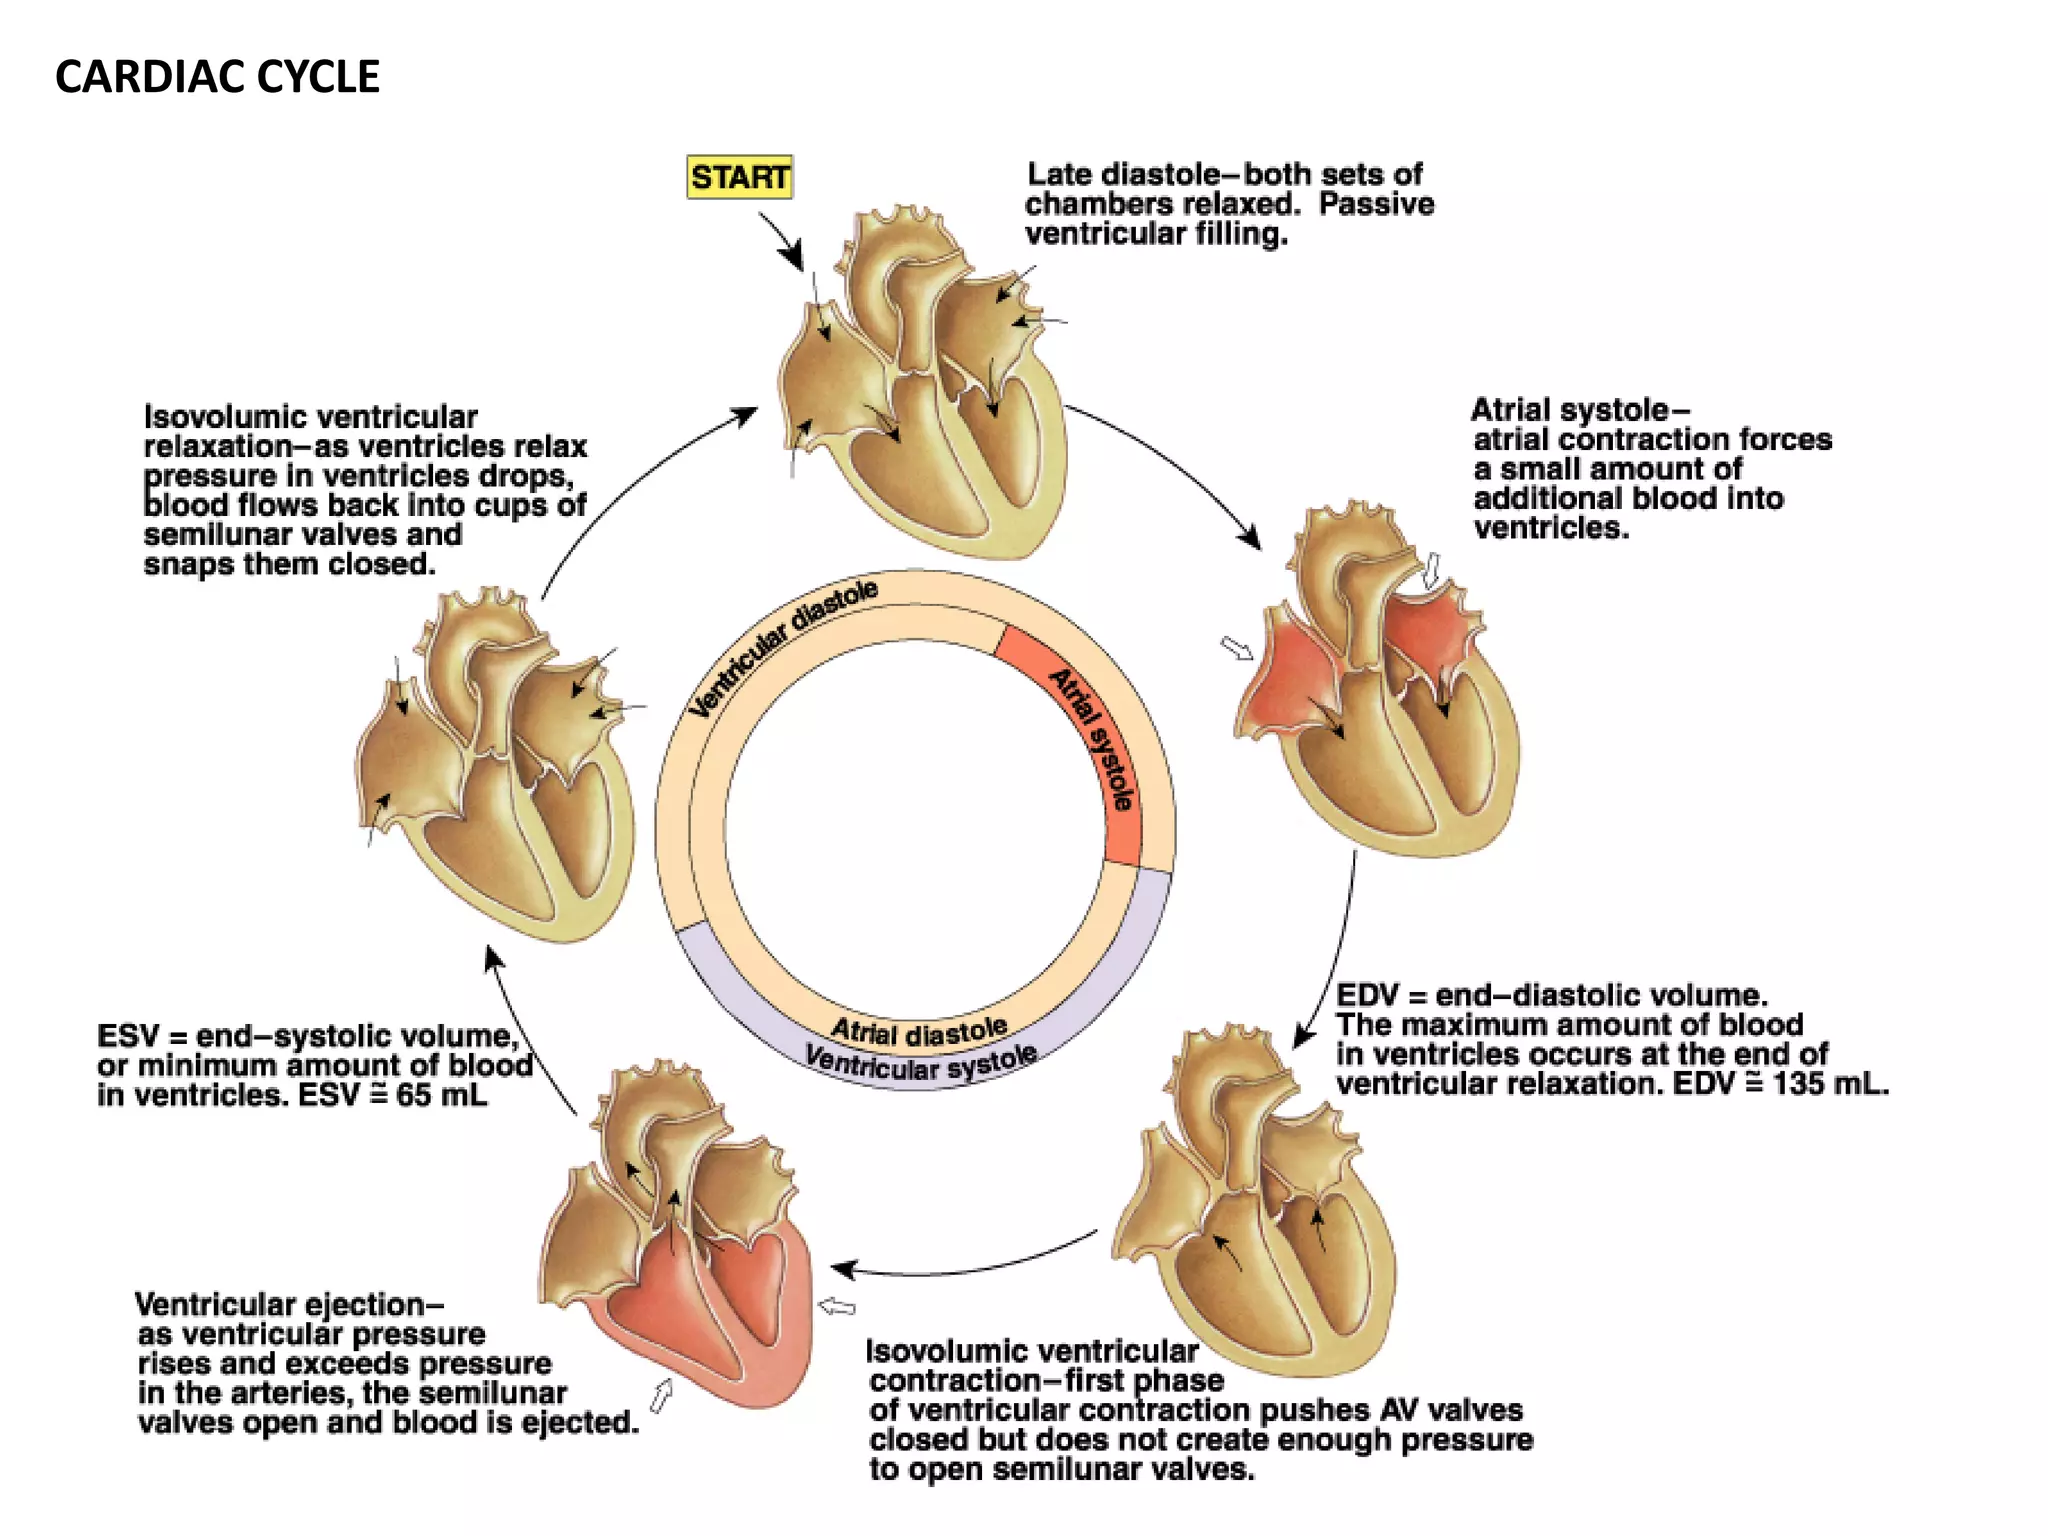
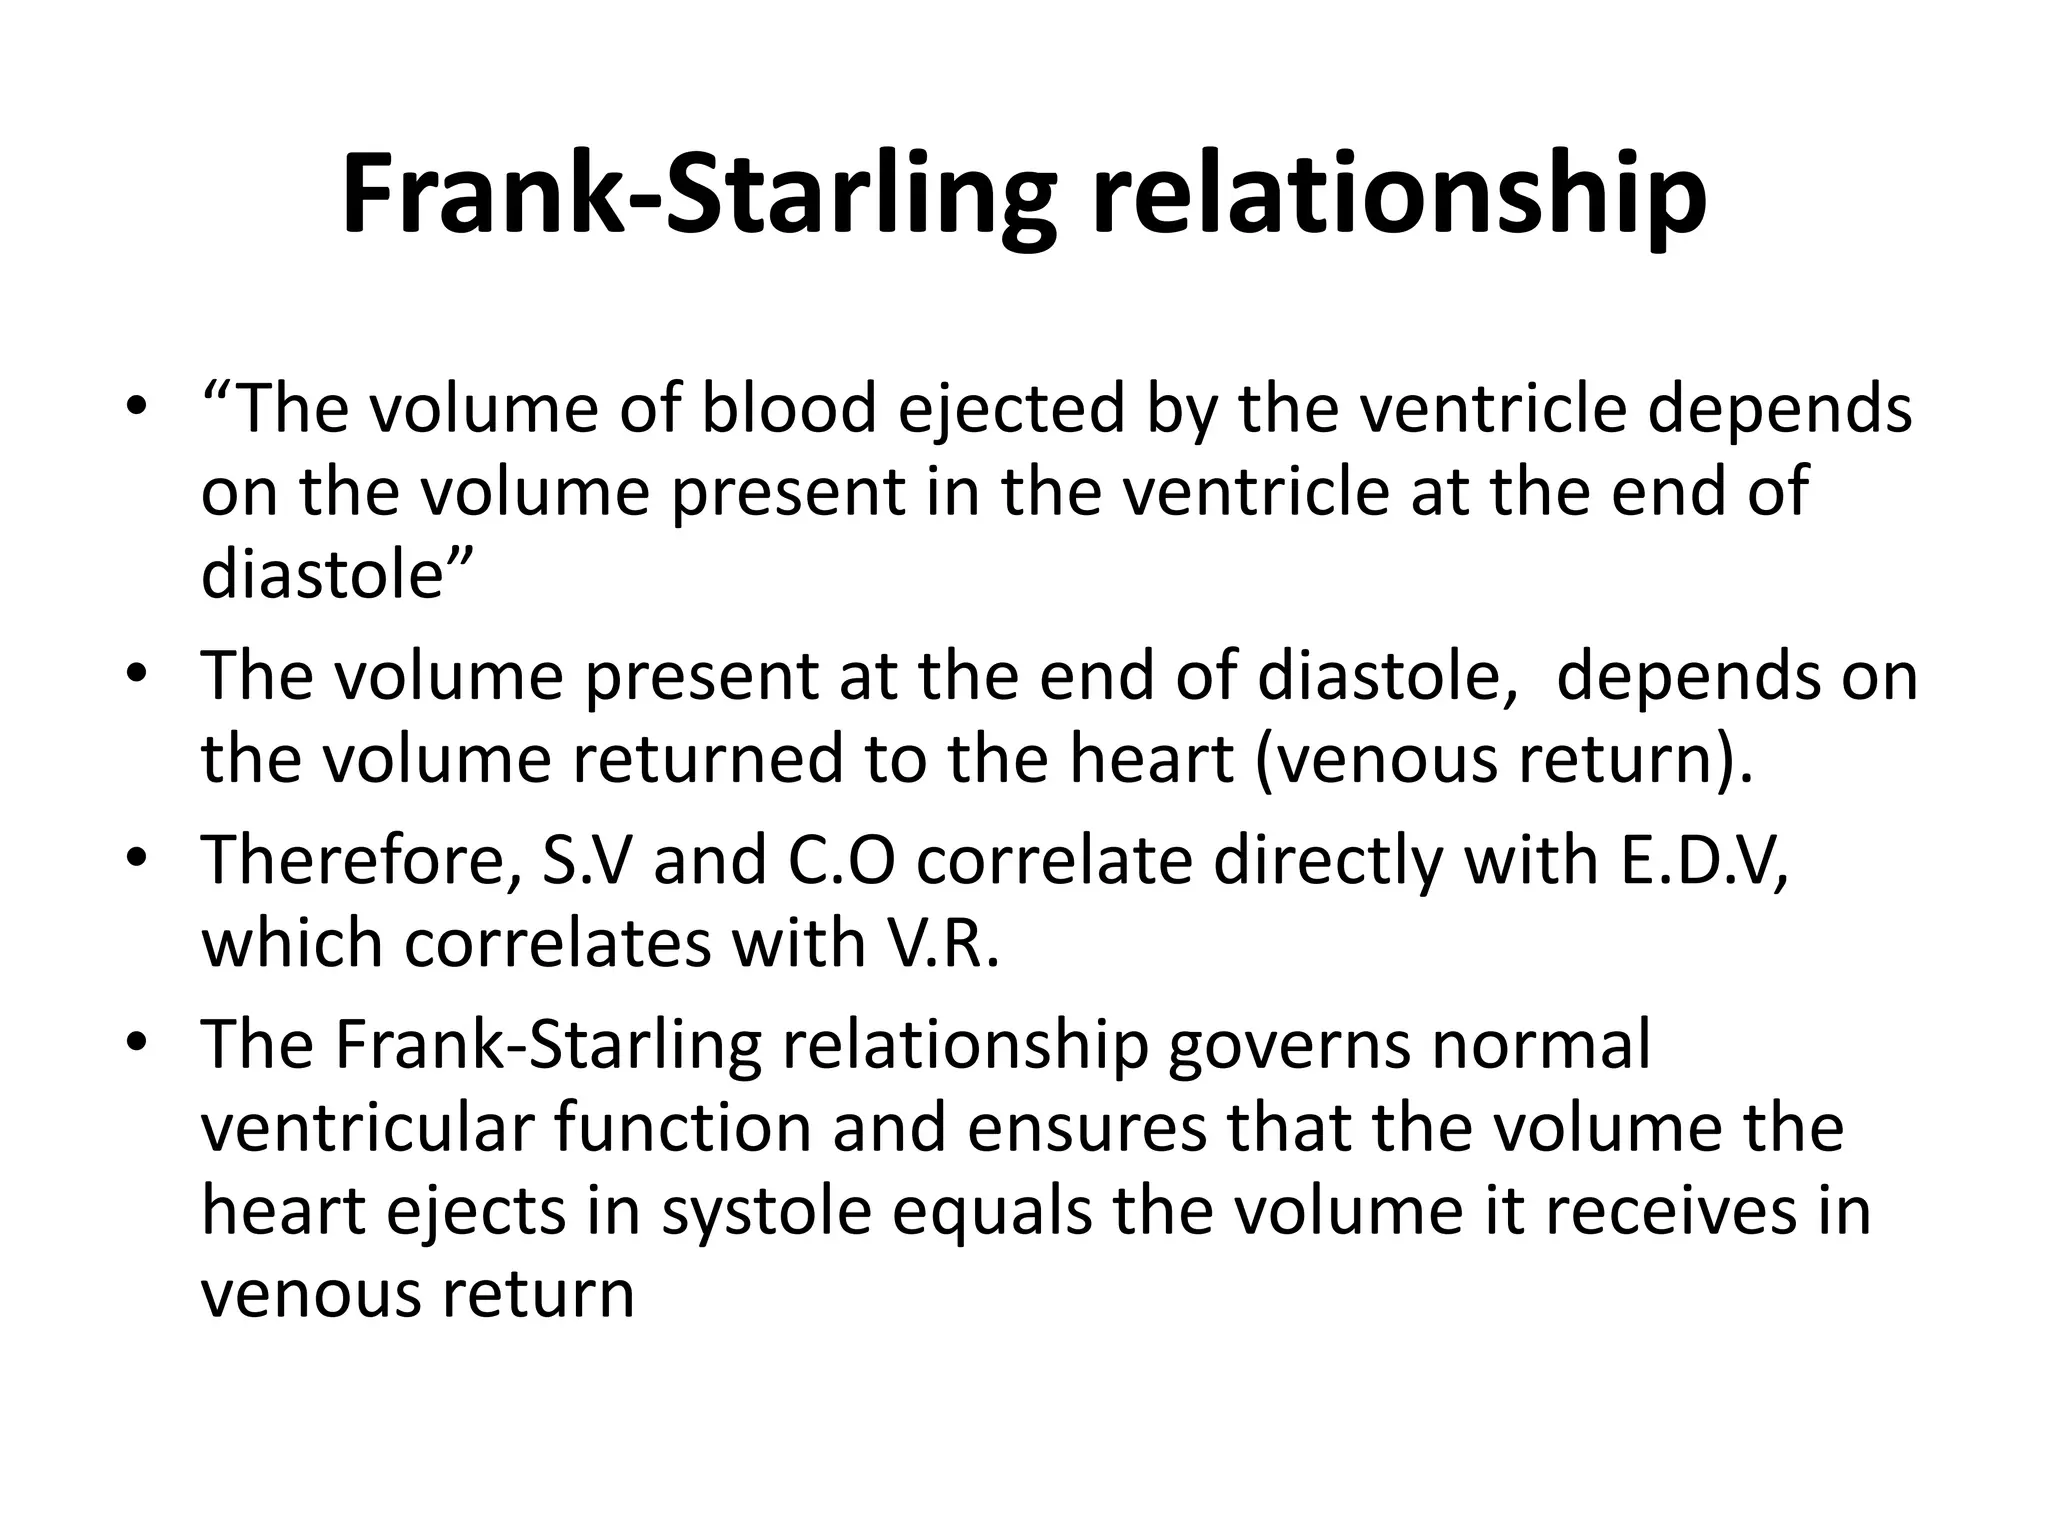
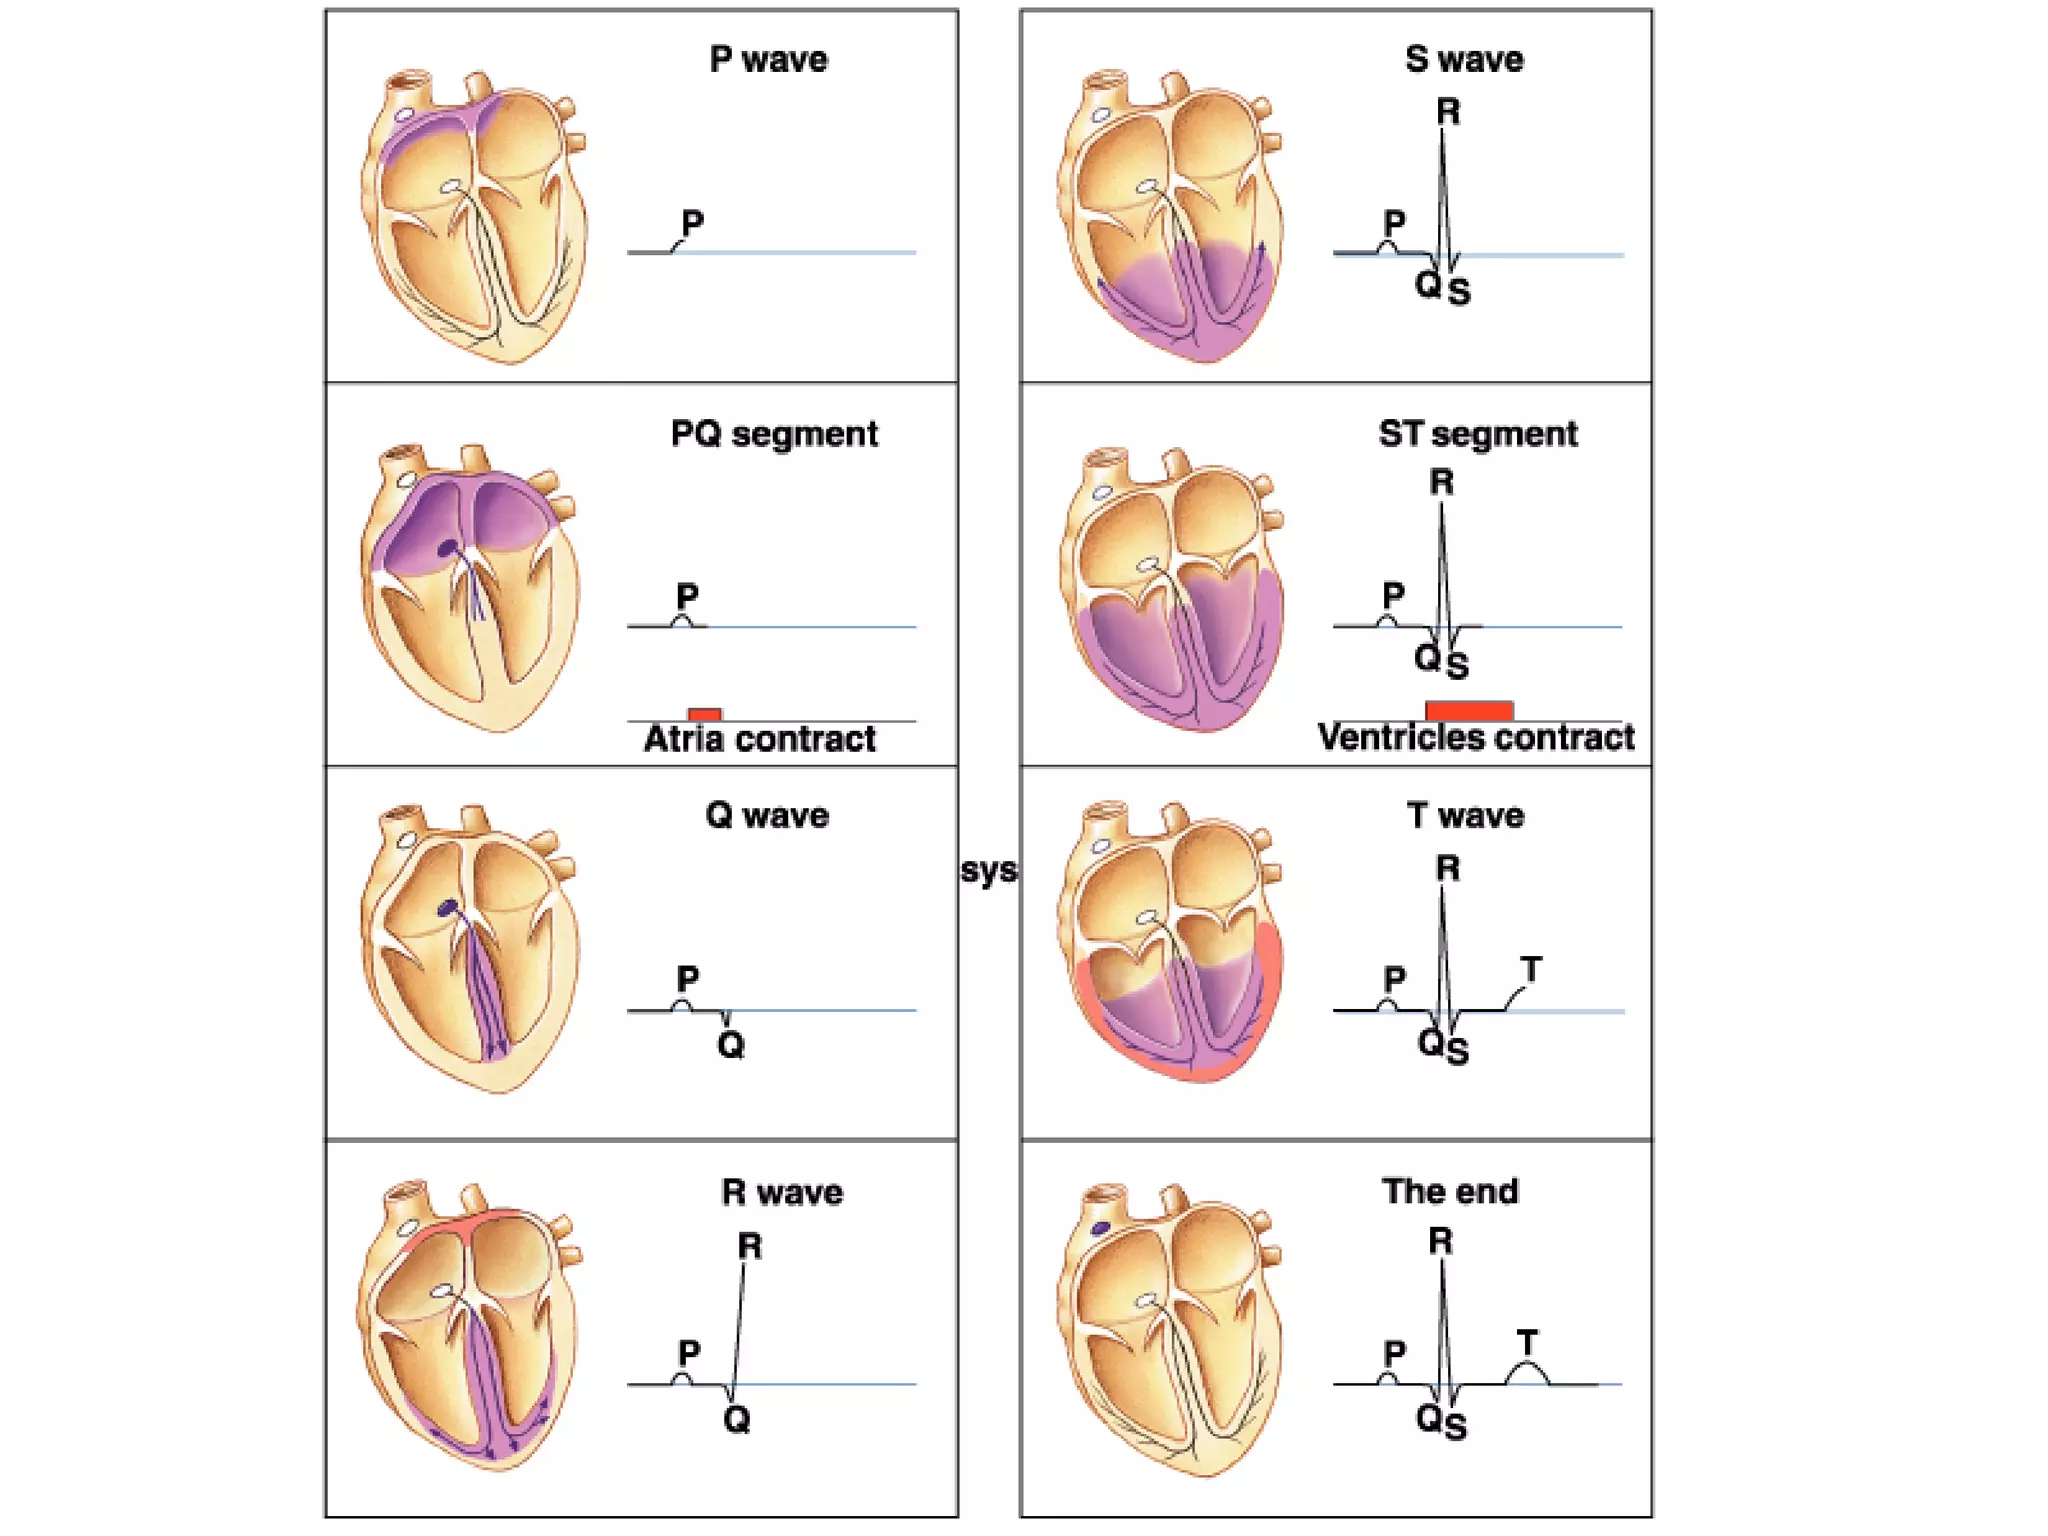
- The cardiac cycle coordinates electrical and mechanical events in the heart

![Mechanical Events of the Cardiac Cycle
1. Ventricular Filling Period [ventricular diastole,
atrial systole]
2. Isovolumetric Contraction Period [ventricular
systole]
3. Ventricular Ejection Period [ventricular systole]
4. Isovolumetric Relaxation Period [ventricular
diastole]](https://image.slidesharecdn.com/cardiovascularsystem-ecg-230123024257-40a5649d/75/Cardiovascular-system-ECG-pdf-28-2048.jpg)


![Shadechapter01.ppt [read only]](https://cdn.slidesharecdn.com/ss_thumbnails/shadechapter01-150421101218-conversion-gate01-thumbnail.jpg?width=640&height=640&fit=bounds)


![THALIDOMIDE PRESENTATION[1].pptxnnnnnnnn](https://cdn.slidesharecdn.com/ss_thumbnails/thalidomidepresentation1-250412160954-6e5ee681-thumbnail.jpg?width=640&height=640&fit=bounds)


