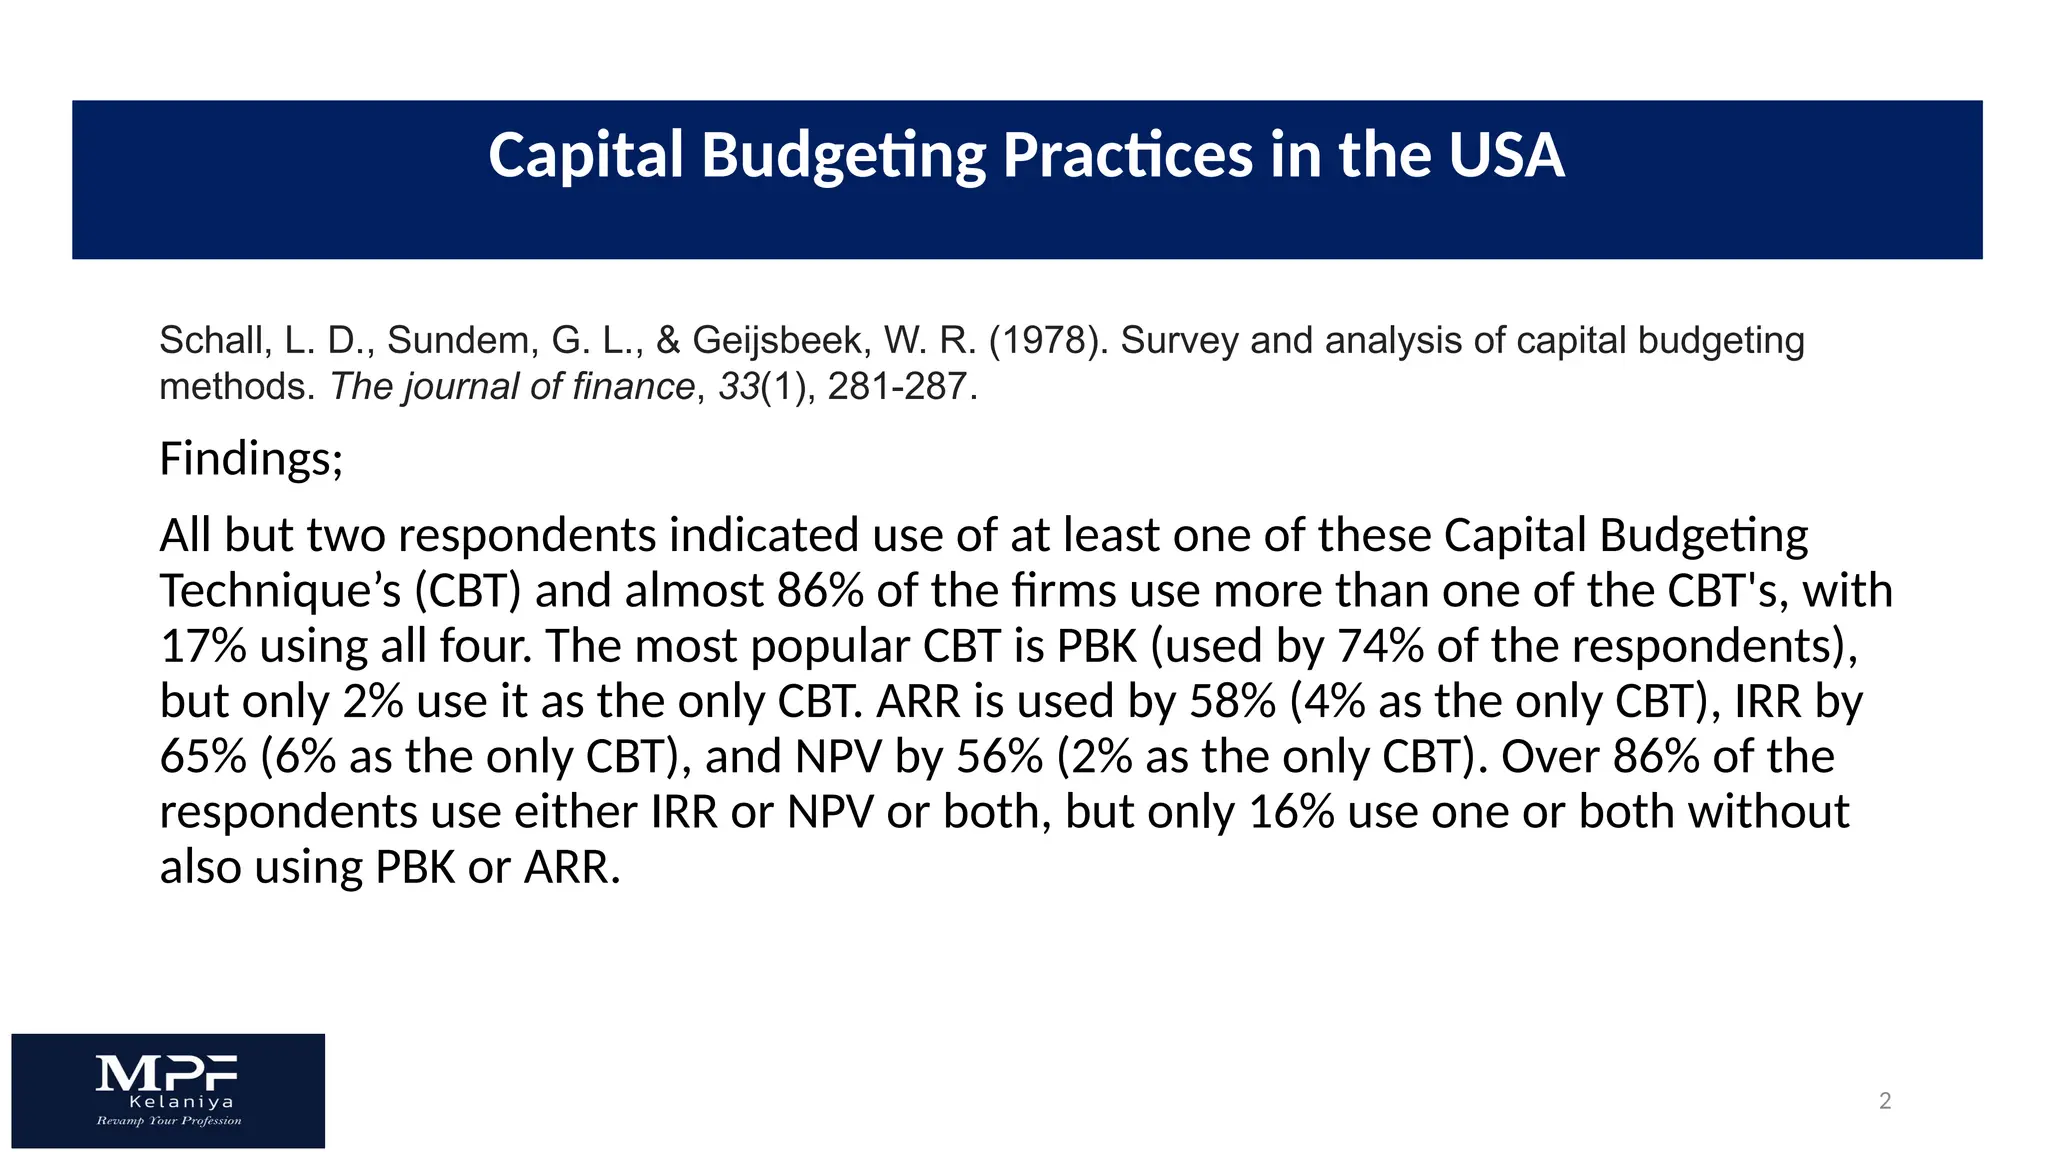
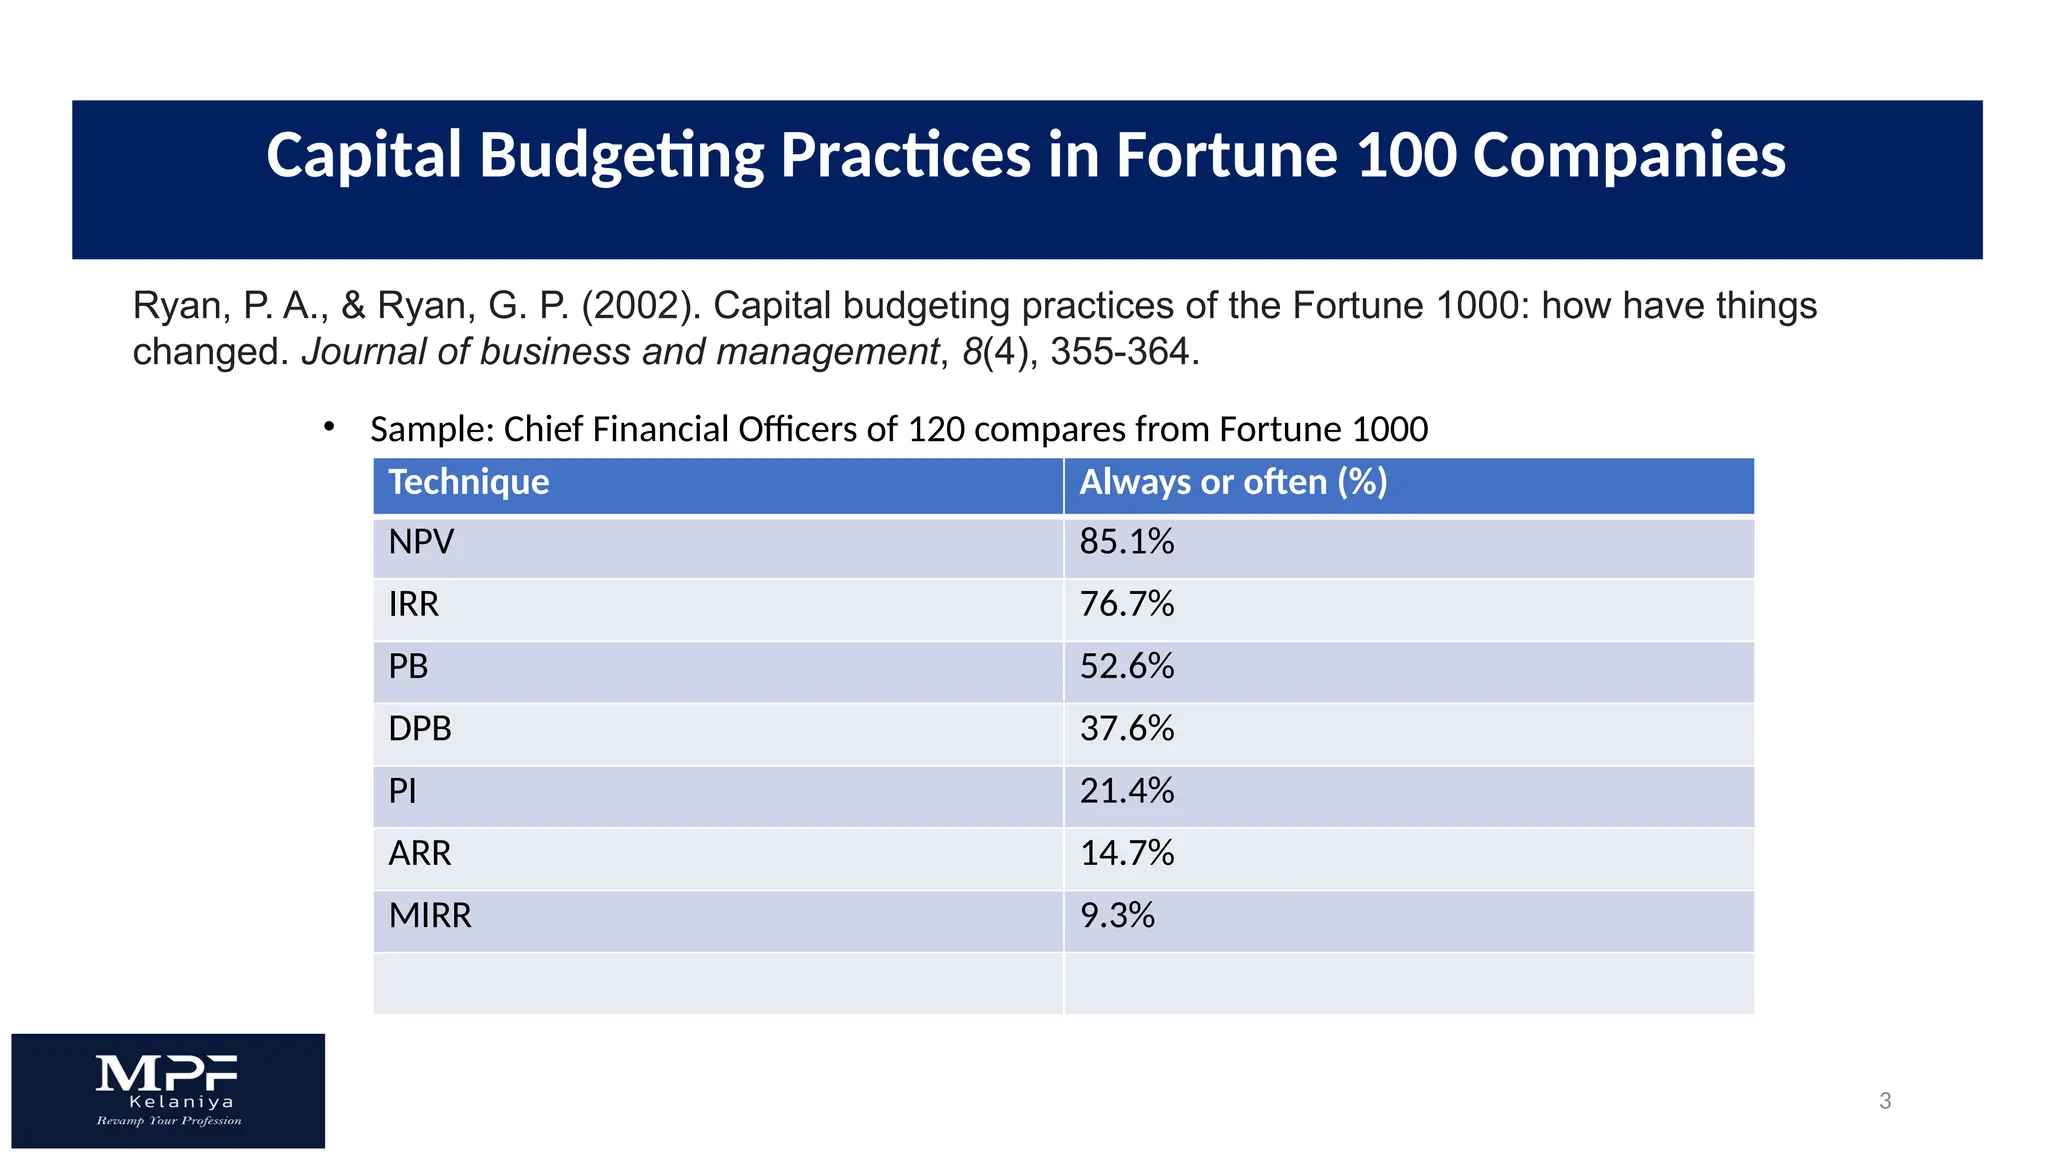
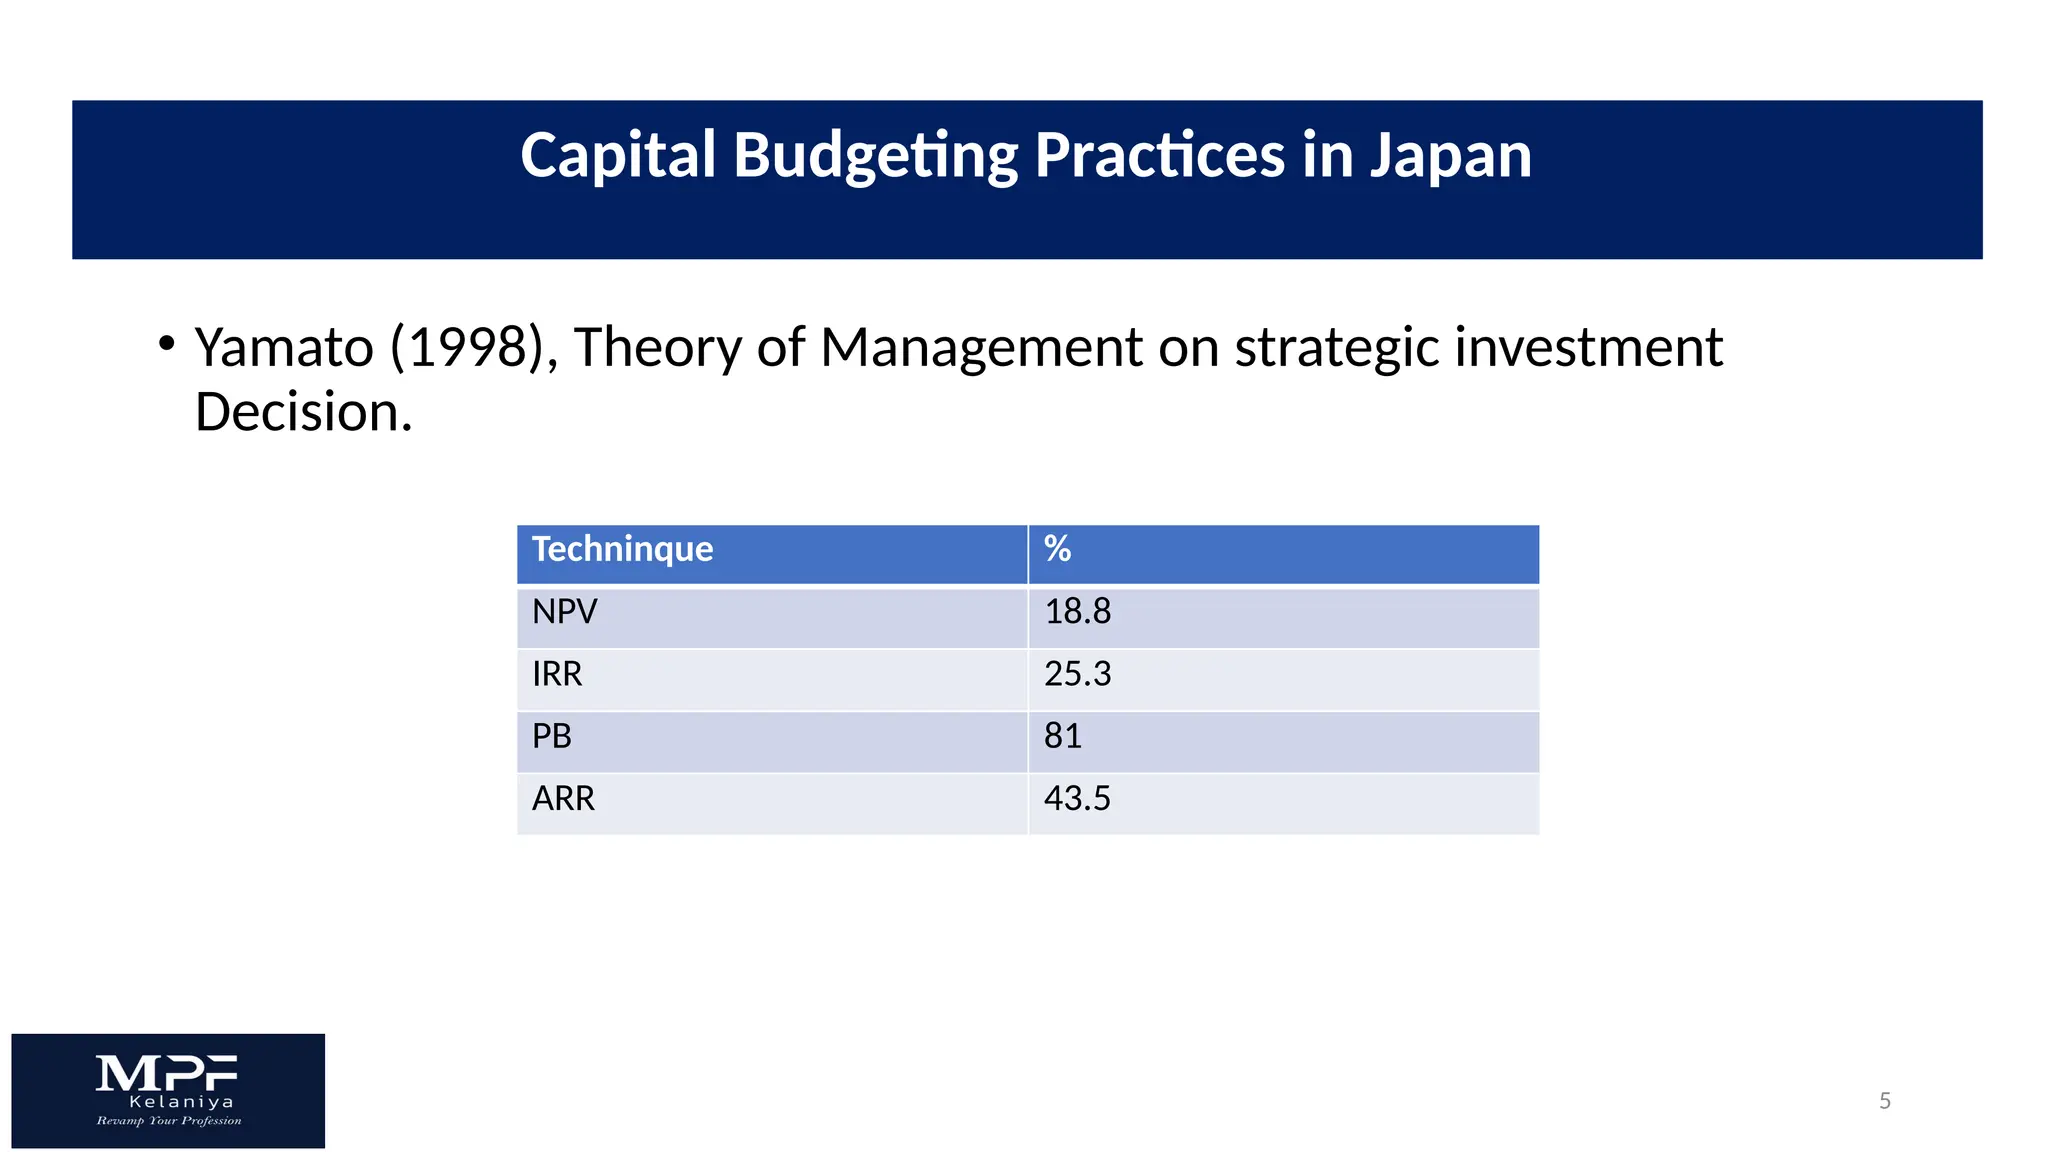
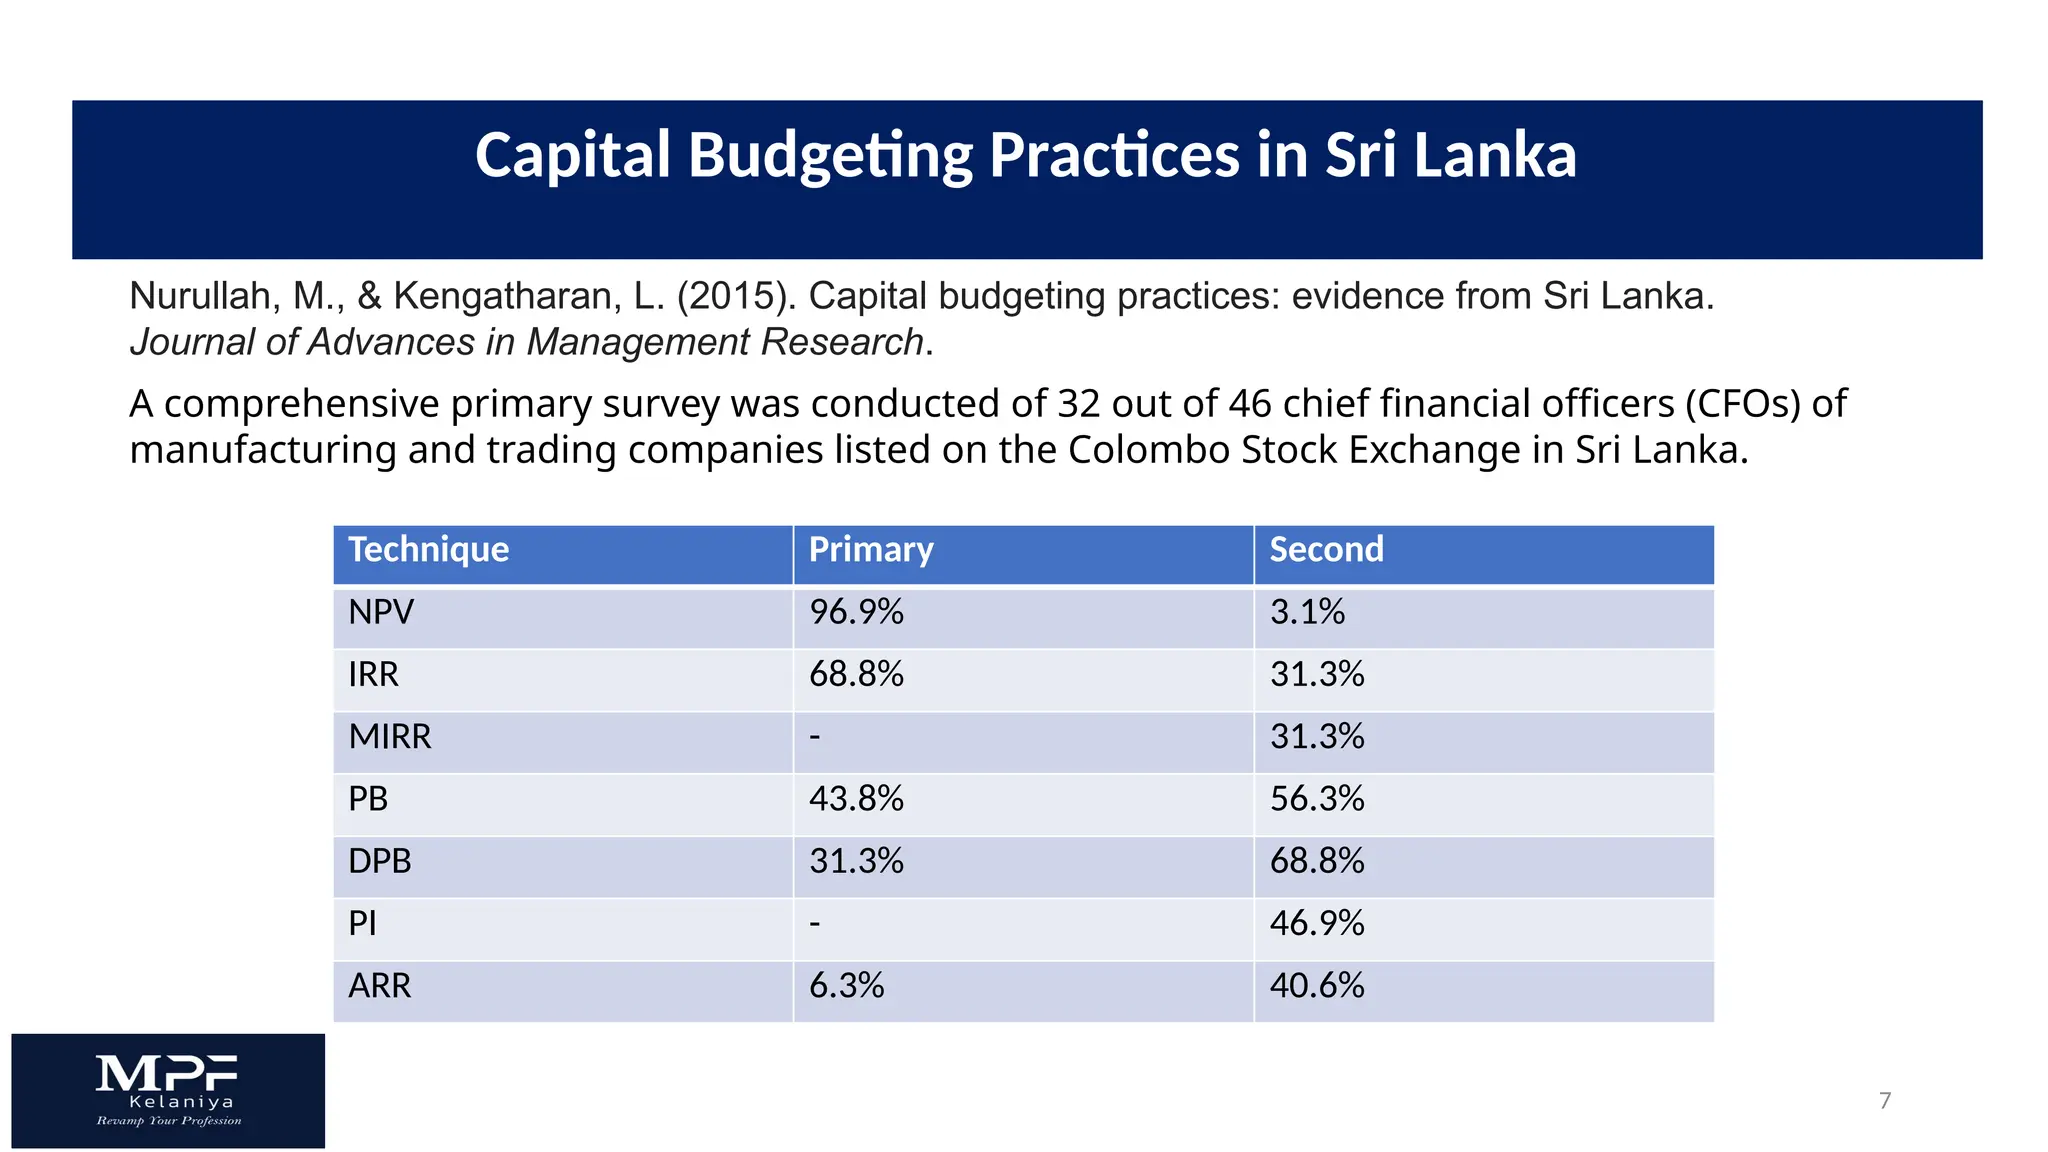
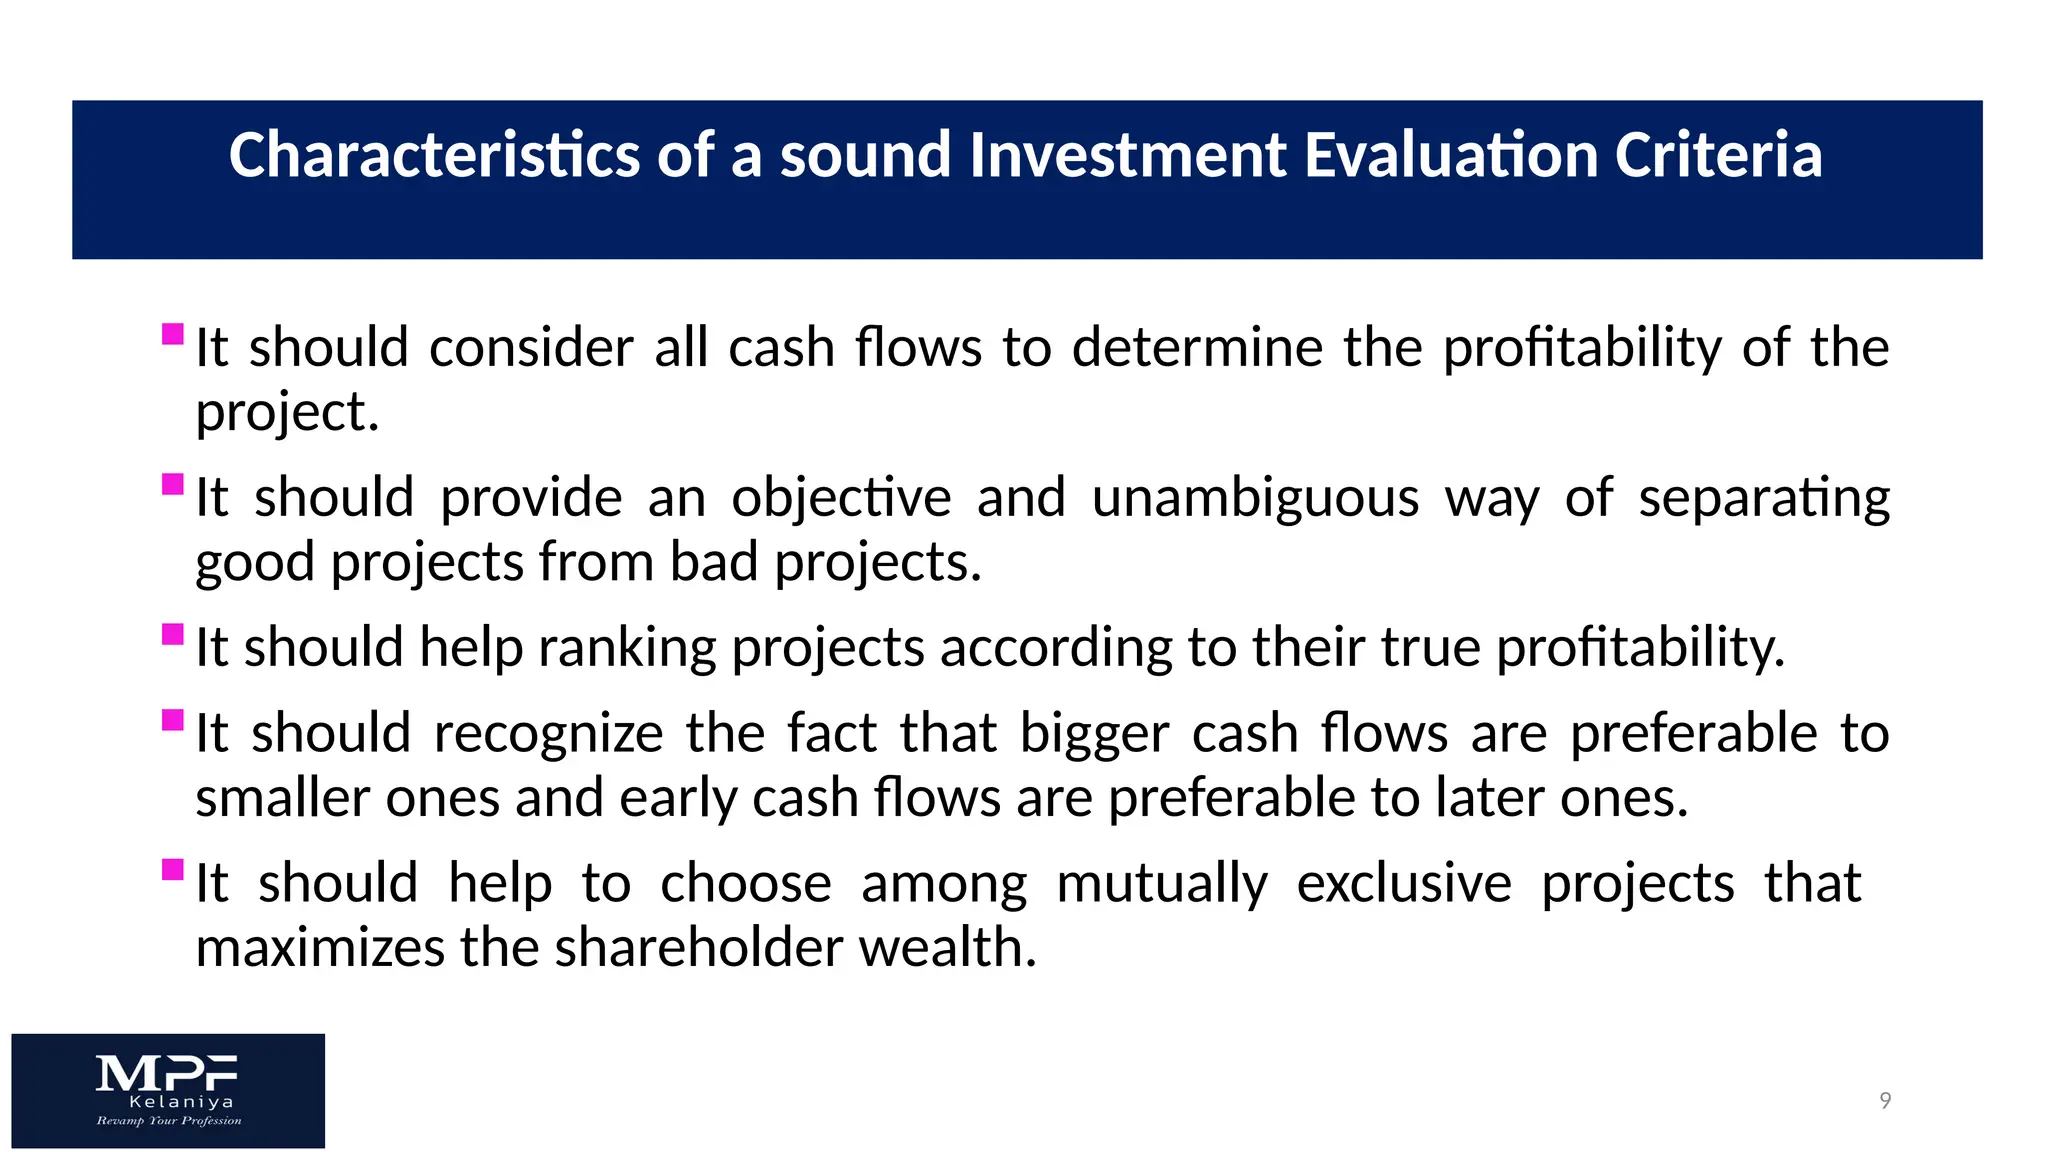
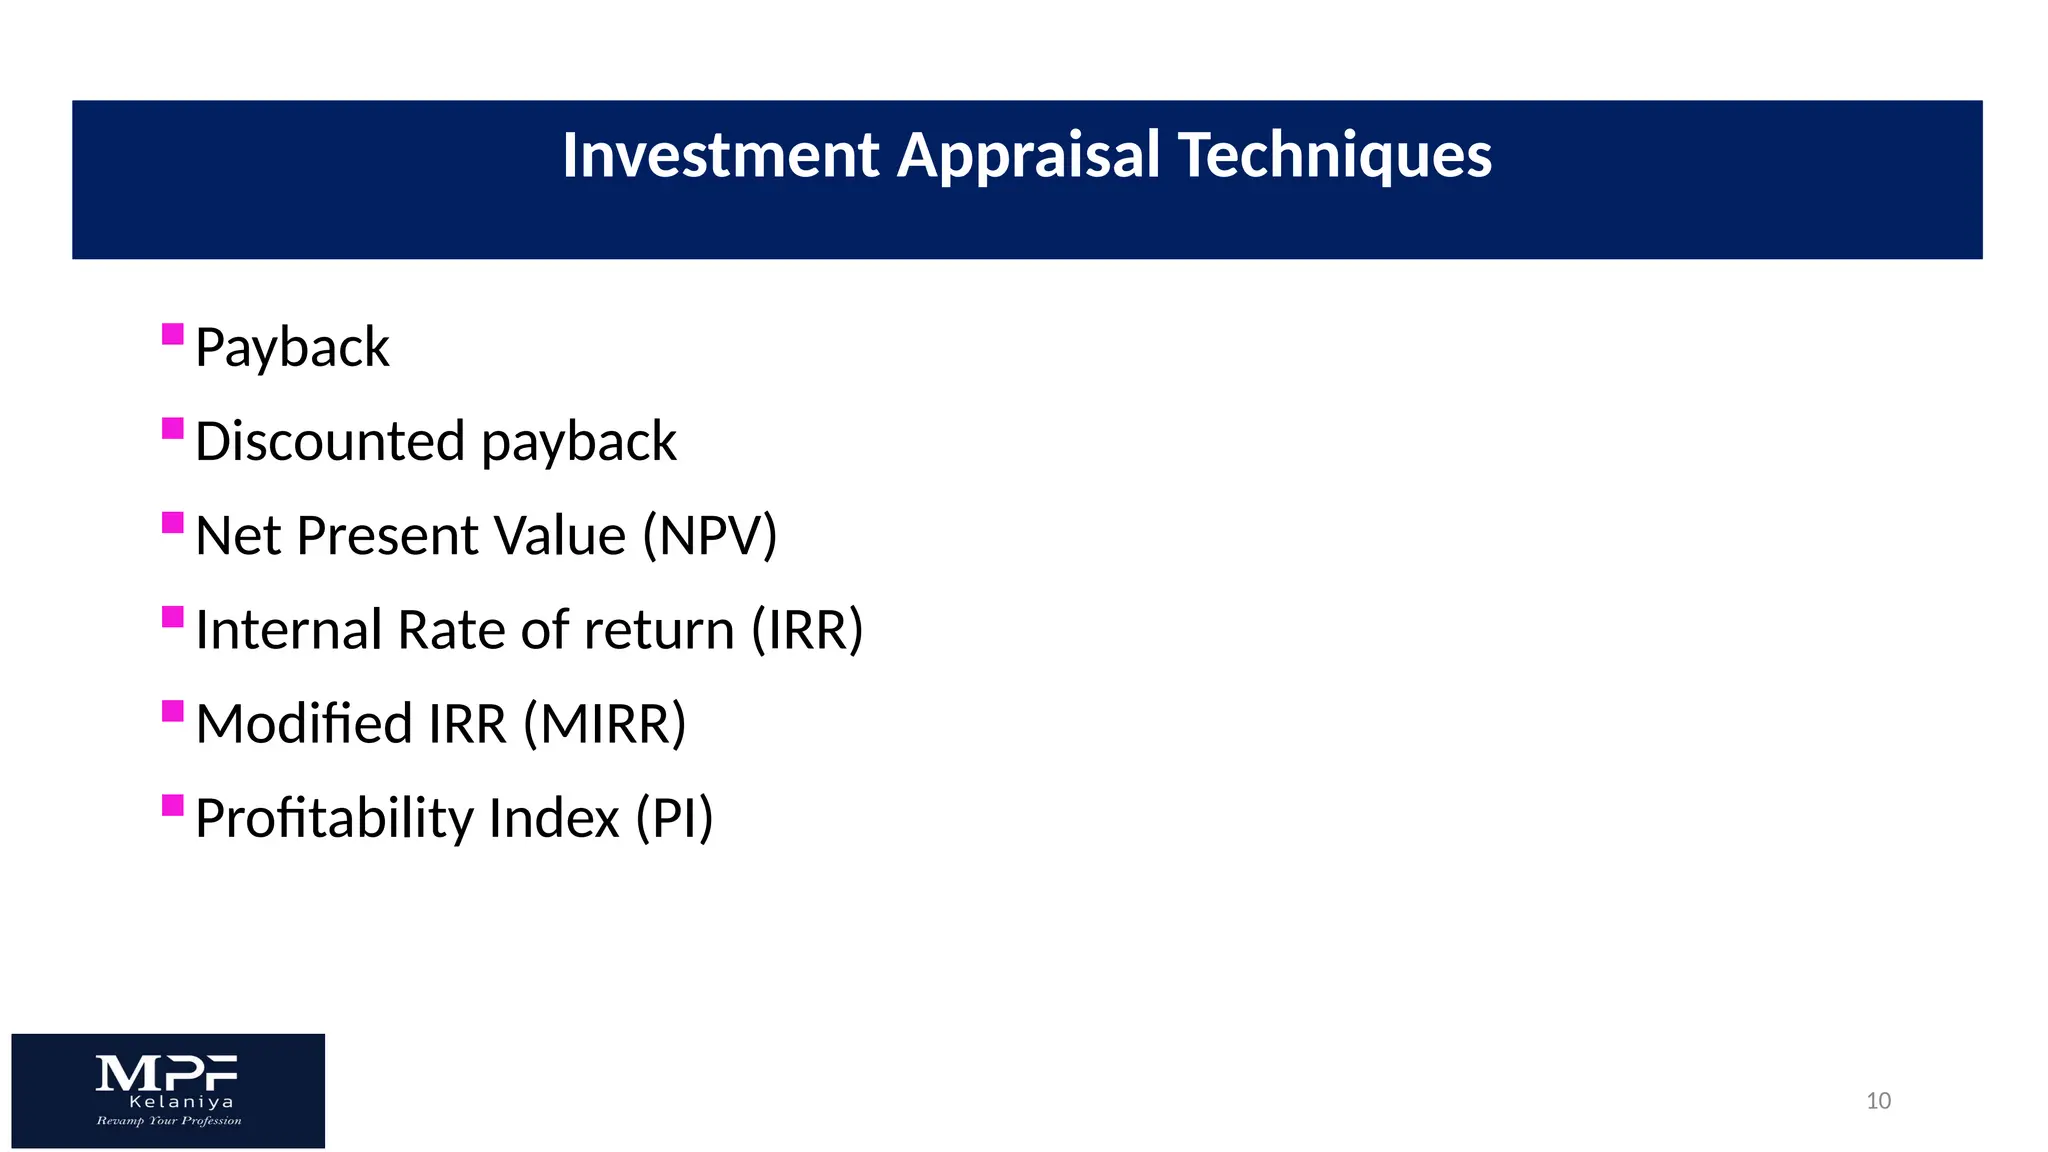
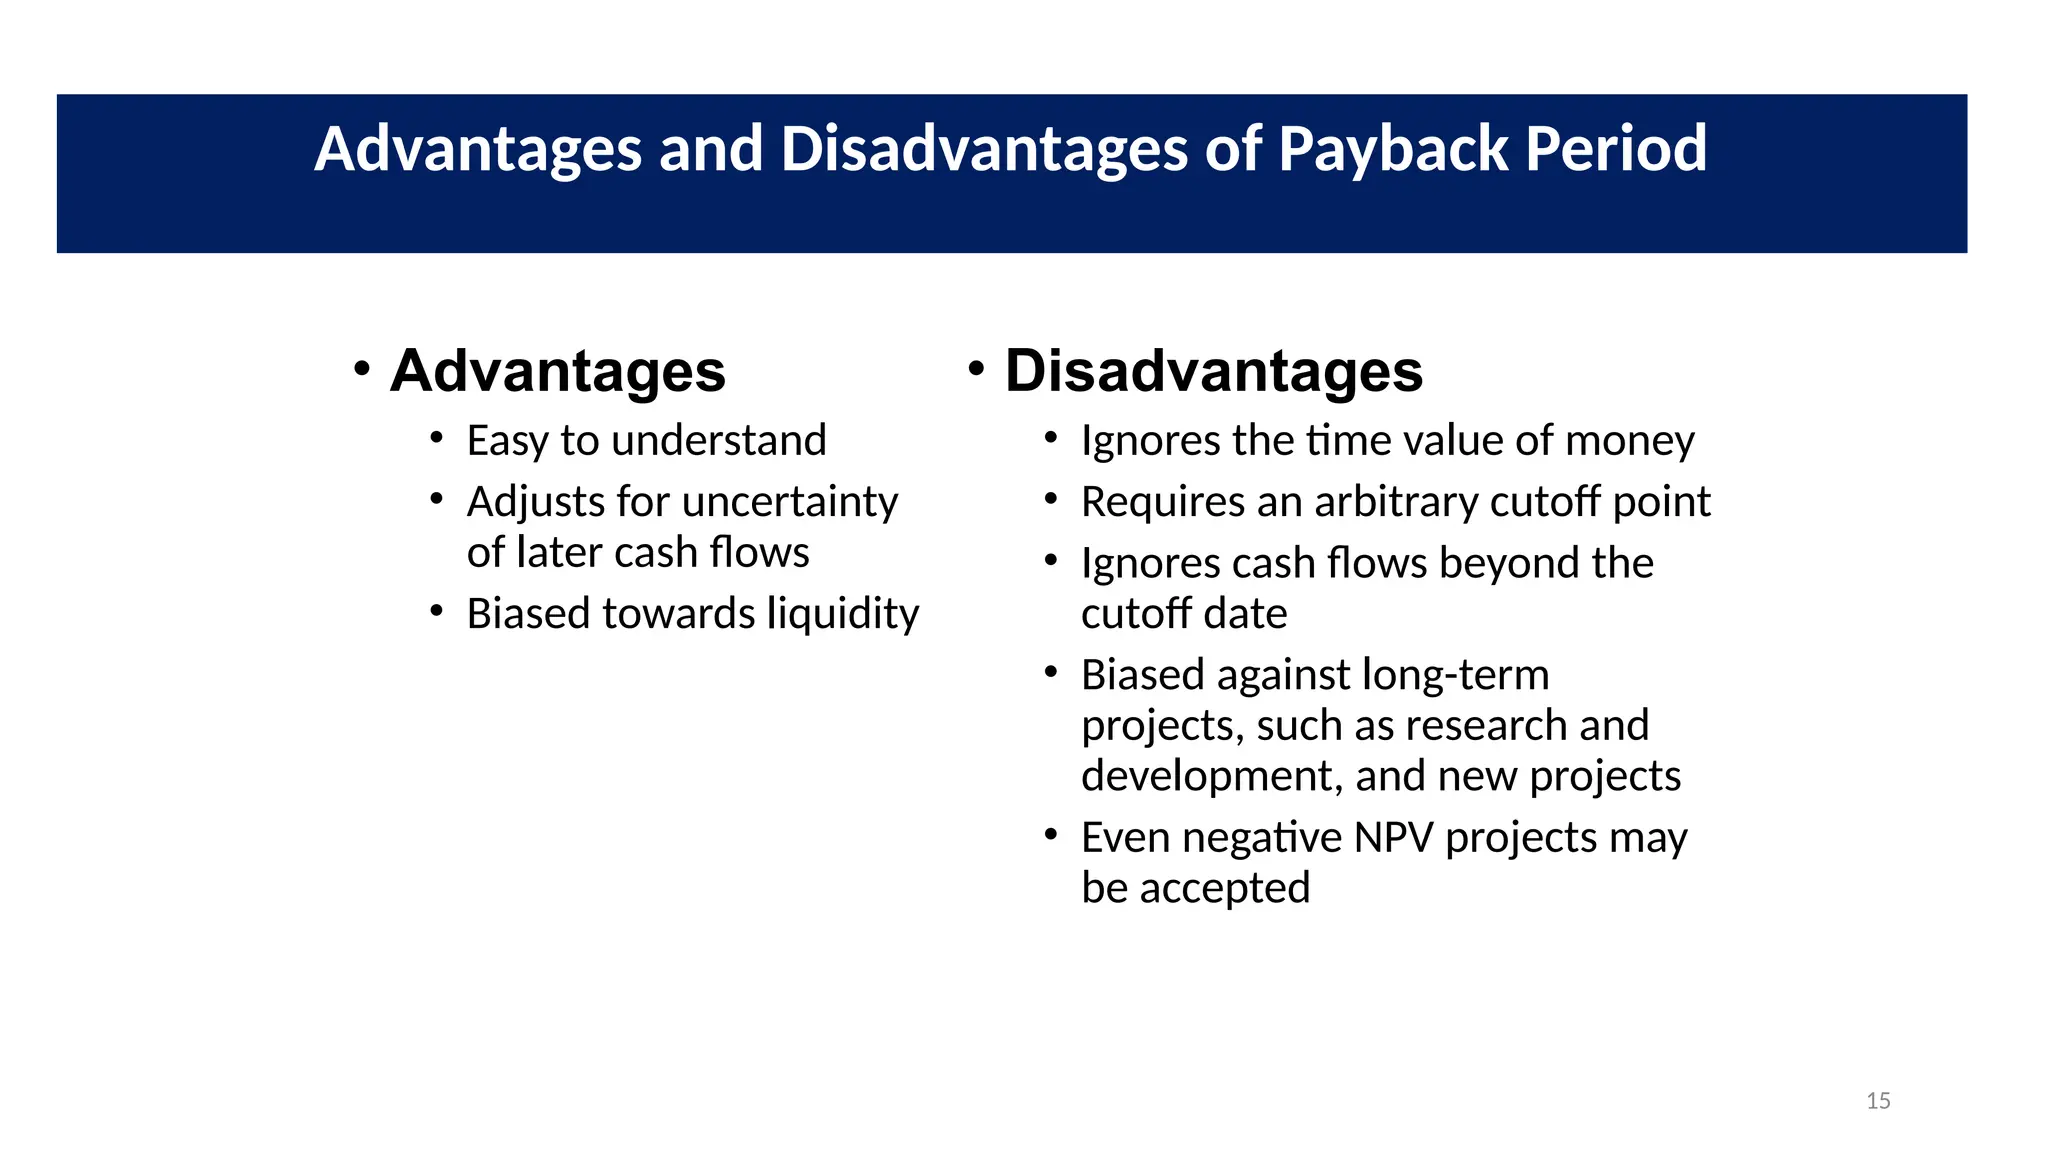
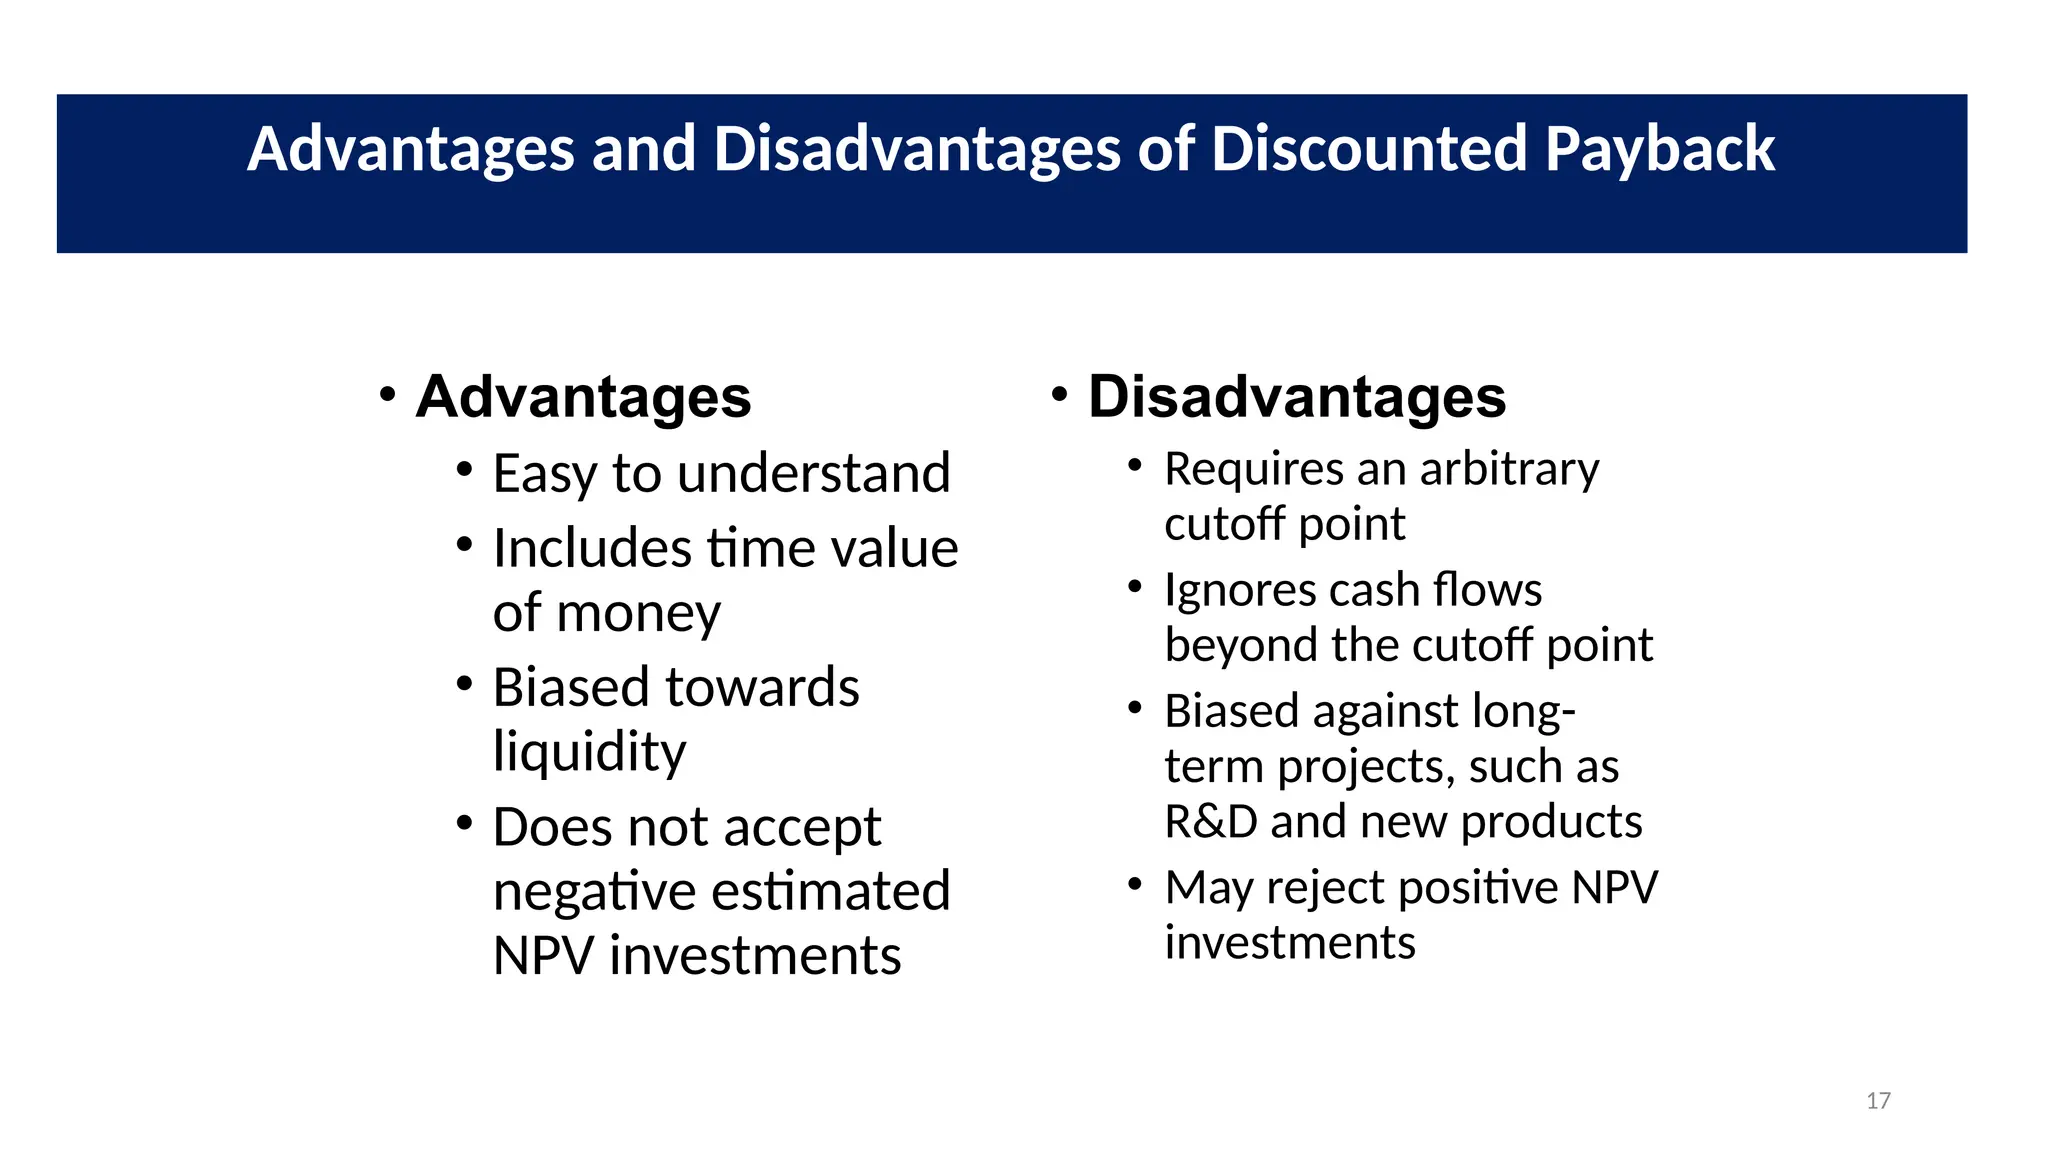
University of Kelaniya, Sri Lanka
Capital Budgeting Techniques
Corporate Finance
Master of Professional Finance
University of Kelaniya
2
Findings;
All but two respondents indicated use of at least one of these Capital Budgeting
Technique’s (CBT) and almost 86% of the firms use more than one of the CBT's, with
17% using all four. The most popular CBT is PBK (used by 74% of the respondents),
but only 2% use it as the only CBT. ARR is used by 58% (4% as the only CBT), IRR by
65% (6% as the only CBT), and NPV by 56% (2% as the only CBT). Over 86% of the
respondents use either IRR or NPV or both, but only 16% use one or both without
also using PBK or ARR.
Schall, L. D., Sundem, G. L., & Geijsbeek, W. R. (1978). Survey and analysis of capital budgeting
methods. The journal of finance, 33(1), 281-287.
Capital Budgeting Practices in the USA
3
Technique Always or often (%)
NPV 85.1%
IRR 76.7%
PB 52.6%
DPB 37.6%
PI 21.4%
ARR 14.7%
MIRR 9.3%
• Sample: Chief Financial Officers of 120 compares from Fortune 1000
Ryan, P. A., & Ryan, G. P. (2002). Capital budgeting practices of the Fortune 1000: how have things
changed. Journal of business and management, 8(4), 355-364.
Capital Budgeting Practices in Fortune 100 Companies
4
• Number of sample 87
Technique Number of
Companies
Responses%
NPV 82 94
PB 79 91
IRR 70 80
ARR 50 57
Adjusted NPV 47 54
Other techniques 11 13
Truong, G., Partington, G., & Peat, M. (2008). Cost-of-capital estimation and capital-budgeting practice in
Australia. Australian journal of management, 33(1), 95-121.
Capital Budgeting Practices in Australia
5
• Yamato (1998), Theory of Management on strategic investment
Decision.
Techninque %
NPV 18.8
IRR 25.3
PB 81
ARR 43.5
Capital Budgeting Practices in Japan
6
• Leon, F. M., Isa, M., & Kester, G. W. (2008). Capital budgeting practices of listed
Indonesian companies. AJBA, 1(2), 175-192.
• A survey of executives of companies listed on the Jakarta Stock Exchange (108 SAMPLE)
Technique Percent
NPV 63.6%
IRR 63.6%
PB 86.4%
PI 42.1%
ARR 40.9%
Capital Budgeting Practices in Indonesia
7
Technique Primary Second
NPV 96.9% 3.1%
IRR 68.8% 31.3%
MIRR - 31.3%
PB 43.8% 56.3%
DPB 31.3% 68.8%
PI - 46.9%
ARR 6.3% 40.6%
Nurullah, M., & Kengatharan, L. (2015). Capital budgeting practices: evidence from Sri Lanka.
Journal of Advances in Management Research.
A comprehensive primary survey was conducted of 32 out of 46 chief financial officers (CFOs) of
manufacturing and trading companies listed on the Colombo Stock Exchange in Sri Lanka.
Capital Budgeting Practices in Sri Lanka
8
Cost of the project must be defined
Cost
Estimate the expected cash flows from the project
Estimate
Determine the cost of capital at which the cash flows shall be
discounted
Determine
Compare the PV of cash inflows with cash outflows.
Compare
Steps in Project Evaluation
9
It should consider all cash flows to determine the profitability of the
project.
It should provide an objective and unambiguous way of separating
good projects from bad projects.
It should help ranking projects according to their true profitability.
It should recognize the fact that bigger cash flows are preferable to
smaller ones and early cash flows are preferable to later ones.
It should help to choose among mutually exclusive projects that
maximizes the shareholder wealth.
Characteristics of a sound Investment Evaluation Criteria
10
Payback
Discounted payback
Net Present Value (NPV)
Internal Rate of return (IRR)
Modified IRR (MIRR)
Profitability Index (PI)
Investment Appraisal Techniques
11
Projects are:
mutually exclusive,
 If you choose one, you can’t choose the other
 Example: You can choose to attend graduate school at either Harvard or
Stanford, but not both
independent, otherwise.
How does independent projects differ from mutually exclusive
projects?
12
• The number of years required
to recover a project’s cost,
or
• How long does it take to get
the business’s money back?
Year Cash flow
Project L Project S
0 -100 -100
1 10 70
2 60 50
3 80 20
Payback Period Method
13
10 80
60
0 1 2 3
-100
=
CFt
Cumulative -100 -90 -30 50
PaybackL 2 + 30/80 = 2.375 years
0
100
2.4
Payback Period for Project L
14
70 20
50
0 1 2 3
-100
CFt
Cumulative -100 -30 20 40
PaybackS 1 + 30/50 = 1.6 years
100
0
1.6
=
Payback Period for Project S
15
• Advantages
• Easy to understand
• Adjusts for uncertainty
of later cash flows
• Biased towards liquidity
• Disadvantages
• Ignores the time value of money
• Requires an arbitrary cutoff point
• Ignores cash flows beyond the
cutoff date
• Biased against long-term
projects, such as research and
development, and new projects
• Even negative NPV projects may
be accepted
Advantages and Disadvantages of Payback Period
16
10 80
60
0 1 2 3
CFt
Cumulative -100 -90.91 -41.32 18.79
Discounted
payback 2 + 41.32/60.11 = 2.7 yrs
PVCF0 -100
-100
10%
9.09 49.59 60.11
=
Recover invest. + cap. costs in 2.7 yrs.
Discounted Payback: Uses discounted rather than raw CFs. (Ex.
Project L)
17
• Advantages
• Easy to understand
• Includes time value
of money
• Biased towards
liquidity
• Does not accept
negative estimated
NPV investments
• Disadvantages
• Requires an arbitrary
cutoff point
• Ignores cash flows
beyond the cutoff point
• Biased against long-
term projects, such as
R&D and new products
• May reject positive NPV
investments
Advantages and Disadvantages of Discounted Payback
18
• It is the present value of future cash flows, discounted at the cost of capital.
• Output: How much values created from undertaking an investment.
• Steps
1. estimate the expected cash flows
2. Estimate the required return for projects of this risk level
3. Compute the net present value
Net Present Value: NPV
19
NPV: Sum of PVs of inflows and outflows.
 
.
1
0
t
t
n
t r
CF
NPV



 
.
1
0
1
CF
r
CF
NPV t
t
n
t




Cost often is CF0 and is negative.
20
10 80
60
0 1 2 3
10%
Project L:
-100.00
9.09
49.59
60.11
18.79 = NPVL
What is project’s NPV
21
….. …..
…..
0 1 2 3
10%
Project S:
......
………= NPVS NPVL = $18.79.
What is project’s NPV
22
• A positive NPV means that the project is expected to
add value to the firm and will therefore increase the
wealth of the owners.
• Since our goal is to increase owner’s wealth, NPV is a
direct measure of how well this project will meet our
goal.
NPV Decision Rule
23
• NPVL = 18.79$, NPVS = 19.98$
• If Project S and L are mutually exclusive, accept S
because NPVs > NPVL
• If S & L are independent, accept both; NPV > 0.
NPV Decision Rule
24
IRR is the discount rate that forces “PV inflows = cost”.
This is the same as forcing NPV = 0.
0
CF 1
CF 2
CF 3
CF
0 1 2 3
 
.
0
1
0




t
t
n
t IRR
CF
Internal Rate of Return: IRR
25
10 80
60
0 1 2 3
IRR%
Project L:
-100.00
PV1
PV2
PV3
0 = NPVL
Method: Trial and error.
What’s project L’s IRR
26
 
r
NPV
NPV
NPV
NPV
r
IRR 






 *
)
(
IRRL = 18.13%. IRRS = 23.56%.
IRR Methods – Trial and Error Method
27
Accept the project if the IRR is greater than the cost of capital.
If IRR>WACC, then the project’s rate of return is greater than its
cost. Some return is left over to boost stockholders’ returns.
EX. If IRR=12%> WACC = 10, project is profitable.
Decisions Rule on IRR Method
28
• IRRL = 18.13%, IRRS = 23.56%.
• If S and L are independent, accept both.
IRRs > required r = 10%.
• If S and L are mutually exclusive, accept S
because IRRS > IRRL .
Decisions on Project S and L according to IRR
29
• XY Ltd purchased a special machine 1 year ago at a cost of Rs. 12,000,000. at that
time the machine was estimated to have a useful life of 6 years and no salvage
value. The annual cash operating cost is approximately Rs. 20,000,000. A new
machine has just come on the market which will do the same job but with an
annual cash operating cost of only Rs. 17,000,000. this new machine costs Rs.
21,000,000 and has an estimated life of five years with zero salvage value. The old
machine can be sold for Rs. 10,000,000 to a scrap dealer. Straight-line depreciation
is used, and the company’s income tax rate is 40 percent.
Assuming a cost of capital of 8 percent after tax, calculate: (a) the initial investment;
(b) the incremental cash flow after taxes; (c ) the NPV of the new investment and
(d) the IRR on the new investment.
Example:
30
NPV profile: Find NPVL and
NPVS at different discount rates:
r NPVL NPVS
0 50 40
5 $31.48 $27.90
10 $17.08 $18.17
15 $5.80 $10.28
20 ($3.09) $3.86
25 ($10.11) ($1.41)
Compare NPV and IRR
31
NPV ($)
-10
0
10
20
30
40
50
60
0 5 10 15 20 23.6
Crossover
Point = 8.7%
IRRS = 23.6%
IRRL = 18.1%
Discount Rate (%)
Compare NPV and IRR
32
r < 8.7: NPVL> NPVS , IRRS > IRRL
CONFLICT
r > 8.7: NPVS> NPVL , IRRS > IRRL
NO CONFLICT
For Mutually Exclusive Projects
33
• Find cash flow differences between the projects ( better to have first
cash flow negative).
• Find the IRR for this new stream of differential cash that is the cross-
over rate.
How to Compute the Cross-over Point
34
• NPV assumes that cash flows can be reinvested at r (opportunity cost of capital).
• IRR assumes that cash flows are reinvested at IRR.
• Which assumption is better?
• Reinvest at opportunity cost, r, is more realistic, so NPV method is best. NPV
should be used to choose between mutually exclusive projects.
Reinvestment Assumption to solve the conflict
35
Project
A
Project
B
0 -500 -400
1 325 325
2 325 200
IRR …….. …….
NPV …….. …….
The required return for
both projects is 10%
Which Project should
you accept and why ?
Example with Mutually Exclusive Projects
36
Normal projects have cost (negative CF) followed by a series of positive cash
inflows. One change of signs.
Non-normal projects have Two or more changes of signs.
Most common: Cost (negative CF), then string of positive CFs, then cost to close
project. Nuclear power plant, strip mine.
Normal and Non-normal Cash Flow Projects
37
0 1 2 3 4 5 N NN
- + + + + + N
- + + + + - NN
- - - + + + N
+ + + - - - N
- + + - + - NN
Normal and Non-normal Cash Flow Projects
38
Normal projects have single IRR.
Non normal projects have multiple IRR.
5,000 -5,000
0 1 2
r = 10%
-800
Why Multiple IRR?
39
1. At very low discount rates, the PV of CF2 is large &
negative, so NPV < 0.
2. At very high discount rates, the PV of both CF1 and
CF2 are low, so CF0 dominates and again NPV < 0.
3. In between, the discount rate hits CF2 harder than
CF1, so NPV > 0.
4. Result: 2 IRRs.
Why Multiple IRR?
40
NPV Profile
450
-800
0
400
100
IRR2 = 400%
IRR1 = 25%
r
NPV
Why Multiple IRR?
41
MIRR is the discount rate which causes the PV
of a project’s terminal value (TV) to equal the PV
of costs.
TV is found by compounding inflows at WACC.
Thus,
MIRR assumes cash inflows are reinvested at
WACC.
When there are nonnormal CFs and more than one IRR, use MIRR
42
PV outflows @ 10% = -800 - 4,132.23=-4932.23.
TV inflows @ 10% = 5,500,00.
MIRR = 5500 / (1+MIRR)^2 = 4932.23
MIRR = 5.59% < r = 10%. Therefore, reject the project
Also, if MIRR < r, NPV will be negative: NPV = -$351.
When there are nonnormal CFs and more than one IRR, use MIRR
43
MIRR correctly assumes reinvestment at opportunity cost =
WACC. MIRR also avoids the problem of multiple IRRs.
Managers like rate of return comparisons, and therefore MIRR
is better than IRR.
Why MIRR is preferred to IRR ?
44
Example: Mutually Exclusive Investments
• The Wan-Ki Manufacturing company must decide between investment projects A and B, which
are mutually exclusive. The data on these projects are as follows (in thousands rupees):
• Based on these cash flows: (a) calculate the projects’ NPV and IRR. (Assume that the firm’s cost of
capital after taxes is 10%). (b) which of the two projects would be chosen according to the IRR
criterion ?. ( c) How can you explain the differences in rankings given by the NPV and IRR methods
in this case ?
Cash Flows Per Year
Project 0 1 2 3 4
A (12000) 5000 5000 5000 5000
B (12000) 25000
45
• The PI shows the relative profitability of any project, or
• The present value per dollar of the initial cost.
• PI = PV of future cash flows / Initial cost
• A project is acceptable if its PI is greater than 1.
• PIL = 118.79 / 100 = 1.1879
• PIS = 119.98 / 100 = 1.1998
Profitability Index (PI)
46
Rand corporation is considering five different investment opportunities. The company’s cost of
capital is 12 percent. Data on these opportunities under consideration are given below.
Based on the above data: (a) rank these five projects in the descending order of preference,
according to NPV, IRR and PI. (b) based on your ranking, which projects would you select if Rs.
55000 is the limit to be spent. ( all the figures are in Rs. 000)
Project Investment DCF @12% NPV IRR% PI
1 35000 39325 4325 16 1.12
2 20000 22930 2930 15 1.15
3 25000 27453 2453 14 1.10
4 10000 10854 854 18 1.09
5 9000 8749 -251 11 0.97
Capital Rationing
09/02/2024 Investment Decision 47
1. WACC/Ke Vs Project Specific Discounting Factor
Question is should the business organization use it’s WACC/Ke for all projects undertaken or should they change
the discounting factor? It depends on the operating and financial risk of the project.
2. Changes in Working Capital Requirement
The project evaluation should consider not only the fixed capital requirement but also the working capital
requirement of the project. It should consider the change in working capital requirement as a cash outflow. At
the end of the project, it is assumed to recover the working capital investment.
Special Cases in Investment Decision
09/02/2024 Investment Decision 48
3. Changes in DF during a project period
Changes in the discount factor can be incorporated into the NPV calculation over time for following
reasons;
• If the level of interest rate changes in the economy
• If the risk characteristics of the project's changes
• If the finance mix of the project may vary with over time
4. Nominal Cash Flows Vs Real Cash Flows
If the nominal cash flows of the project is been calculated for the evaluation, a nominal rate of
discounting factor should be used. Thus, if the real cash flows of the project is been calculated for
the evaluation, a real rate of discounting factor should be used.
(1+NR) = (1+RR) * (1+ IR)
09/02/2024 Investment Decision 49
5. After Tax Cash Flows Vs Pre Tax Cash Flows
If the after tax cash flows of the project is been calculated for the evaluation, an after tax
discounting factor should be used. Thus, if the pre-tax cash flows of the project is been calculated
for the evaluation, a pre-tax discounting factor should be used.
09/02/2024 Investment Decision 50
6. Mutually Exclusive Projects with Different Lives
When two projects are mutually exclusive, the firm may choose one project or the other, but not both. If
mutually exclusive projects have different lives, and the projects are expected to be replaced indefinitely as
they wear out, an adjustment needs to be made in the decision-making process. There are two procedures to
make this adjustment:
1. Least common multiple of lives approach.
2. Equivalent Annual Annuity (EAA) approach.
Where:
r : Project discount rate (WACC)
NPV : Net present value of project cash flows
n : project life (in years)
51
Thank You

Capital budgeting techniques For Analysis.......

  • 1.
    University of Kelaniya,Sri Lanka Capital Budgeting Techniques Corporate Finance Master of Professional Finance University of Kelaniya
  • 2.
    2 Findings; All but tworespondents indicated use of at least one of these Capital Budgeting Technique’s (CBT) and almost 86% of the firms use more than one of the CBT's, with 17% using all four. The most popular CBT is PBK (used by 74% of the respondents), but only 2% use it as the only CBT. ARR is used by 58% (4% as the only CBT), IRR by 65% (6% as the only CBT), and NPV by 56% (2% as the only CBT). Over 86% of the respondents use either IRR or NPV or both, but only 16% use one or both without also using PBK or ARR. Schall, L. D., Sundem, G. L., & Geijsbeek, W. R. (1978). Survey and analysis of capital budgeting methods. The journal of finance, 33(1), 281-287. Capital Budgeting Practices in the USA
  • 3.
    3 Technique Always oroften (%) NPV 85.1% IRR 76.7% PB 52.6% DPB 37.6% PI 21.4% ARR 14.7% MIRR 9.3% • Sample: Chief Financial Officers of 120 compares from Fortune 1000 Ryan, P. A., & Ryan, G. P. (2002). Capital budgeting practices of the Fortune 1000: how have things changed. Journal of business and management, 8(4), 355-364. Capital Budgeting Practices in Fortune 100 Companies
  • 4.
    4 • Number ofsample 87 Technique Number of Companies Responses% NPV 82 94 PB 79 91 IRR 70 80 ARR 50 57 Adjusted NPV 47 54 Other techniques 11 13 Truong, G., Partington, G., & Peat, M. (2008). Cost-of-capital estimation and capital-budgeting practice in Australia. Australian journal of management, 33(1), 95-121. Capital Budgeting Practices in Australia
  • 5.
    5 • Yamato (1998),Theory of Management on strategic investment Decision. Techninque % NPV 18.8 IRR 25.3 PB 81 ARR 43.5 Capital Budgeting Practices in Japan
  • 6.
    6 • Leon, F.M., Isa, M., & Kester, G. W. (2008). Capital budgeting practices of listed Indonesian companies. AJBA, 1(2), 175-192. • A survey of executives of companies listed on the Jakarta Stock Exchange (108 SAMPLE) Technique Percent NPV 63.6% IRR 63.6% PB 86.4% PI 42.1% ARR 40.9% Capital Budgeting Practices in Indonesia
  • 7.
    7 Technique Primary Second NPV96.9% 3.1% IRR 68.8% 31.3% MIRR - 31.3% PB 43.8% 56.3% DPB 31.3% 68.8% PI - 46.9% ARR 6.3% 40.6% Nurullah, M., & Kengatharan, L. (2015). Capital budgeting practices: evidence from Sri Lanka. Journal of Advances in Management Research. A comprehensive primary survey was conducted of 32 out of 46 chief financial officers (CFOs) of manufacturing and trading companies listed on the Colombo Stock Exchange in Sri Lanka. Capital Budgeting Practices in Sri Lanka
  • 8.
    8 Cost of theproject must be defined Cost Estimate the expected cash flows from the project Estimate Determine the cost of capital at which the cash flows shall be discounted Determine Compare the PV of cash inflows with cash outflows. Compare Steps in Project Evaluation
  • 9.
    9 It should considerall cash flows to determine the profitability of the project. It should provide an objective and unambiguous way of separating good projects from bad projects. It should help ranking projects according to their true profitability. It should recognize the fact that bigger cash flows are preferable to smaller ones and early cash flows are preferable to later ones. It should help to choose among mutually exclusive projects that maximizes the shareholder wealth. Characteristics of a sound Investment Evaluation Criteria
  • 10.
    10 Payback Discounted payback Net PresentValue (NPV) Internal Rate of return (IRR) Modified IRR (MIRR) Profitability Index (PI) Investment Appraisal Techniques
  • 11.
    11 Projects are: mutually exclusive, If you choose one, you can’t choose the other  Example: You can choose to attend graduate school at either Harvard or Stanford, but not both independent, otherwise. How does independent projects differ from mutually exclusive projects?
  • 12.
    12 • The numberof years required to recover a project’s cost, or • How long does it take to get the business’s money back? Year Cash flow Project L Project S 0 -100 -100 1 10 70 2 60 50 3 80 20 Payback Period Method
  • 13.
    13 10 80 60 0 12 3 -100 = CFt Cumulative -100 -90 -30 50 PaybackL 2 + 30/80 = 2.375 years 0 100 2.4 Payback Period for Project L
  • 14.
    14 70 20 50 0 12 3 -100 CFt Cumulative -100 -30 20 40 PaybackS 1 + 30/50 = 1.6 years 100 0 1.6 = Payback Period for Project S
  • 15.
    15 • Advantages • Easyto understand • Adjusts for uncertainty of later cash flows • Biased towards liquidity • Disadvantages • Ignores the time value of money • Requires an arbitrary cutoff point • Ignores cash flows beyond the cutoff date • Biased against long-term projects, such as research and development, and new projects • Even negative NPV projects may be accepted Advantages and Disadvantages of Payback Period
  • 16.
    16 10 80 60 0 12 3 CFt Cumulative -100 -90.91 -41.32 18.79 Discounted payback 2 + 41.32/60.11 = 2.7 yrs PVCF0 -100 -100 10% 9.09 49.59 60.11 = Recover invest. + cap. costs in 2.7 yrs. Discounted Payback: Uses discounted rather than raw CFs. (Ex. Project L)
  • 17.
    17 • Advantages • Easyto understand • Includes time value of money • Biased towards liquidity • Does not accept negative estimated NPV investments • Disadvantages • Requires an arbitrary cutoff point • Ignores cash flows beyond the cutoff point • Biased against long- term projects, such as R&D and new products • May reject positive NPV investments Advantages and Disadvantages of Discounted Payback
  • 18.
    18 • It isthe present value of future cash flows, discounted at the cost of capital. • Output: How much values created from undertaking an investment. • Steps 1. estimate the expected cash flows 2. Estimate the required return for projects of this risk level 3. Compute the net present value Net Present Value: NPV
  • 19.
    19 NPV: Sum ofPVs of inflows and outflows.   . 1 0 t t n t r CF NPV      . 1 0 1 CF r CF NPV t t n t     Cost often is CF0 and is negative.
  • 20.
    20 10 80 60 0 12 3 10% Project L: -100.00 9.09 49.59 60.11 18.79 = NPVL What is project’s NPV
  • 21.
    21 ….. ….. ….. 0 12 3 10% Project S: ...... ………= NPVS NPVL = $18.79. What is project’s NPV
  • 22.
    22 • A positiveNPV means that the project is expected to add value to the firm and will therefore increase the wealth of the owners. • Since our goal is to increase owner’s wealth, NPV is a direct measure of how well this project will meet our goal. NPV Decision Rule
  • 23.
    23 • NPVL =18.79$, NPVS = 19.98$ • If Project S and L are mutually exclusive, accept S because NPVs > NPVL • If S & L are independent, accept both; NPV > 0. NPV Decision Rule
  • 24.
    24 IRR is thediscount rate that forces “PV inflows = cost”. This is the same as forcing NPV = 0. 0 CF 1 CF 2 CF 3 CF 0 1 2 3   . 0 1 0     t t n t IRR CF Internal Rate of Return: IRR
  • 25.
    25 10 80 60 0 12 3 IRR% Project L: -100.00 PV1 PV2 PV3 0 = NPVL Method: Trial and error. What’s project L’s IRR
  • 26.
    26   r NPV NPV NPV NPV r IRR        * ) ( IRRL = 18.13%. IRRS = 23.56%. IRR Methods – Trial and Error Method
  • 27.
    27 Accept the projectif the IRR is greater than the cost of capital. If IRR>WACC, then the project’s rate of return is greater than its cost. Some return is left over to boost stockholders’ returns. EX. If IRR=12%> WACC = 10, project is profitable. Decisions Rule on IRR Method
  • 28.
    28 • IRRL =18.13%, IRRS = 23.56%. • If S and L are independent, accept both. IRRs > required r = 10%. • If S and L are mutually exclusive, accept S because IRRS > IRRL . Decisions on Project S and L according to IRR
  • 29.
    29 • XY Ltdpurchased a special machine 1 year ago at a cost of Rs. 12,000,000. at that time the machine was estimated to have a useful life of 6 years and no salvage value. The annual cash operating cost is approximately Rs. 20,000,000. A new machine has just come on the market which will do the same job but with an annual cash operating cost of only Rs. 17,000,000. this new machine costs Rs. 21,000,000 and has an estimated life of five years with zero salvage value. The old machine can be sold for Rs. 10,000,000 to a scrap dealer. Straight-line depreciation is used, and the company’s income tax rate is 40 percent. Assuming a cost of capital of 8 percent after tax, calculate: (a) the initial investment; (b) the incremental cash flow after taxes; (c ) the NPV of the new investment and (d) the IRR on the new investment. Example:
  • 30.
    30 NPV profile: FindNPVL and NPVS at different discount rates: r NPVL NPVS 0 50 40 5 $31.48 $27.90 10 $17.08 $18.17 15 $5.80 $10.28 20 ($3.09) $3.86 25 ($10.11) ($1.41) Compare NPV and IRR
  • 31.
    31 NPV ($) -10 0 10 20 30 40 50 60 0 510 15 20 23.6 Crossover Point = 8.7% IRRS = 23.6% IRRL = 18.1% Discount Rate (%) Compare NPV and IRR
  • 32.
    32 r < 8.7:NPVL> NPVS , IRRS > IRRL CONFLICT r > 8.7: NPVS> NPVL , IRRS > IRRL NO CONFLICT For Mutually Exclusive Projects
  • 33.
    33 • Find cashflow differences between the projects ( better to have first cash flow negative). • Find the IRR for this new stream of differential cash that is the cross- over rate. How to Compute the Cross-over Point
  • 34.
    34 • NPV assumesthat cash flows can be reinvested at r (opportunity cost of capital). • IRR assumes that cash flows are reinvested at IRR. • Which assumption is better? • Reinvest at opportunity cost, r, is more realistic, so NPV method is best. NPV should be used to choose between mutually exclusive projects. Reinvestment Assumption to solve the conflict
  • 35.
    35 Project A Project B 0 -500 -400 1325 325 2 325 200 IRR …….. ……. NPV …….. ……. The required return for both projects is 10% Which Project should you accept and why ? Example with Mutually Exclusive Projects
  • 36.
    36 Normal projects havecost (negative CF) followed by a series of positive cash inflows. One change of signs. Non-normal projects have Two or more changes of signs. Most common: Cost (negative CF), then string of positive CFs, then cost to close project. Nuclear power plant, strip mine. Normal and Non-normal Cash Flow Projects
  • 37.
    37 0 1 23 4 5 N NN - + + + + + N - + + + + - NN - - - + + + N + + + - - - N - + + - + - NN Normal and Non-normal Cash Flow Projects
  • 38.
    38 Normal projects havesingle IRR. Non normal projects have multiple IRR. 5,000 -5,000 0 1 2 r = 10% -800 Why Multiple IRR?
  • 39.
    39 1. At verylow discount rates, the PV of CF2 is large & negative, so NPV < 0. 2. At very high discount rates, the PV of both CF1 and CF2 are low, so CF0 dominates and again NPV < 0. 3. In between, the discount rate hits CF2 harder than CF1, so NPV > 0. 4. Result: 2 IRRs. Why Multiple IRR?
  • 40.
    40 NPV Profile 450 -800 0 400 100 IRR2 =400% IRR1 = 25% r NPV Why Multiple IRR?
  • 41.
    41 MIRR is thediscount rate which causes the PV of a project’s terminal value (TV) to equal the PV of costs. TV is found by compounding inflows at WACC. Thus, MIRR assumes cash inflows are reinvested at WACC. When there are nonnormal CFs and more than one IRR, use MIRR
  • 42.
    42 PV outflows @10% = -800 - 4,132.23=-4932.23. TV inflows @ 10% = 5,500,00. MIRR = 5500 / (1+MIRR)^2 = 4932.23 MIRR = 5.59% < r = 10%. Therefore, reject the project Also, if MIRR < r, NPV will be negative: NPV = -$351. When there are nonnormal CFs and more than one IRR, use MIRR
  • 43.
    43 MIRR correctly assumesreinvestment at opportunity cost = WACC. MIRR also avoids the problem of multiple IRRs. Managers like rate of return comparisons, and therefore MIRR is better than IRR. Why MIRR is preferred to IRR ?
  • 44.
    44 Example: Mutually ExclusiveInvestments • The Wan-Ki Manufacturing company must decide between investment projects A and B, which are mutually exclusive. The data on these projects are as follows (in thousands rupees): • Based on these cash flows: (a) calculate the projects’ NPV and IRR. (Assume that the firm’s cost of capital after taxes is 10%). (b) which of the two projects would be chosen according to the IRR criterion ?. ( c) How can you explain the differences in rankings given by the NPV and IRR methods in this case ? Cash Flows Per Year Project 0 1 2 3 4 A (12000) 5000 5000 5000 5000 B (12000) 25000
  • 45.
    45 • The PIshows the relative profitability of any project, or • The present value per dollar of the initial cost. • PI = PV of future cash flows / Initial cost • A project is acceptable if its PI is greater than 1. • PIL = 118.79 / 100 = 1.1879 • PIS = 119.98 / 100 = 1.1998 Profitability Index (PI)
  • 46.
    46 Rand corporation isconsidering five different investment opportunities. The company’s cost of capital is 12 percent. Data on these opportunities under consideration are given below. Based on the above data: (a) rank these five projects in the descending order of preference, according to NPV, IRR and PI. (b) based on your ranking, which projects would you select if Rs. 55000 is the limit to be spent. ( all the figures are in Rs. 000) Project Investment DCF @12% NPV IRR% PI 1 35000 39325 4325 16 1.12 2 20000 22930 2930 15 1.15 3 25000 27453 2453 14 1.10 4 10000 10854 854 18 1.09 5 9000 8749 -251 11 0.97 Capital Rationing
  • 47.
    09/02/2024 Investment Decision47 1. WACC/Ke Vs Project Specific Discounting Factor Question is should the business organization use it’s WACC/Ke for all projects undertaken or should they change the discounting factor? It depends on the operating and financial risk of the project. 2. Changes in Working Capital Requirement The project evaluation should consider not only the fixed capital requirement but also the working capital requirement of the project. It should consider the change in working capital requirement as a cash outflow. At the end of the project, it is assumed to recover the working capital investment. Special Cases in Investment Decision
  • 48.
    09/02/2024 Investment Decision48 3. Changes in DF during a project period Changes in the discount factor can be incorporated into the NPV calculation over time for following reasons; • If the level of interest rate changes in the economy • If the risk characteristics of the project's changes • If the finance mix of the project may vary with over time 4. Nominal Cash Flows Vs Real Cash Flows If the nominal cash flows of the project is been calculated for the evaluation, a nominal rate of discounting factor should be used. Thus, if the real cash flows of the project is been calculated for the evaluation, a real rate of discounting factor should be used. (1+NR) = (1+RR) * (1+ IR)
  • 49.
    09/02/2024 Investment Decision49 5. After Tax Cash Flows Vs Pre Tax Cash Flows If the after tax cash flows of the project is been calculated for the evaluation, an after tax discounting factor should be used. Thus, if the pre-tax cash flows of the project is been calculated for the evaluation, a pre-tax discounting factor should be used.
  • 50.
    09/02/2024 Investment Decision50 6. Mutually Exclusive Projects with Different Lives When two projects are mutually exclusive, the firm may choose one project or the other, but not both. If mutually exclusive projects have different lives, and the projects are expected to be replaced indefinitely as they wear out, an adjustment needs to be made in the decision-making process. There are two procedures to make this adjustment: 1. Least common multiple of lives approach. 2. Equivalent Annual Annuity (EAA) approach. Where: r : Project discount rate (WACC) NPV : Net present value of project cash flows n : project life (in years)
  • 51.