2
VENU | COMPANYOVERVIEW
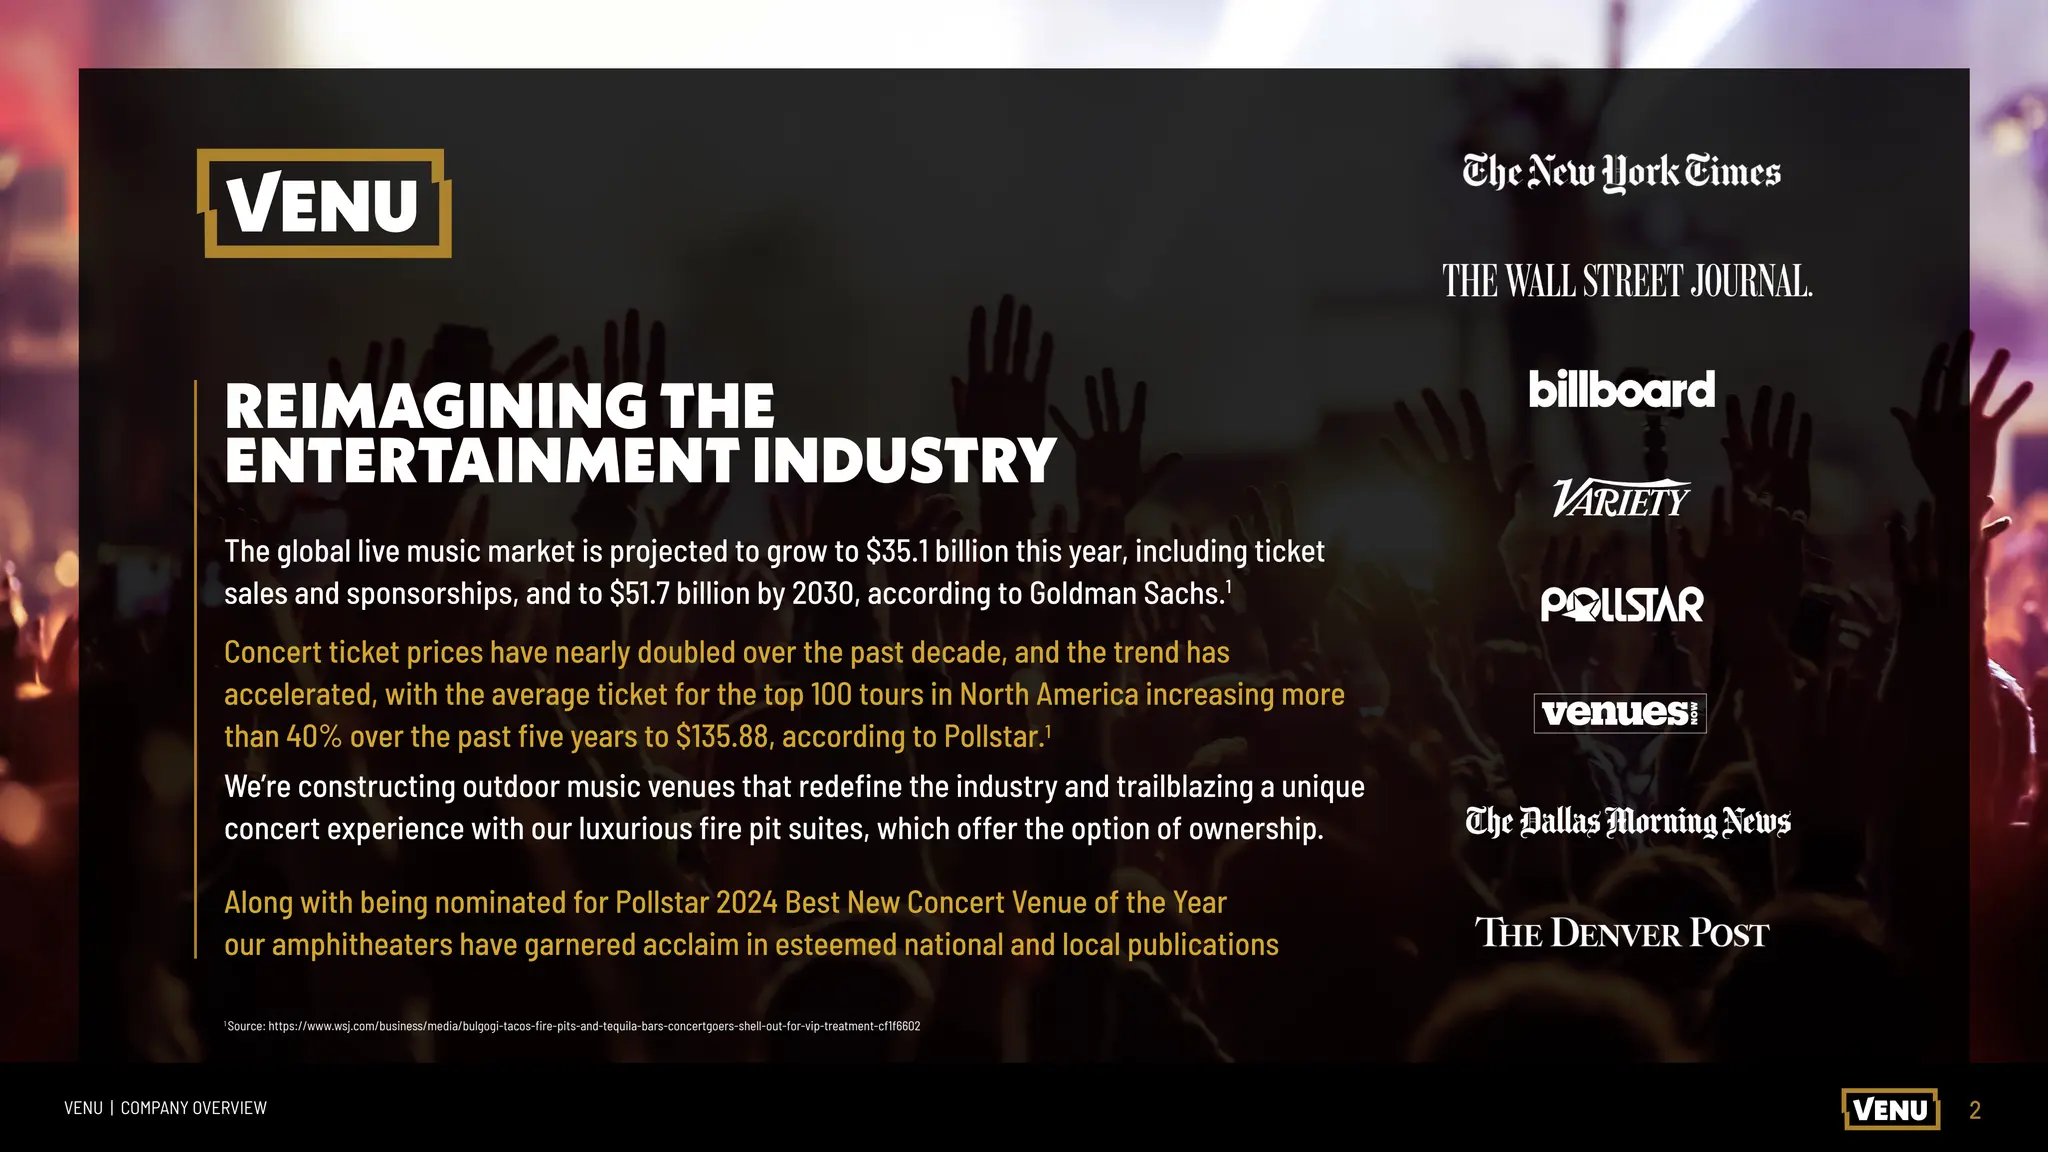
REIMAGINING THE
ENTERTAINMENT INDUSTRY
The global live music market is projected to grow to $35.1 billion this year, including ticket
sales and sponsorships, and to $51.7 billion by 2030, according to Goldman Sachs.1
Concert ticket prices have nearly doubled over the past decade, and the trend has
accelerated, with the average ticket for the top 100 tours in North America increasing more
than 40% over the past five years to $135.88, according to Pollstar.1
We’re constructing outdoor music venues that redefine the industry and trailblazing a unique
concert experience with our luxurious fire pit suites, which offer the option of ownership.
Along with being nominated for Pollstar 2024 Best New Concert Venue of the Year
our amphitheaters have garnered acclaim in esteemed national and local publications
1
Source: https://www.wsj.com/business/media/bulgogi-tacos-fire-pits-and-tequila-bars-concertgoers-shell-out-for-vip-treatment-cf1f6602
3.
3
VENU | COMPANYOVERVIEW
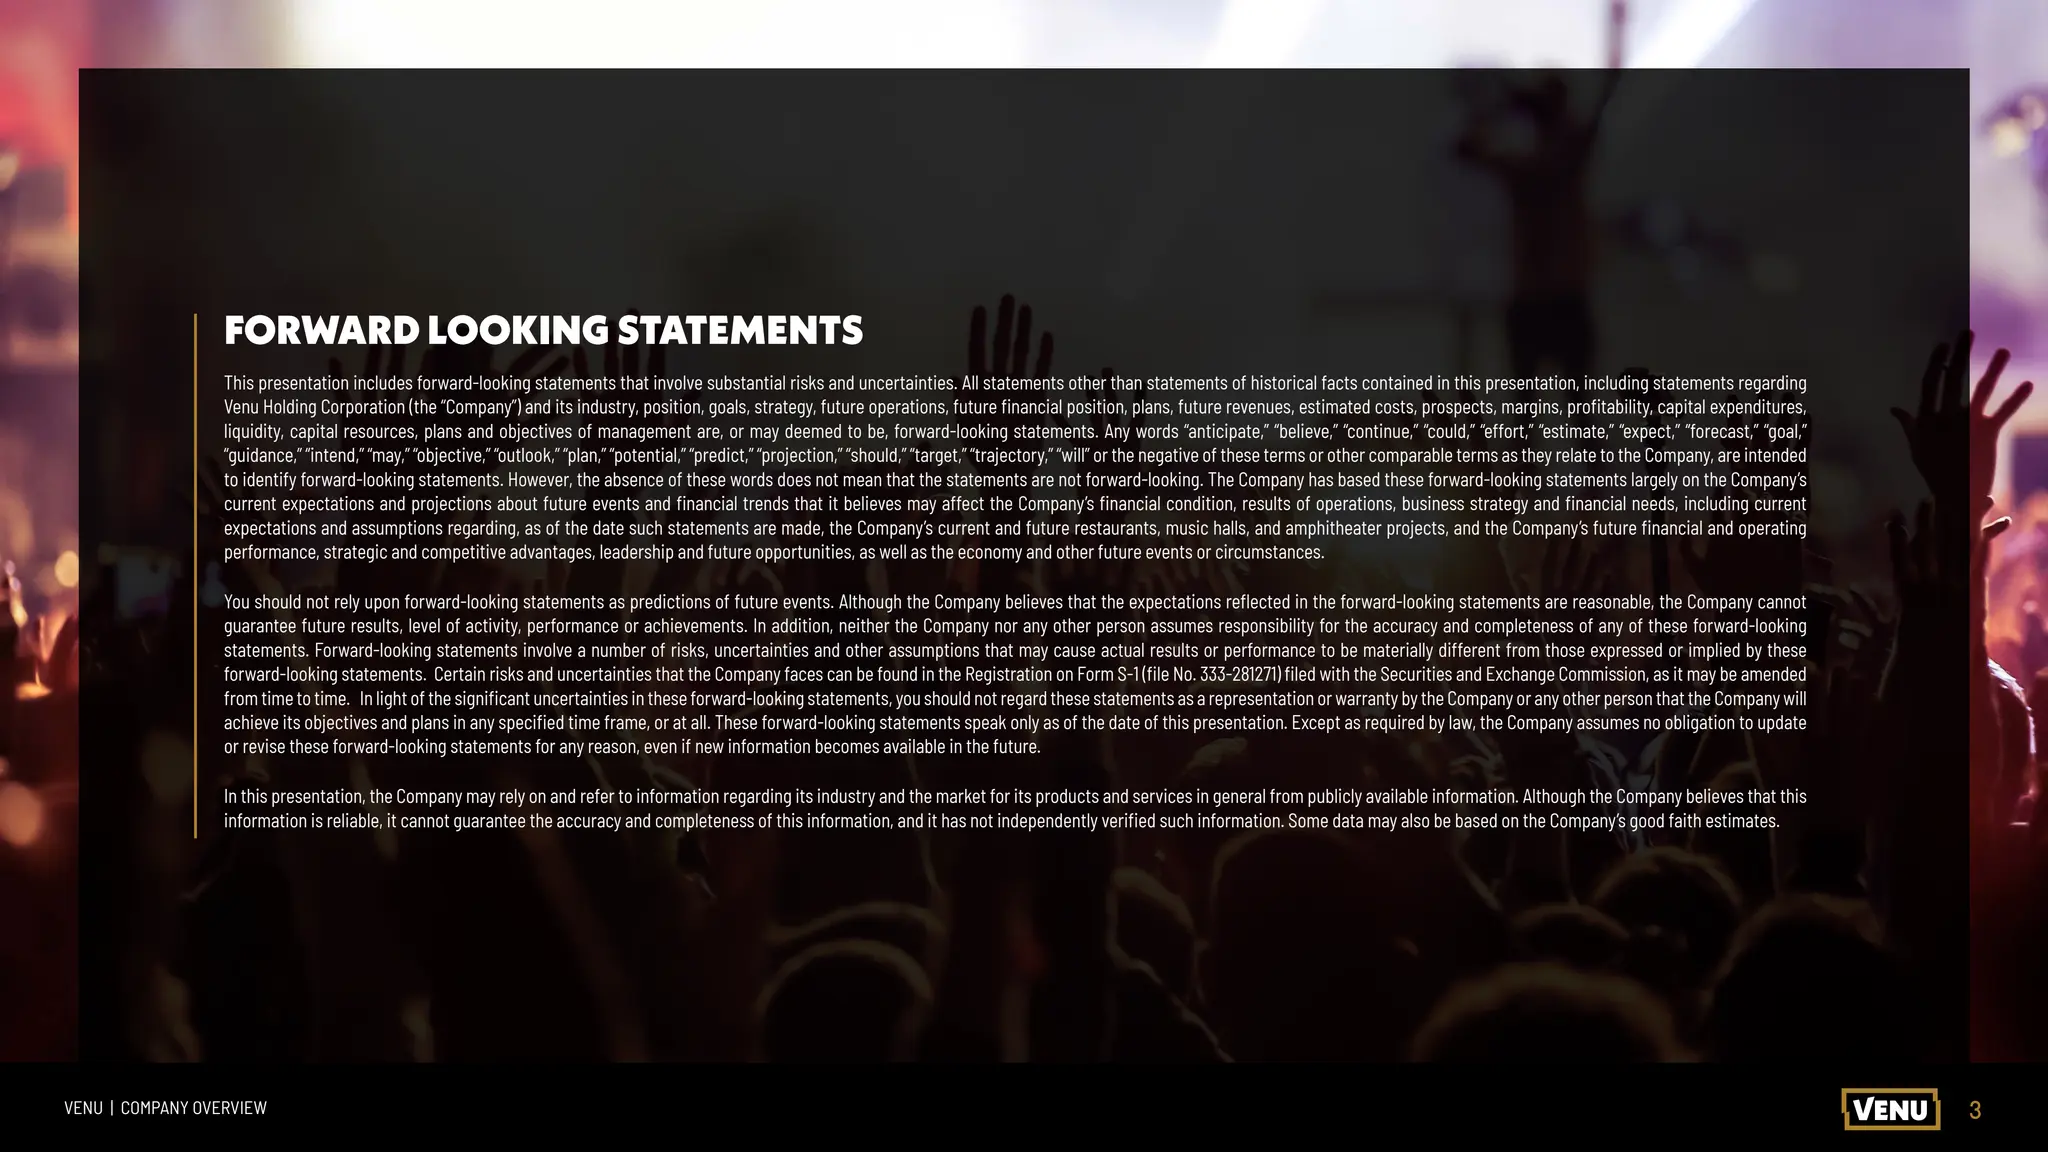
FORWARD LOOKING STATEMENTS
This presentation includes forward-looking statements that involve substantial risks and uncertainties. All statements other than statements of historical facts contained in this presentation, including statements regarding
Venu Holding Corporation (the “Company”) and its industry, position, goals, strategy, future operations, future financial position, plans, future revenues, estimated costs, prospects, margins, profitability, capital expenditures,
liquidity, capital resources, plans and objectives of management are, or may deemed to be, forward-looking statements. Any words “anticipate,” “believe,” “continue,” “could,” “effort,” “estimate,” “expect,” “forecast,” “goal,”
“guidance,” “intend,” “may,” “objective,” “outlook,” “plan,” “potential,” “predict,” “projection,” “should,” “target,” “trajectory,” “will” or the negative of these terms or other comparable terms as they relate to the Company, are intended
to identify forward-looking statements. However, the absence of these words does not mean that the statements are not forward-looking. The Company has based these forward-looking statements largely on the Company’s
current expectations and projections about future events and financial trends that it believes may affect the Company’s financial condition, results of operations, business strategy and financial needs, including current
expectations and assumptions regarding, as of the date such statements are made, the Company’s current and future restaurants, music halls, and amphitheater projects, and the Company’s future financial and operating
performance, strategic and competitive advantages, leadership and future opportunities, as well as the economy and other future events or circumstances.
You should not rely upon forward-looking statements as predictions of future events. Although the Company believes that the expectations reflected in the forward-looking statements are reasonable, the Company cannot
guarantee future results, level of activity, performance or achievements. In addition, neither the Company nor any other person assumes responsibility for the accuracy and completeness of any of these forward-looking
statements. Forward-looking statements involve a number of risks, uncertainties and other assumptions that may cause actual results or performance to be materially different from those expressed or implied by these
forward-looking statements. Certain risks and uncertainties that the Company faces can be found in the Registration on Form S-1 (file No. 333-281271) filed with the Securities and Exchange Commission, as it may be amended
from time to time. In light of the significant uncertainties in these forward-looking statements, you should not regard these statements as a representation or warranty by the Company or any other person that the Company will
achieve its objectives and plans in any specified time frame, or at all. These forward-looking statements speak only as of the date of this presentation. Except as required by law, the Company assumes no obligation to update
or revise these forward-looking statements for any reason, even if new information becomes available in the future.
In this presentation, the Company may rely on and refer to information regarding its industry and the market for its products and services in general from publicly available information. Although the Company believes that this
information is reliable, it cannot guarantee the accuracy and completeness of this information, and it has not independently verified such information. Some data may also be based on the Company’s good faith estimates.
4.
4
VENU | COMPANYOVERVIEW
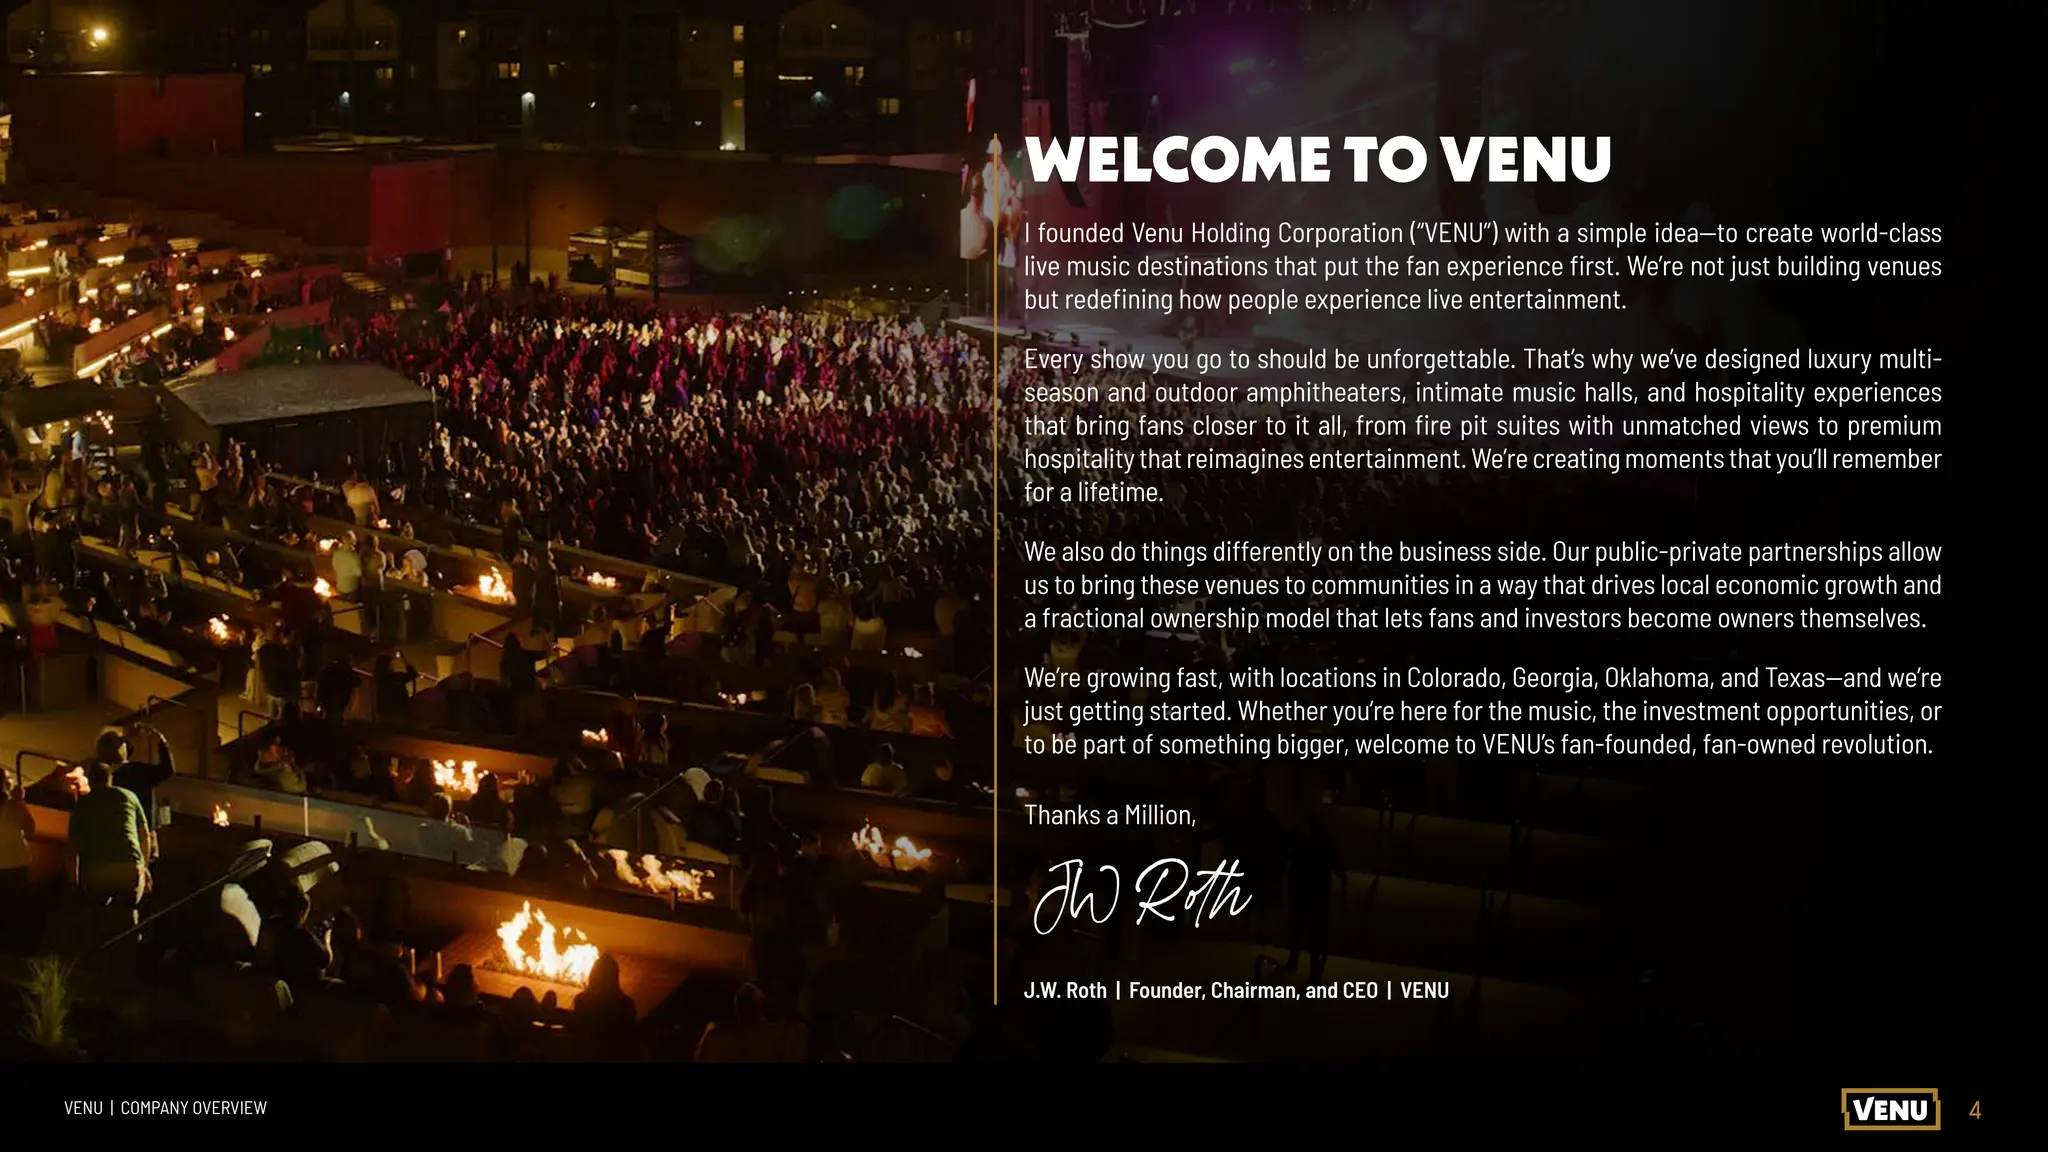
I founded Venu Holding Corporation (“VENU”) with a simple idea—to create world-class
live music destinations that put the fan experience first. We’re not just building venues
but redefining how people experience live entertainment.
Every show you go to should be unforgettable. That’s why we’ve designed luxury multi-
season and outdoor amphitheaters, intimate music halls, and hospitality experiences
that bring fans closer to it all, from fire pit suites with unmatched views to premium
hospitalitythatreimaginesentertainment.We’recreatingmomentsthatyou’llremember
for a lifetime.
We also do things differently on the business side. Our public-private partnerships allow
us to bring these venues to communities in a way that drives local economic growth and
a fractional ownership model that lets fans and investors become owners themselves.
We’re growing fast, with locations in Colorado, Georgia, Oklahoma, and Texas—and we’re
just getting started. Whether you’re here for the music, the investment opportunities, or
to be part of something bigger, welcome to VENU’s fan-founded, fan-owned revolution.
Thanks a Million,
J.W. Roth | Founder, Chairman, and CEO | VENU
WELCOME TO VENU
5.
5
VENU | COMPANYOVERVIEW
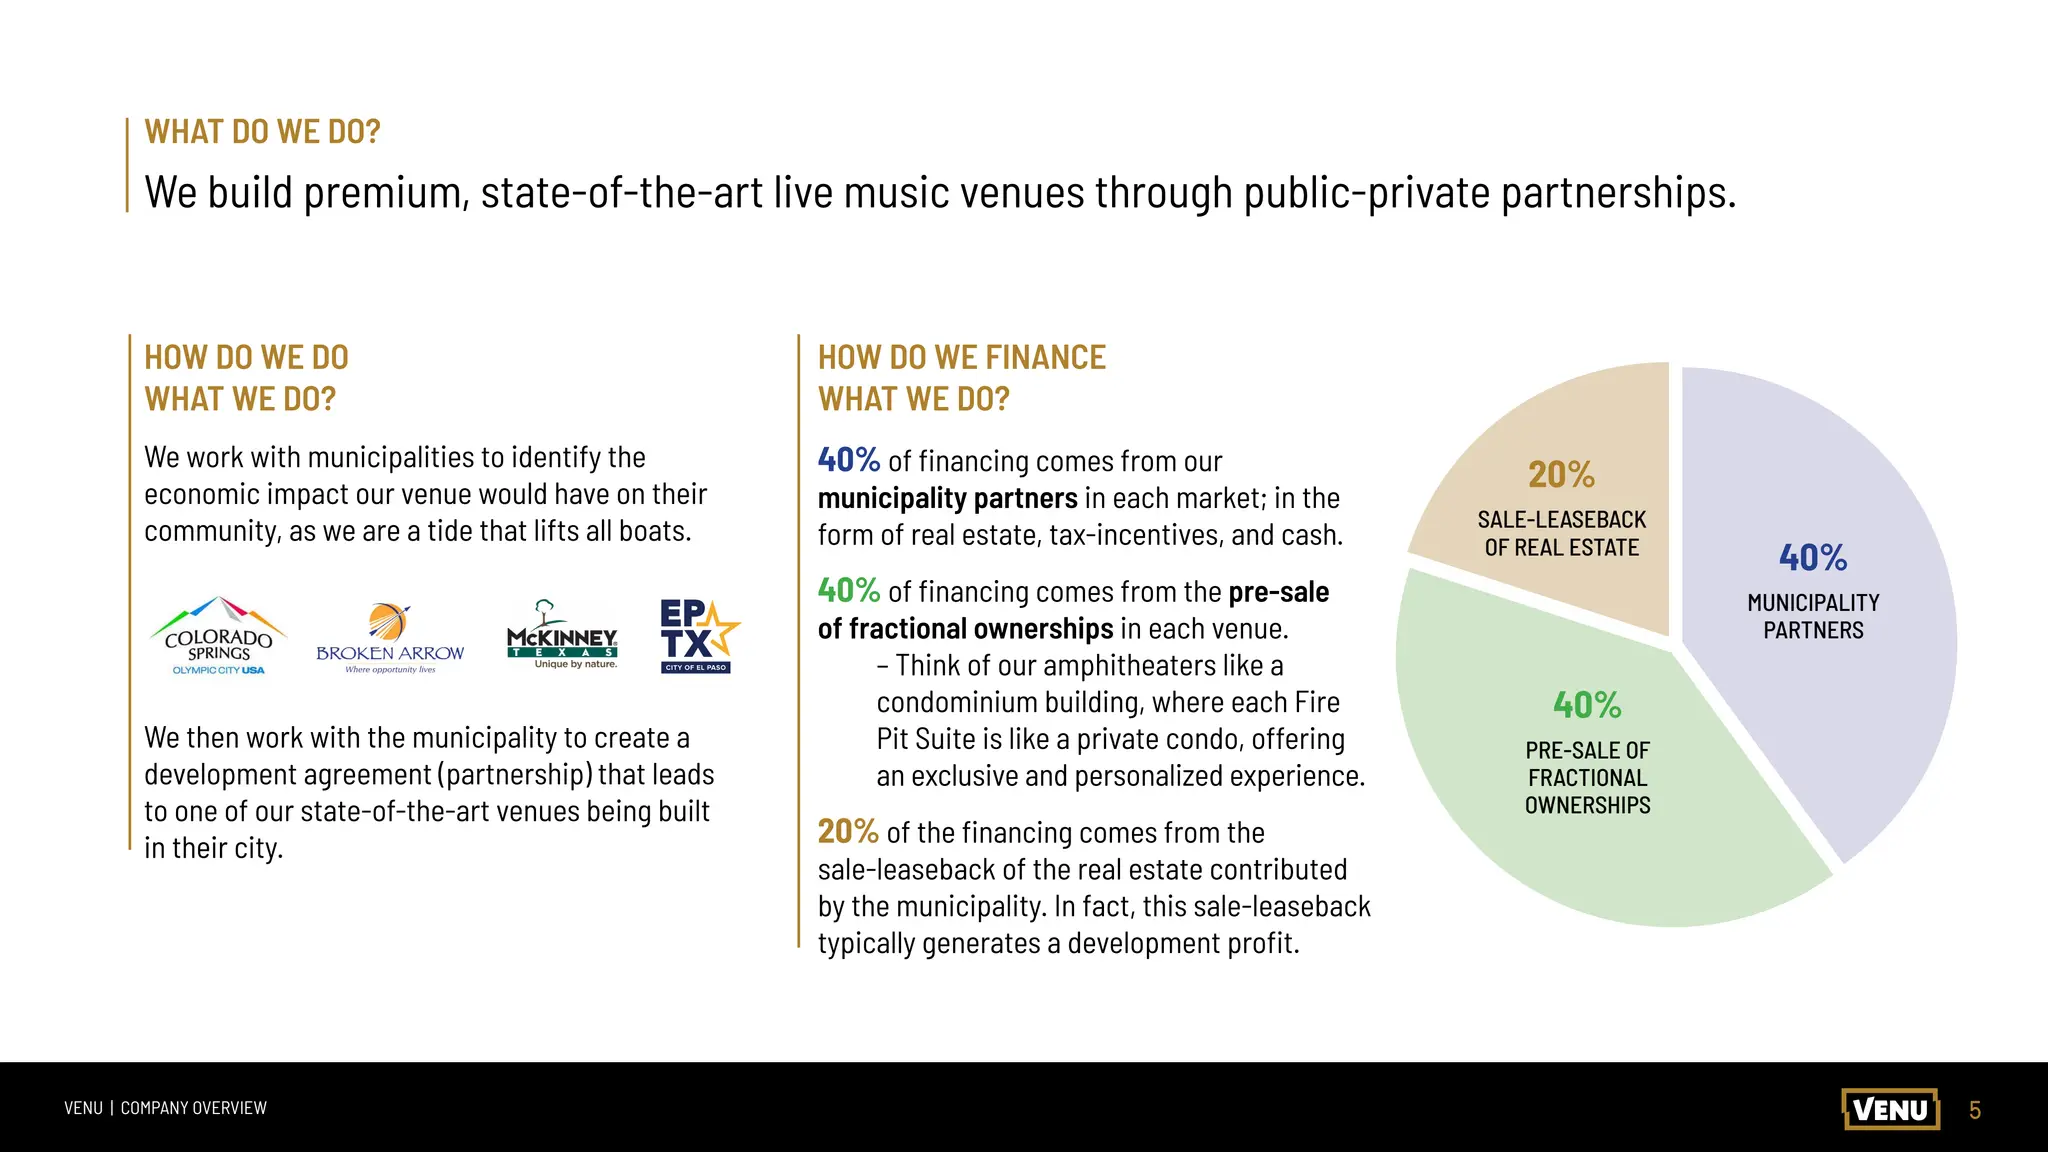
WHAT DO WE DO?
We build premium, state-of-the-art live music venues through public-private partnerships.
We work with municipalities to identify the
economic impact our venue would have on their
community, as we are a tide that lifts all boats.
HOW DO WE DO
WHAT WE DO?
We then work with the municipality to create a
development agreement (partnership) that leads
to one of our state-of-the-art venues being built
in their city.
40% of financing comes from our
municipality partners in each market; in the
form of real estate, tax-incentives, and cash.
40% of financing comes from the pre-sale
of fractional ownerships in each venue.
– Think of our amphitheaters like a
condominium building, where each Fire
Pit Suite is like a private condo, offering
an exclusive and personalized experience.
20% of the financing comes from the
sale-leaseback of the real estate contributed
by the municipality. In fact, this sale-leaseback
typically generates a development profit.
40%
MUNICIPALITY
PARTNERS
40%
PRE-SALE OF
FRACTIONAL
OWNERSHIPS
20%
SALE-LEASEBACK
OF REAL ESTATE
HOW DO WE FINANCE
WHAT WE DO?
6.
6
VENU | COMPANYOVERVIEW
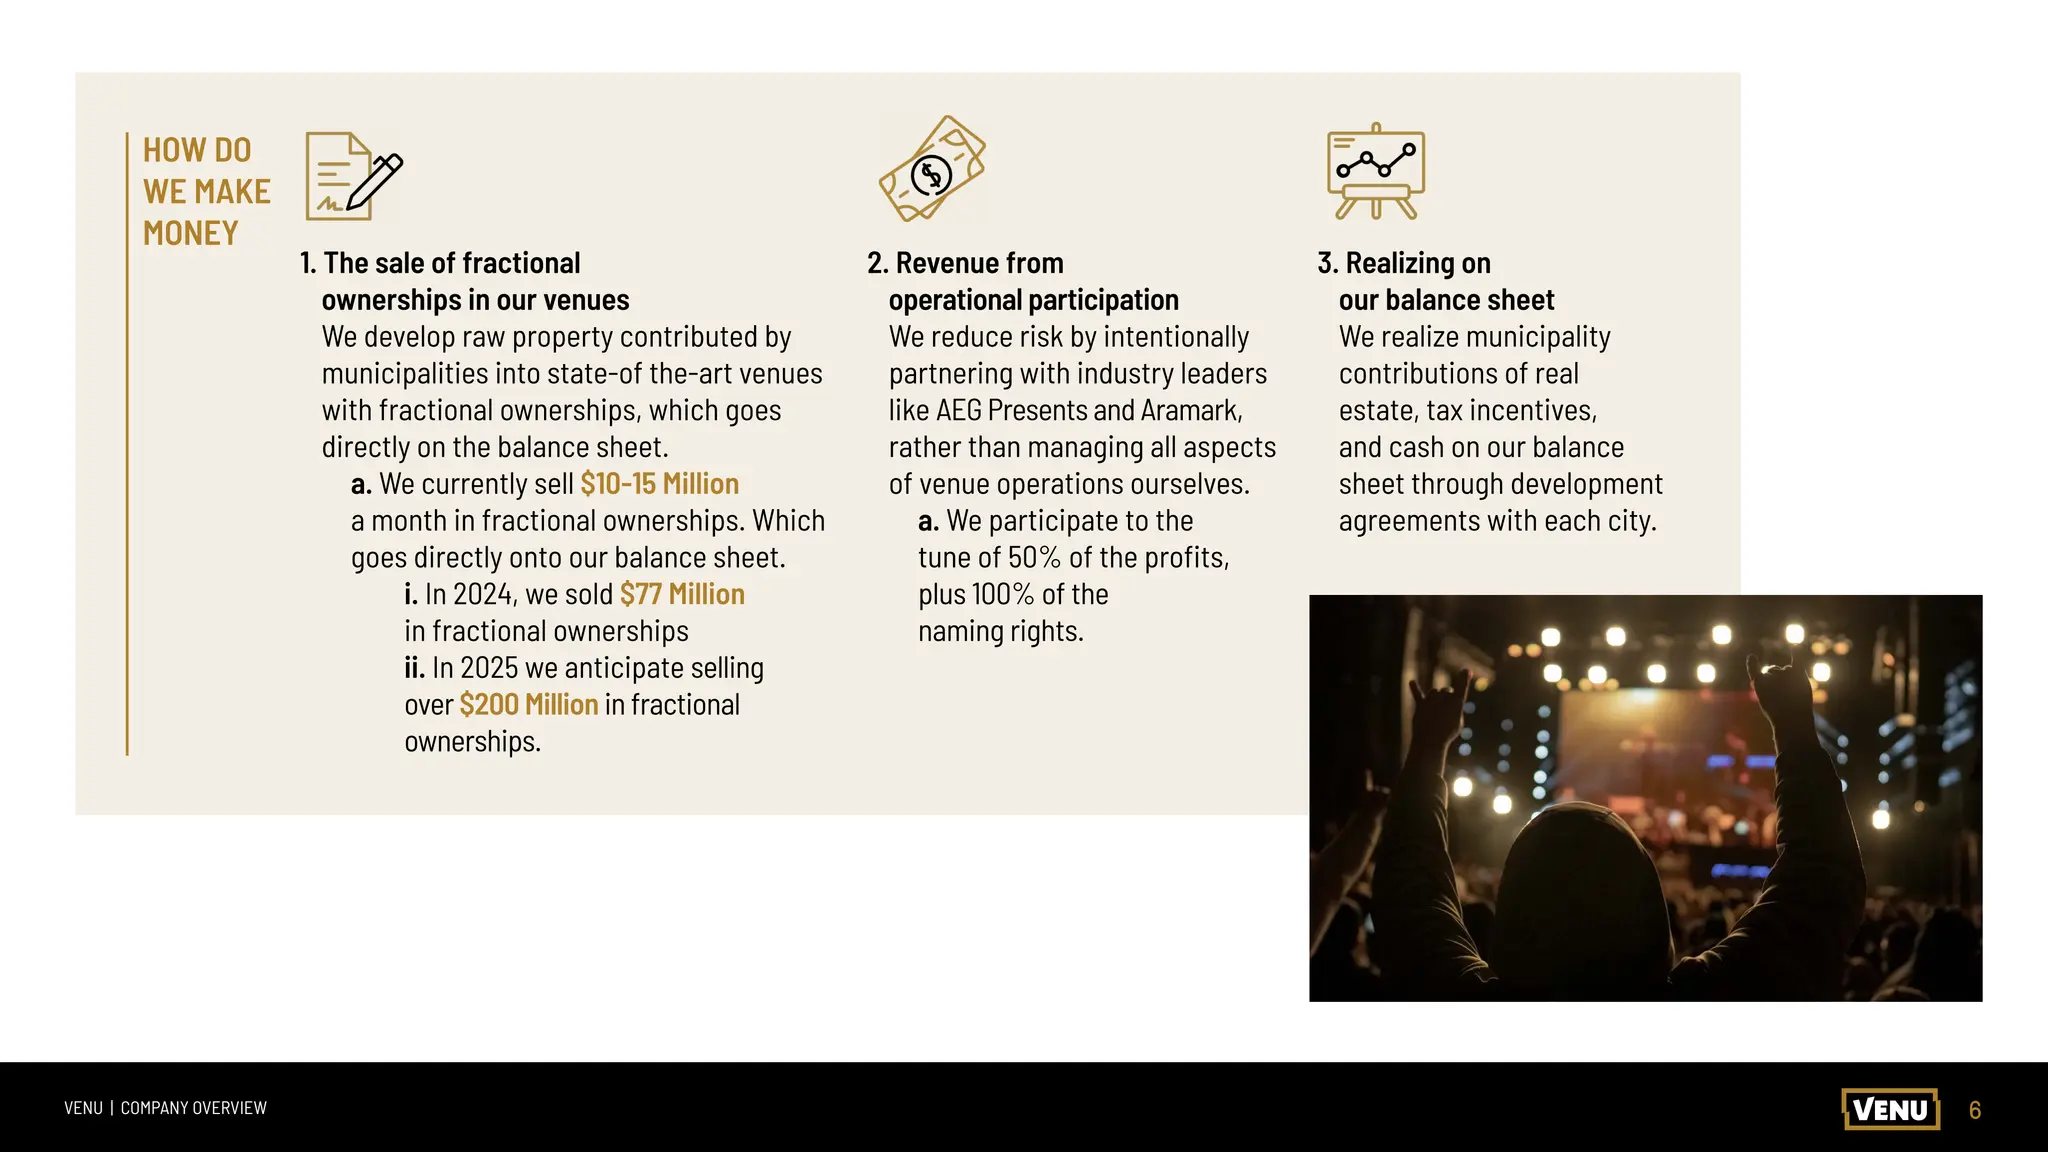
1. The sale of fractional
ownerships in our venues
We develop raw property contributed by
municipalities into state-of the-art venues
with fractional ownerships, which goes
directly on the balance sheet.
a. We currently sell $10-15 Million
a month in fractional ownerships. Which
goes directly onto our balance sheet.
i. In 2024, we sold $77 Million
in fractional ownerships
ii. In 2025 we anticipate selling
over $200 Million in fractional
ownerships.
HOW DO
WE MAKE
MONEY
2. Revenue from
operational participation
We reduce risk by intentionally
partnering with industry leaders
like AEG Presents and Aramark,
rather than managing all aspects
of venue operations ourselves.
a. We participate to the
tune of 50% of the profits,
plus 100% of the
naming rights.
3. Realizing on
our balance sheet
We realize municipality
contributions of real
estate, tax incentives,
and cash on our balance
sheet through development
agreements with each city.
7.
7
VENU | COMPANYOVERVIEW
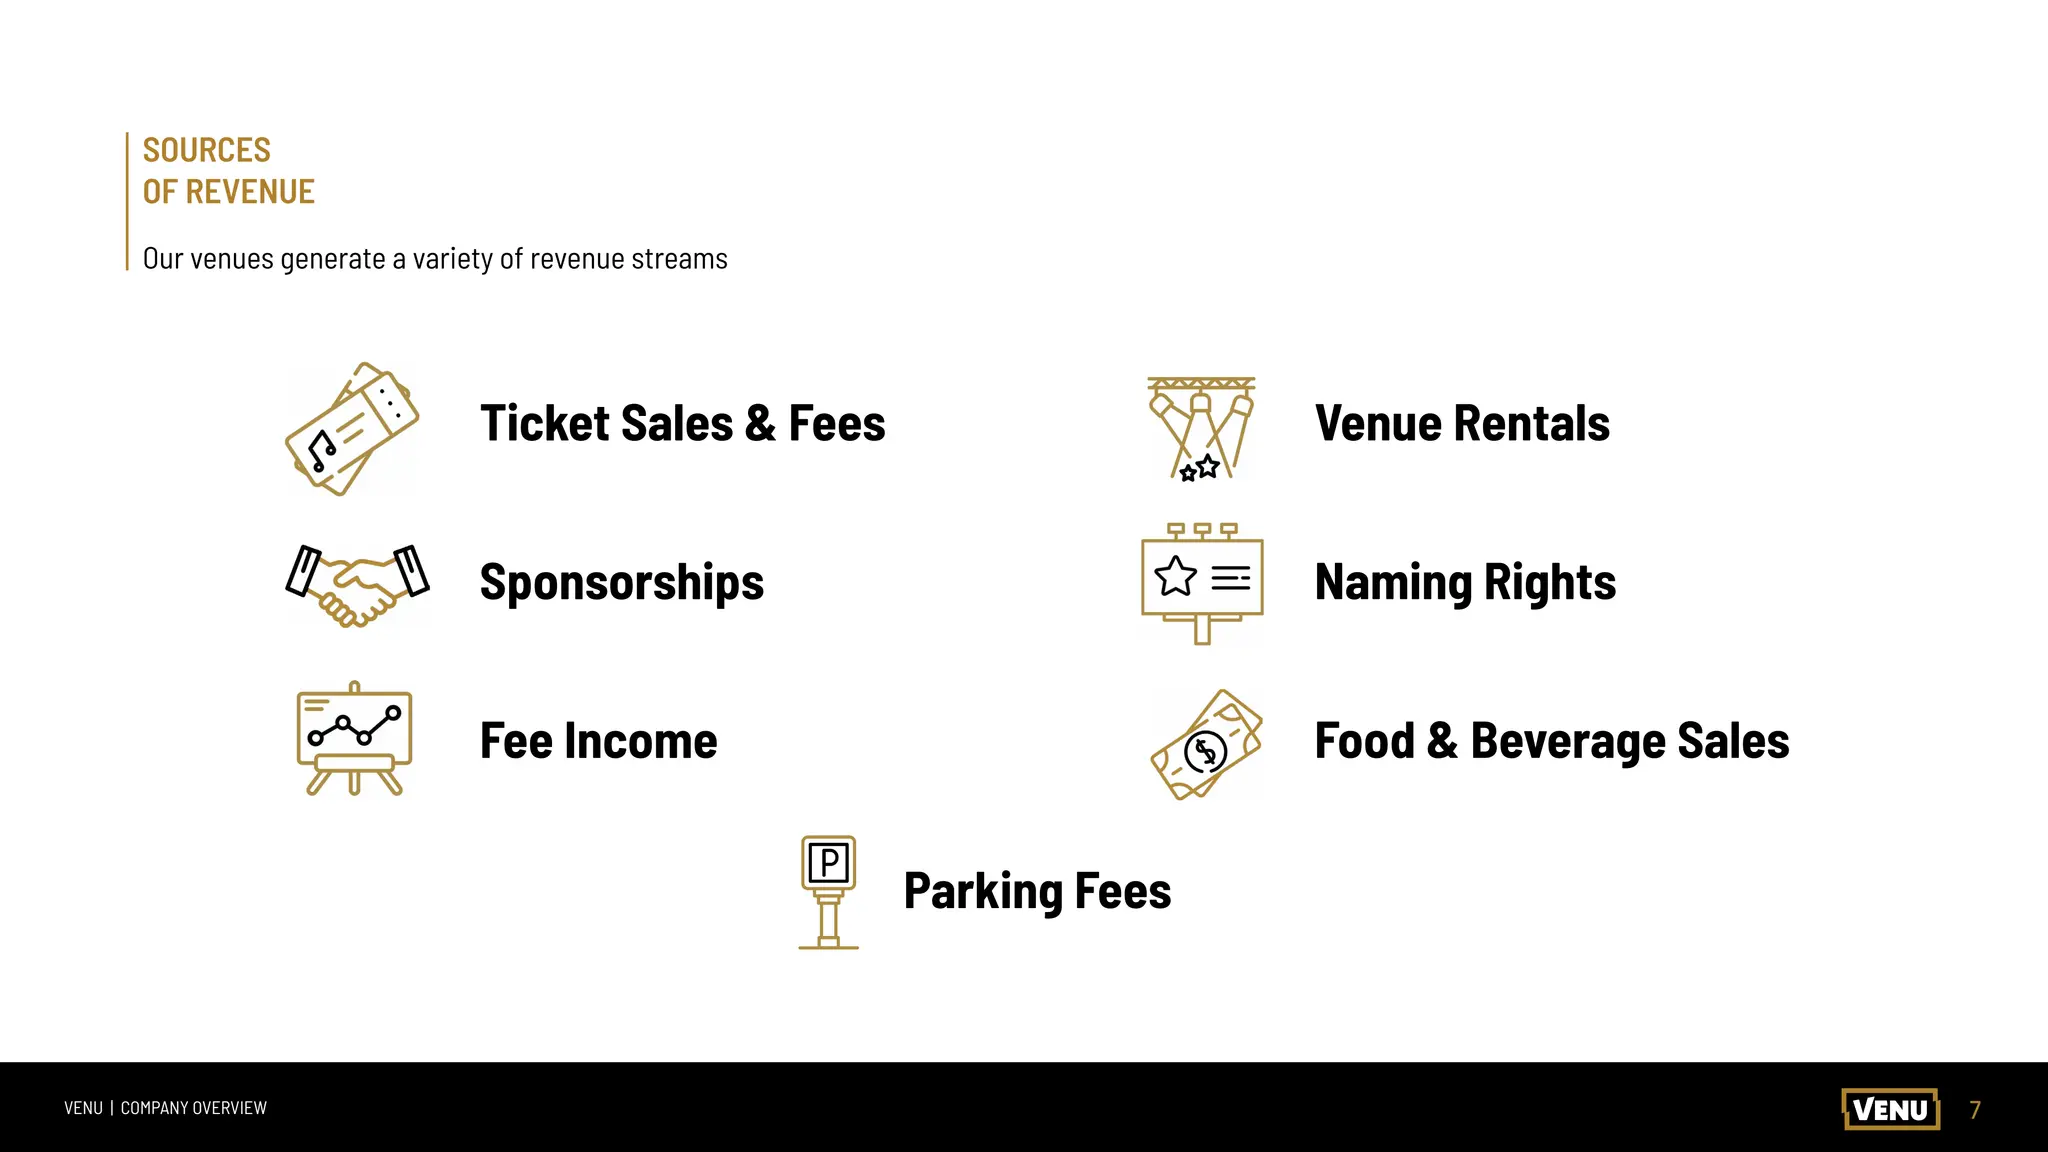
SOURCES
OF REVENUE
Our venues generate a variety of revenue streams
Ticket Sales & Fees
Sponsorships
Fee Income
Venue Rentals
Naming Rights
Food & Beverage Sales
Parking Fees
8.
8
VENU | COMPANYOVERVIEW
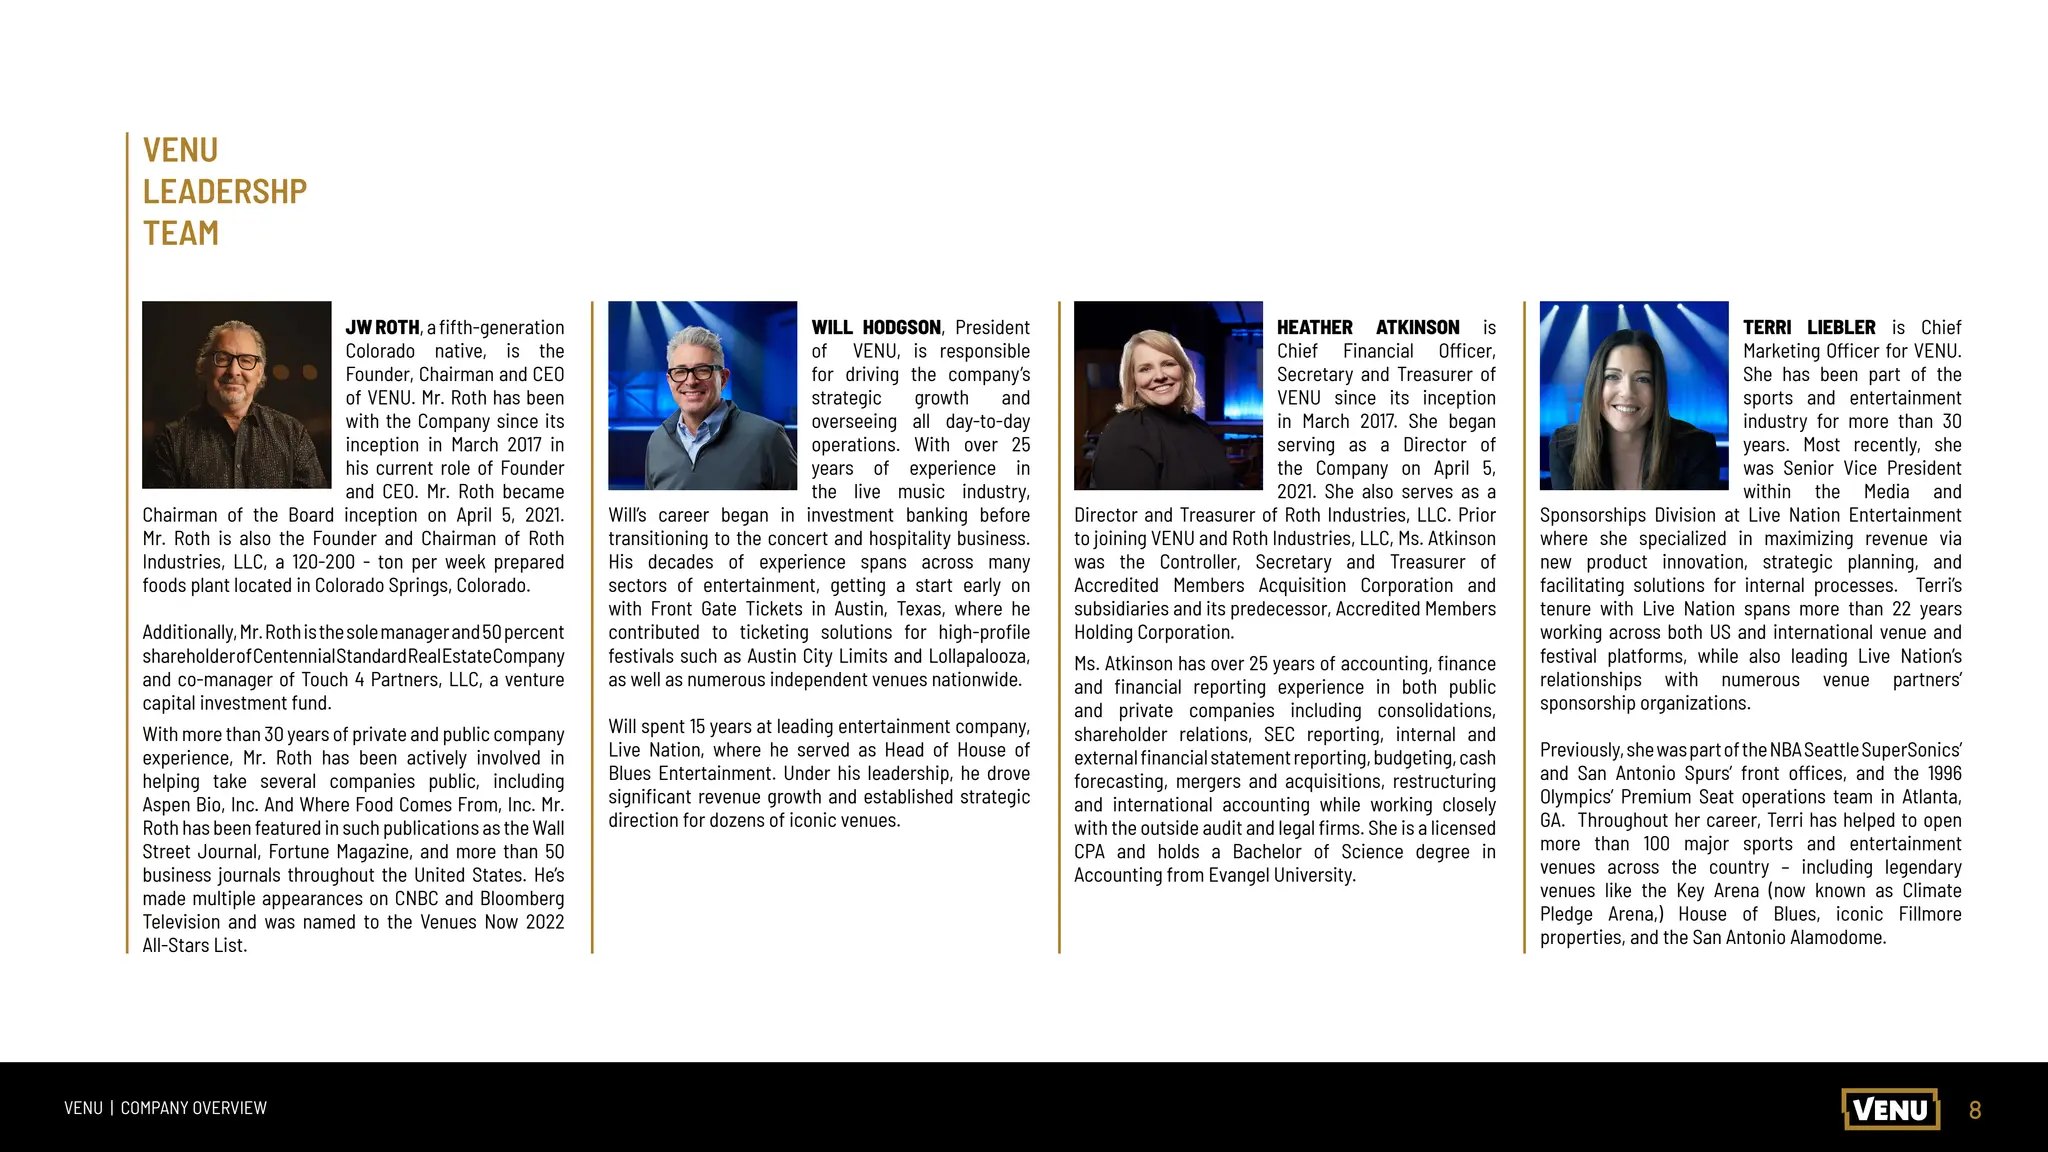
TERRI LIEBLER is Chief
Marketing Officer for VENU.
She has been part of the
sports and entertainment
industry for more than 30
years. Most recently, she
was Senior Vice President
within the Media and
Sponsorships Division at Live Nation Entertainment
where she specialized in maximizing revenue via
new product innovation, strategic planning, and
facilitating solutions for internal processes. Terri’s
tenure with Live Nation spans more than 22 years
working across both US and international venue and
festival platforms, while also leading Live Nation’s
relationships with numerous venue partners’
sponsorship organizations.
Previously,shewaspartoftheNBASeattleSuperSonics’
and San Antonio Spurs’ front offices, and the 1996
Olympics’ Premium Seat operations team in Atlanta,
GA. Throughout her career, Terri has helped to open
more than 100 major sports and entertainment
venues across the country – including legendary
venues like the Key Arena (now known as Climate
Pledge Arena,) House of Blues, iconic Fillmore
properties, and the San Antonio Alamodome.
JWROTH,afifth-generation
Colorado native, is the
Founder, Chairman and CEO
of VENU. Mr. Roth has been
with the Company since its
inception in March 2017 in
his current role of Founder
and CEO. Mr. Roth became
Chairman of the Board inception on April 5, 2021.
Mr. Roth is also the Founder and Chairman of Roth
Industries, LLC, a 120-200 - ton per week prepared
foods plant located in Colorado Springs, Colorado.
Additionally,Mr.Rothisthesolemanagerand50percent
shareholderofCentennialStandardRealEstateCompany
and co-manager of Touch 4 Partners, LLC, a venture
capital investment fund.
With more than 30 years of private and public company
experience, Mr. Roth has been actively involved in
helping take several companies public, including
Aspen Bio, Inc. And Where Food Comes From, Inc. Mr.
Roth has been featured in such publications as the Wall
Street Journal, Fortune Magazine, and more than 50
business journals throughout the United States. He’s
made multiple appearances on CNBC and Bloomberg
Television and was named to the Venues Now 2022
All-Stars List.
WILL HODGSON, President
of VENU, is responsible
for driving the company’s
strategic growth and
overseeing all day-to-day
operations. With over 25
years of experience in
the live music industry,
Will’s career began in investment banking before
transitioning to the concert and hospitality business.
His decades of experience spans across many
sectors of entertainment, getting a start early on
with Front Gate Tickets in Austin, Texas, where he
contributed to ticketing solutions for high-profile
festivals such as Austin City Limits and Lollapalooza,
as well as numerous independent venues nationwide.
Will spent 15 years at leading entertainment company,
Live Nation, where he served as Head of House of
Blues Entertainment. Under his leadership, he drove
significant revenue growth and established strategic
direction for dozens of iconic venues.
HEATHER ATKINSON is
Chief Financial Officer,
Secretary and Treasurer of
VENU since its inception
in March 2017. She began
serving as a Director of
the Company on April 5,
2021. She also serves as a
Director and Treasurer of Roth Industries, LLC. Prior
to joining VENU and Roth Industries, LLC, Ms. Atkinson
was the Controller, Secretary and Treasurer of
Accredited Members Acquisition Corporation and
subsidiaries and its predecessor, Accredited Members
Holding Corporation.
Ms. Atkinson has over 25 years of accounting, finance
and financial reporting experience in both public
and private companies including consolidations,
shareholder relations, SEC reporting, internal and
externalfinancialstatementreporting,budgeting,cash
forecasting, mergers and acquisitions, restructuring
and international accounting while working closely
with the outside audit and legal firms. She is a licensed
CPA and holds a Bachelor of Science degree in
Accounting from Evangel University.
VENU
LEADERSHP
TEAM
9.
9
VENU | COMPANYOVERVIEW
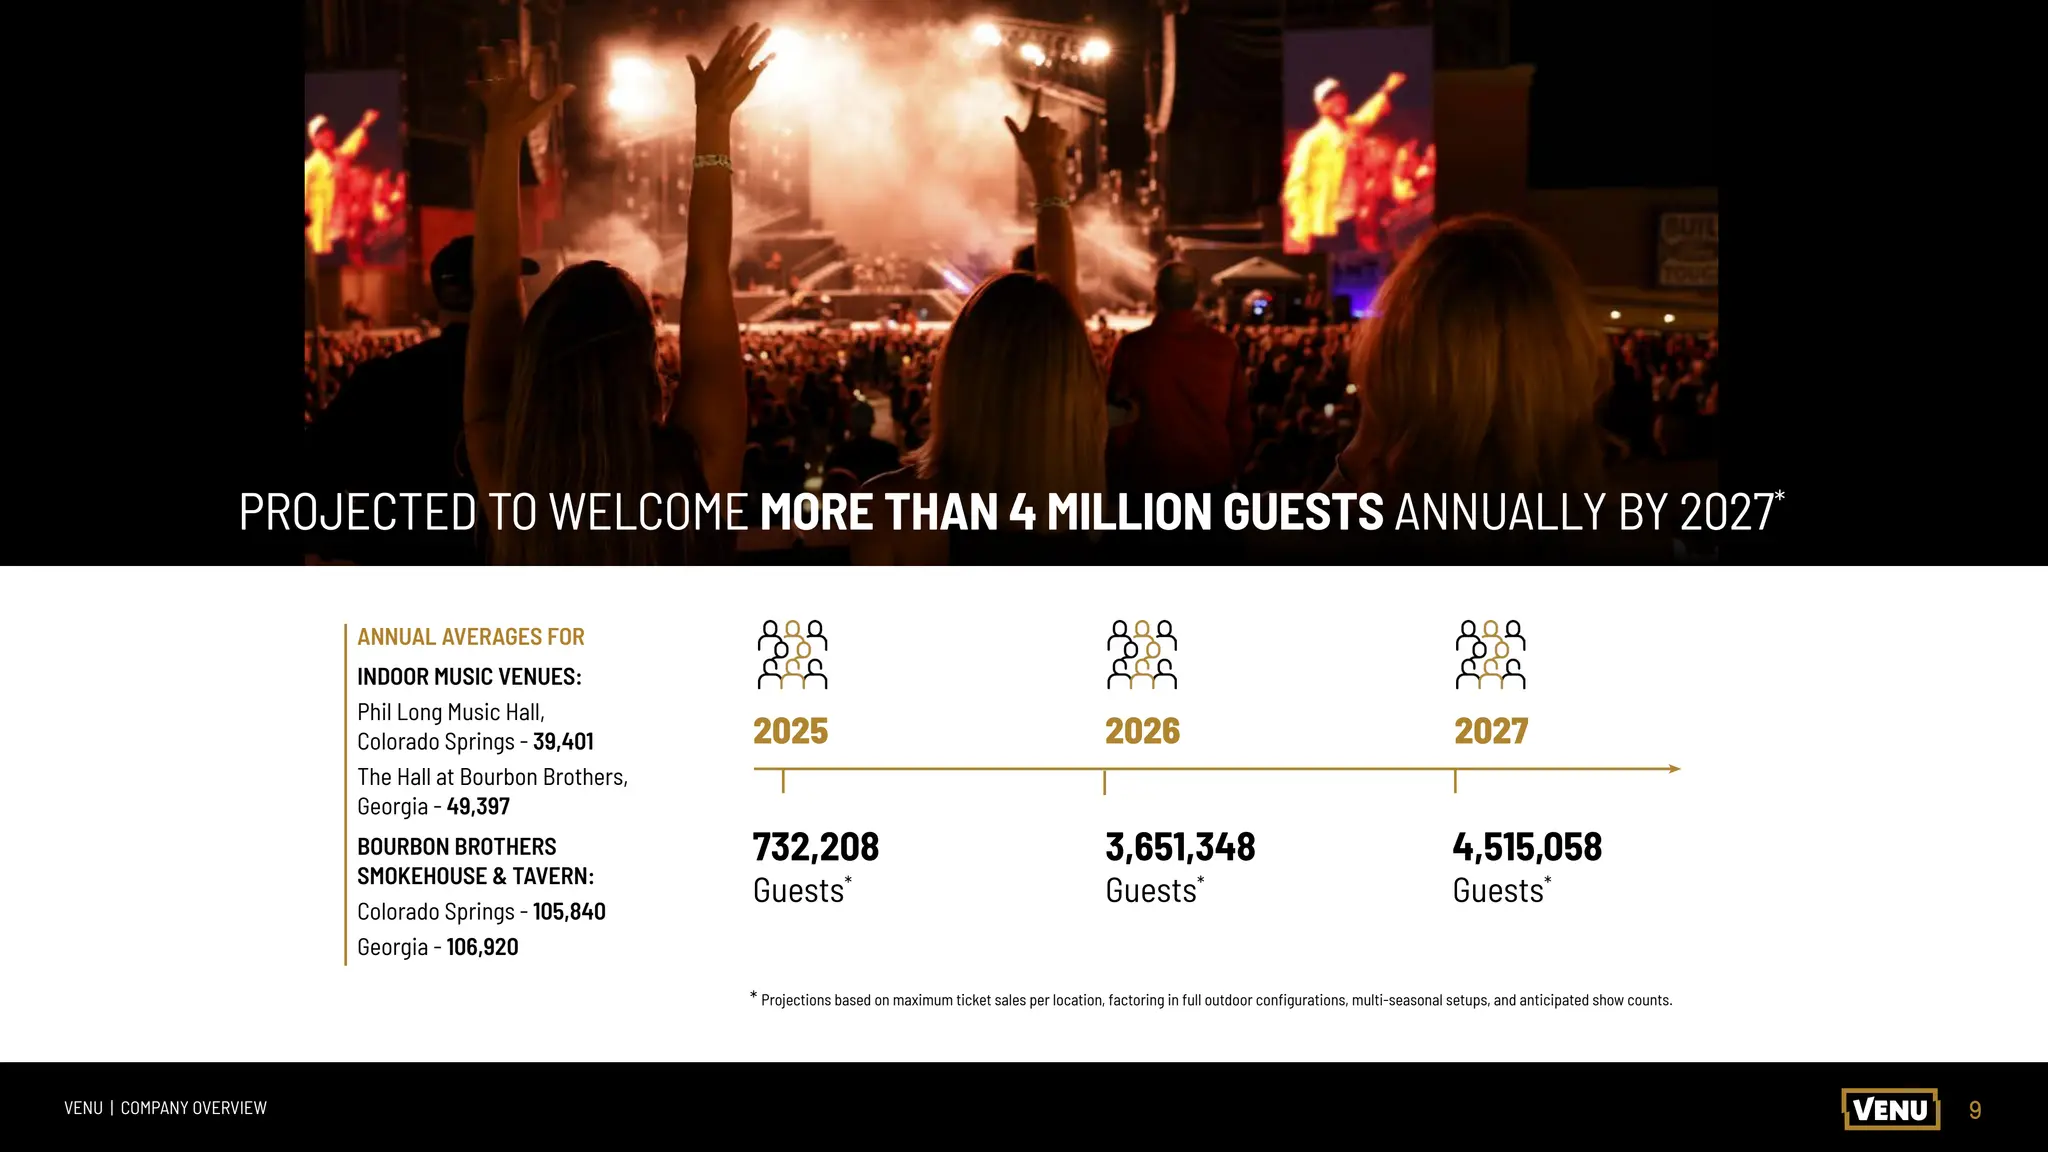
2025 2026 2027
732,208
Guests*
3,651,348
Guests*
4,515,058
Guests*
* Projections based on maximum ticket sales per location, factoring in full outdoor configurations, multi-seasonal setups, and anticipated show counts.
ANNUAL AVERAGES FOR
INDOOR MUSIC VENUES:
Phil Long Music Hall,
Colorado Springs - 39,401
The Hall at Bourbon Brothers,
Georgia - 49,397
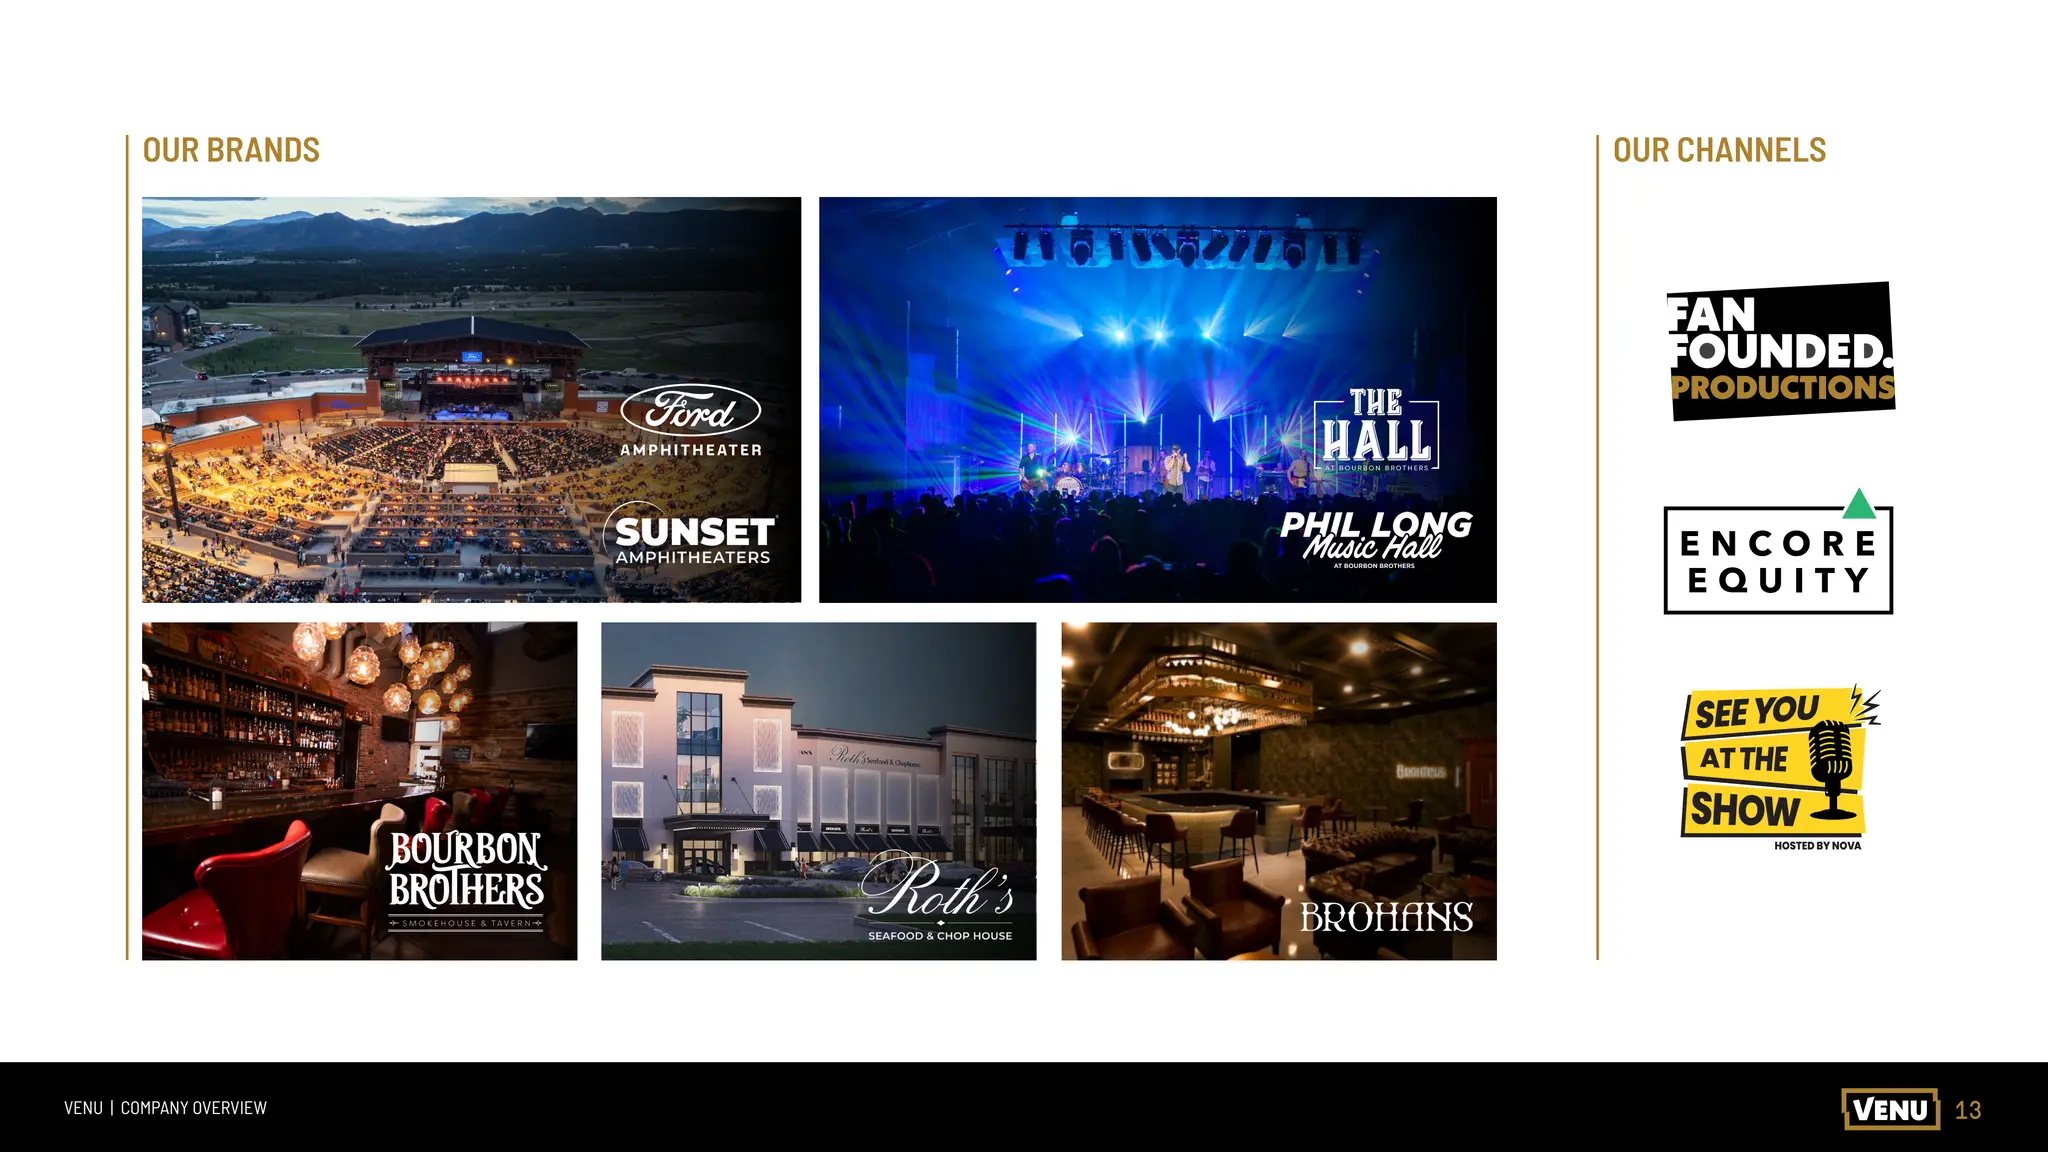
BOURBON BROTHERS
SMOKEHOUSE & TAVERN:
Colorado Springs - 105,840
Georgia - 106,920
PROJECTED TO WELCOME MORE THAN 4 MILLION GUESTS ANNUALLY BY 2027*
10.
10
VENU | COMPANYOVERVIEW
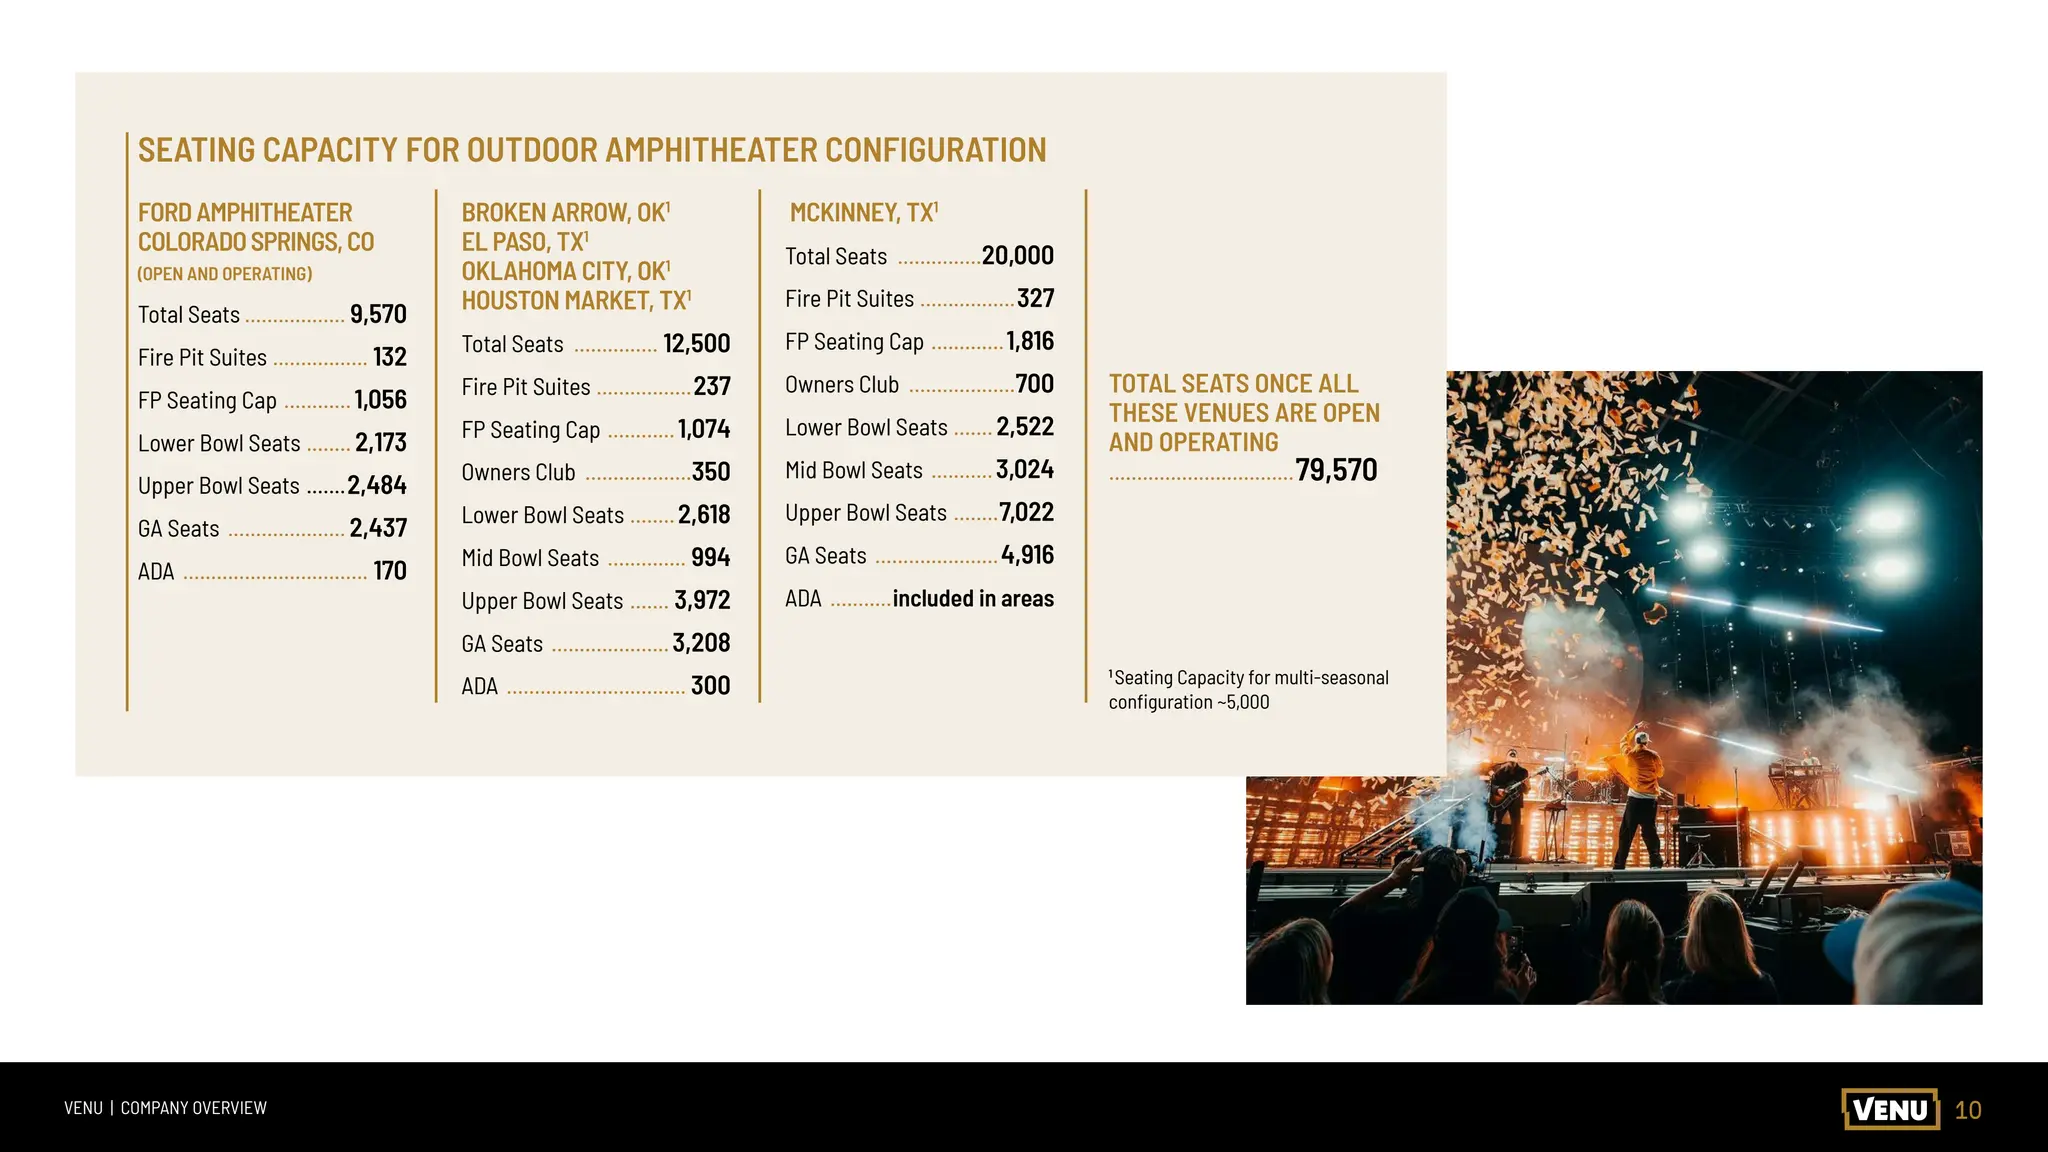
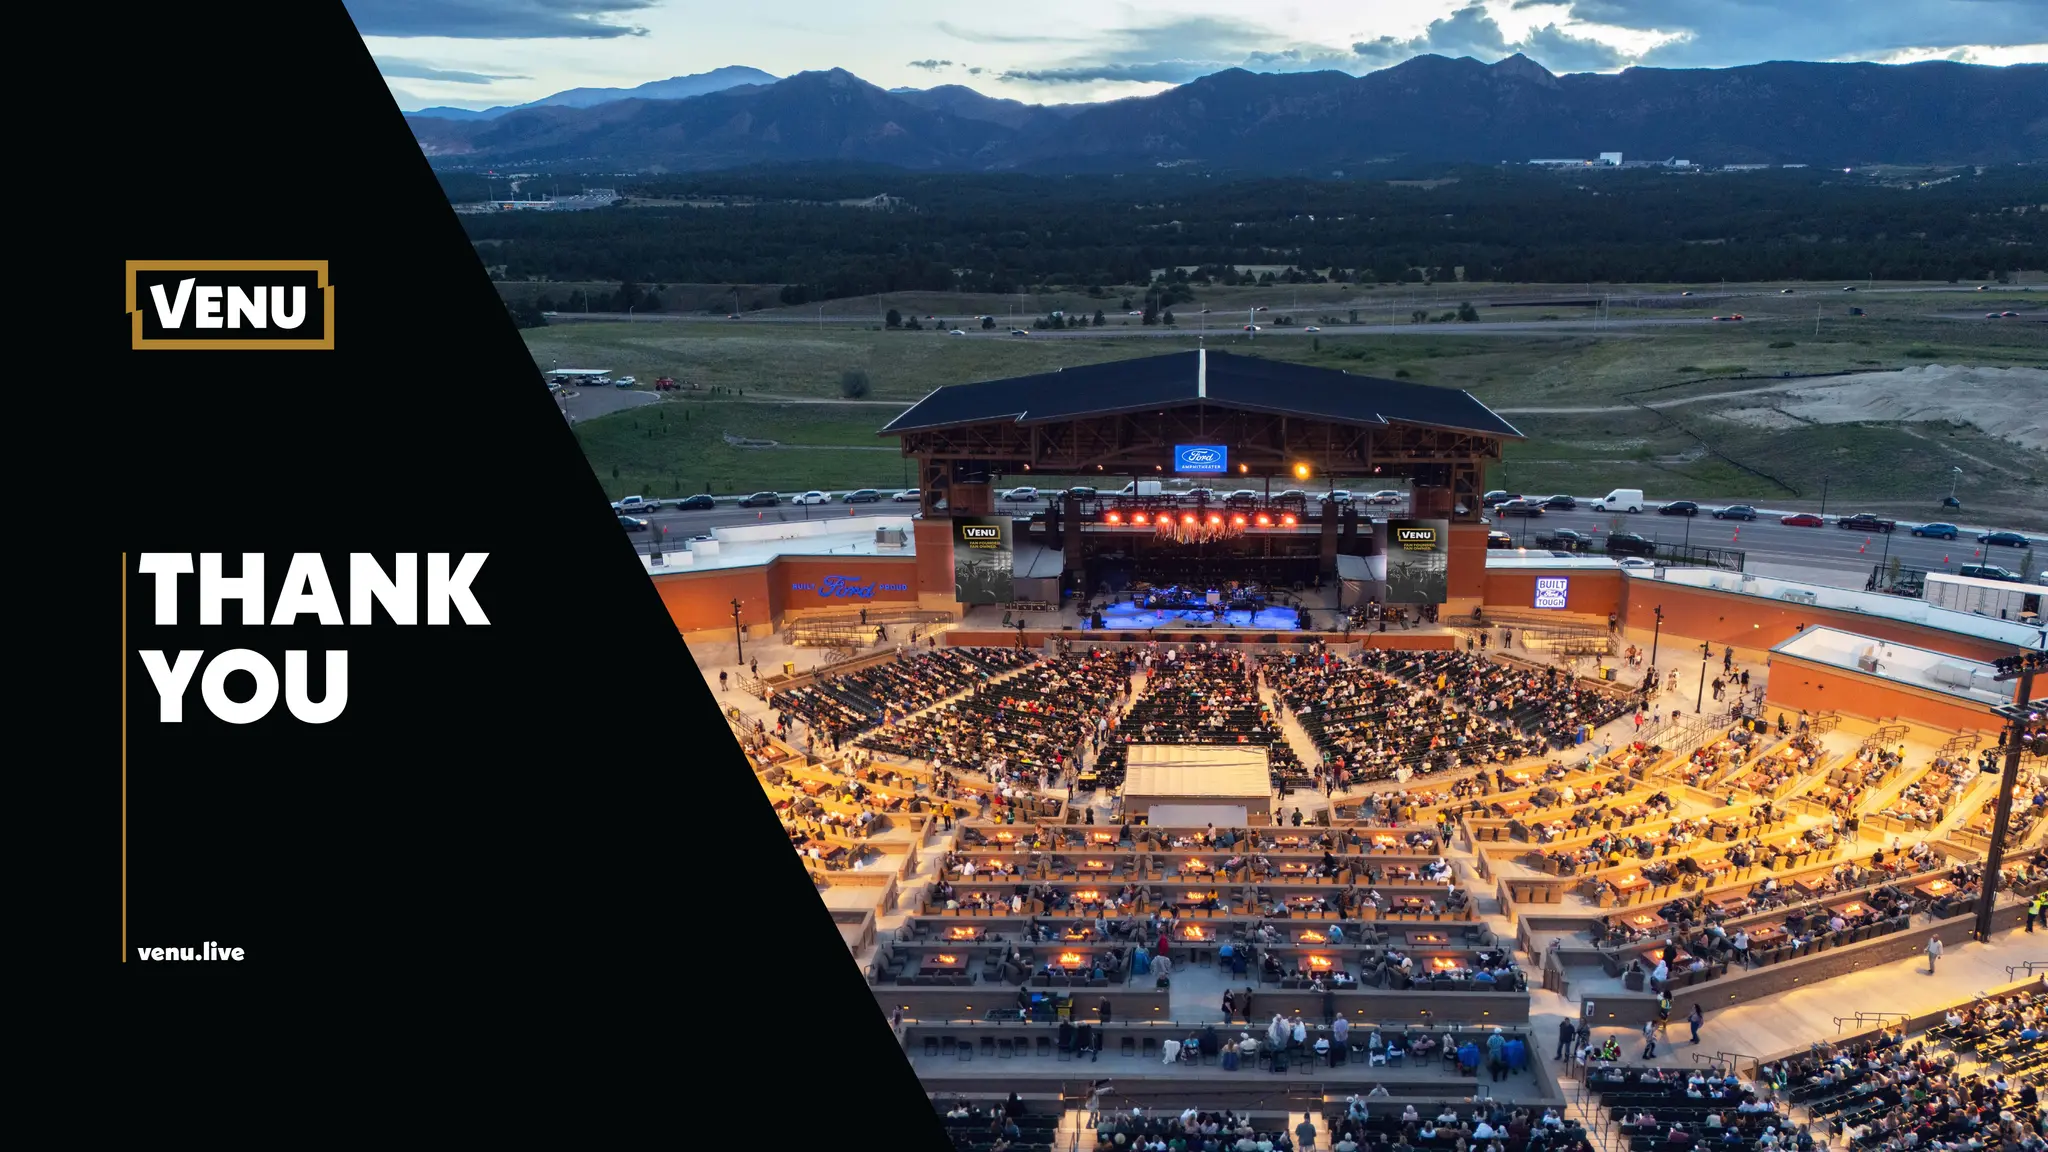
FORDAMPHITHEATER
COLORADOSPRINGS,CO
(OPEN AND OPERATING)
Total Seats................... 9,570
Fire Pit Suites .................. 132
FP Seating Cap .............1,056
Lower Bowl Seats ......... 2,173
Upper Bowl Seats ........2,484
GA Seats ...................... 2,437
ADA .................................. 170
BROKEN ARROW, OK1
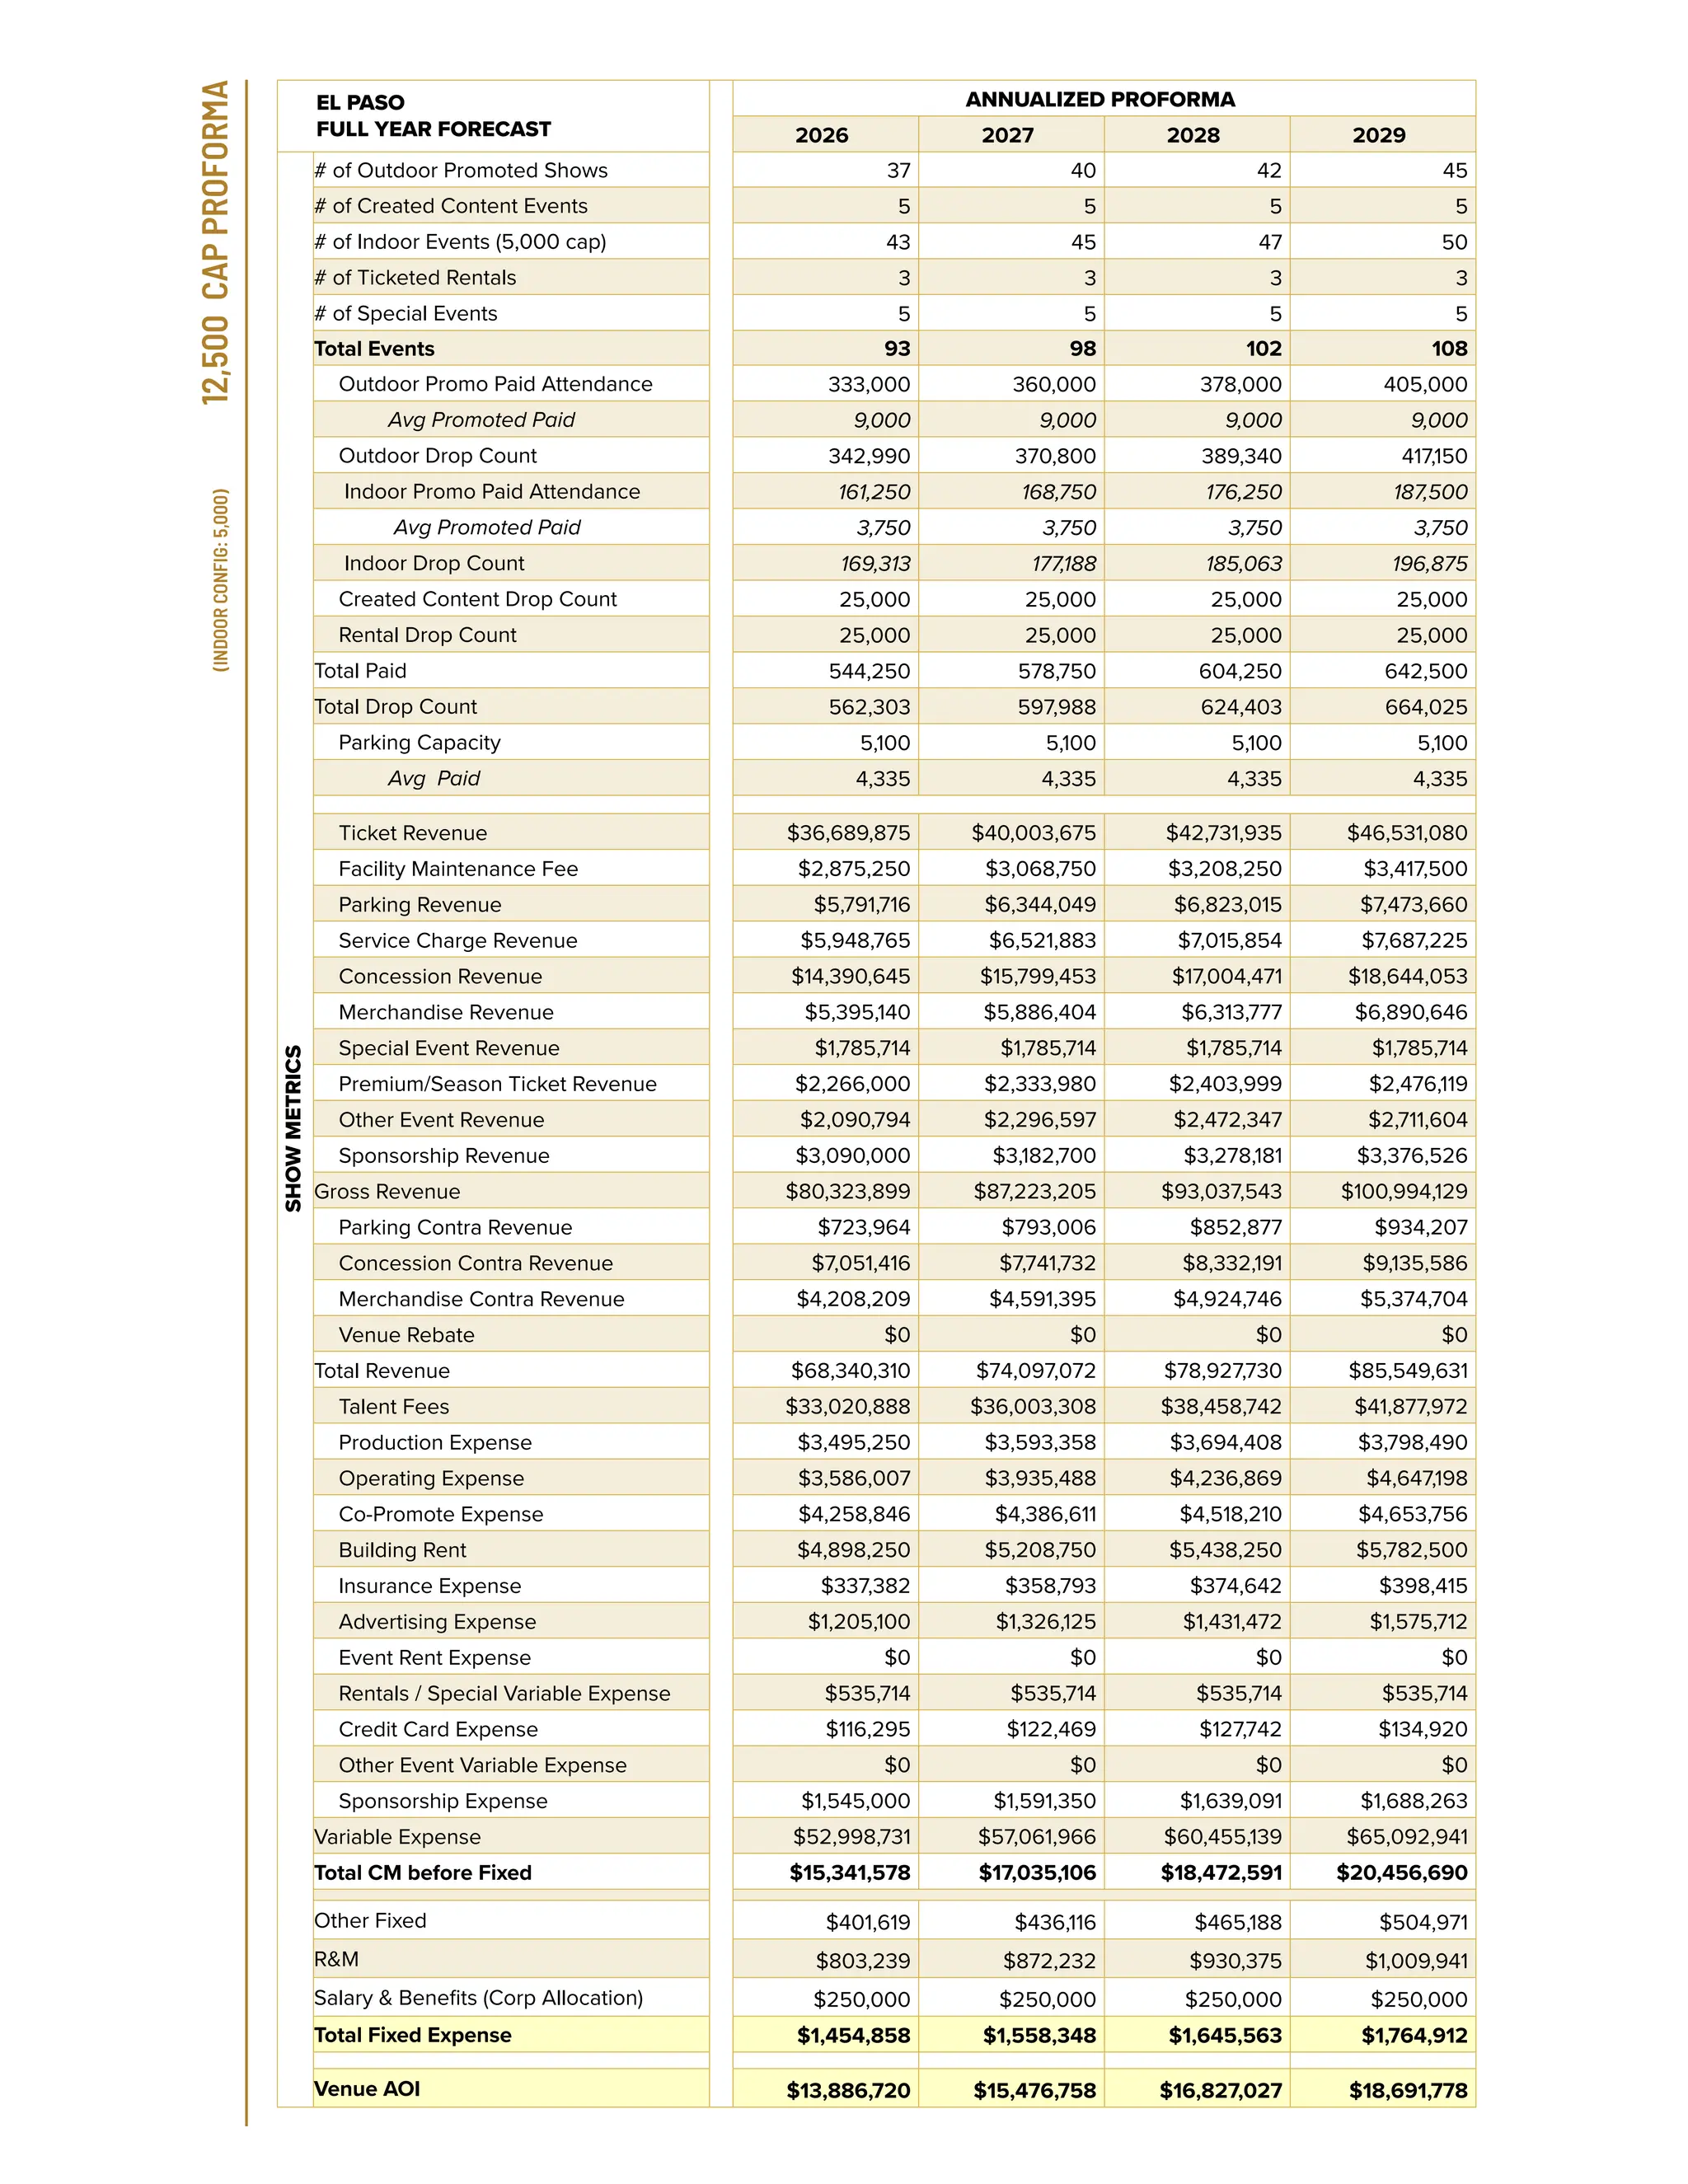
EL PASO, TX1
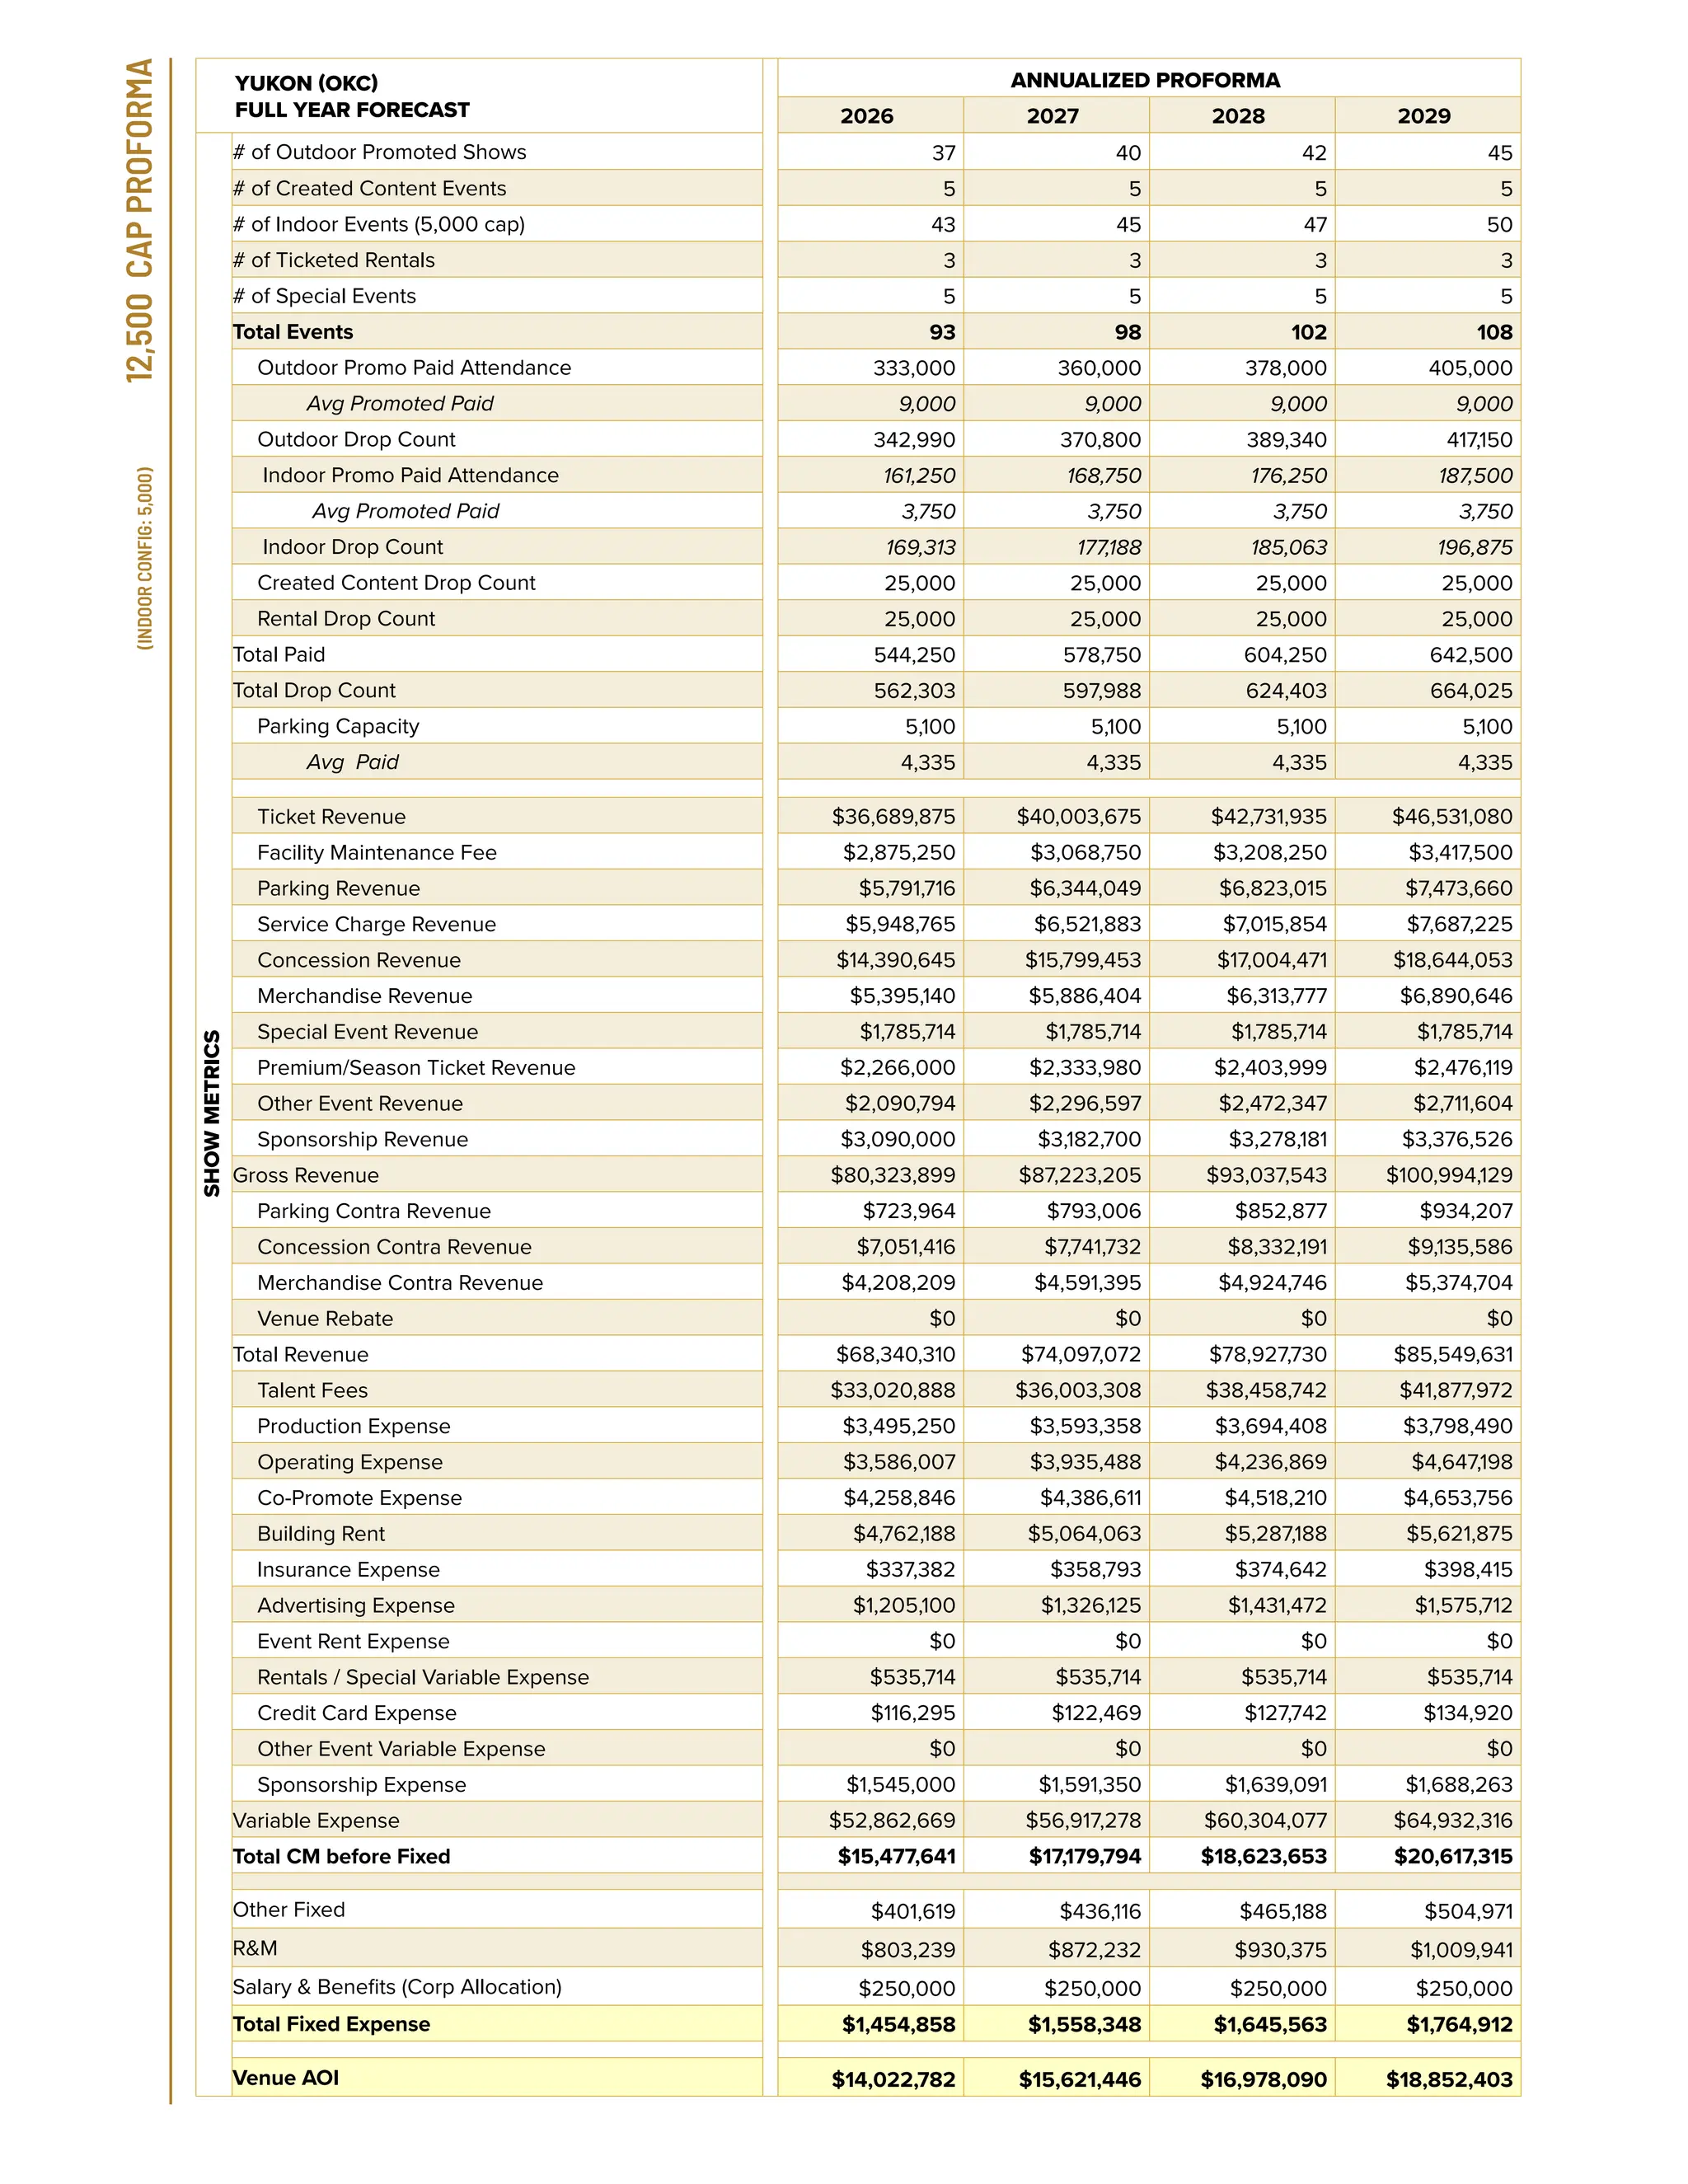
OKLAHOMA CITY, OK1
HOUSTON MARKET, TX1
Total Seats ................ 12,500
Fire Pit Suites ..................237
FP Seating Cap .............1,074
Owners Club ....................350
Lower Bowl Seats .........2,618
Mid Bowl Seats ............... 994
Upper Bowl Seats ........ 3,972
GA Seats ......................3,208
ADA ................................. 300
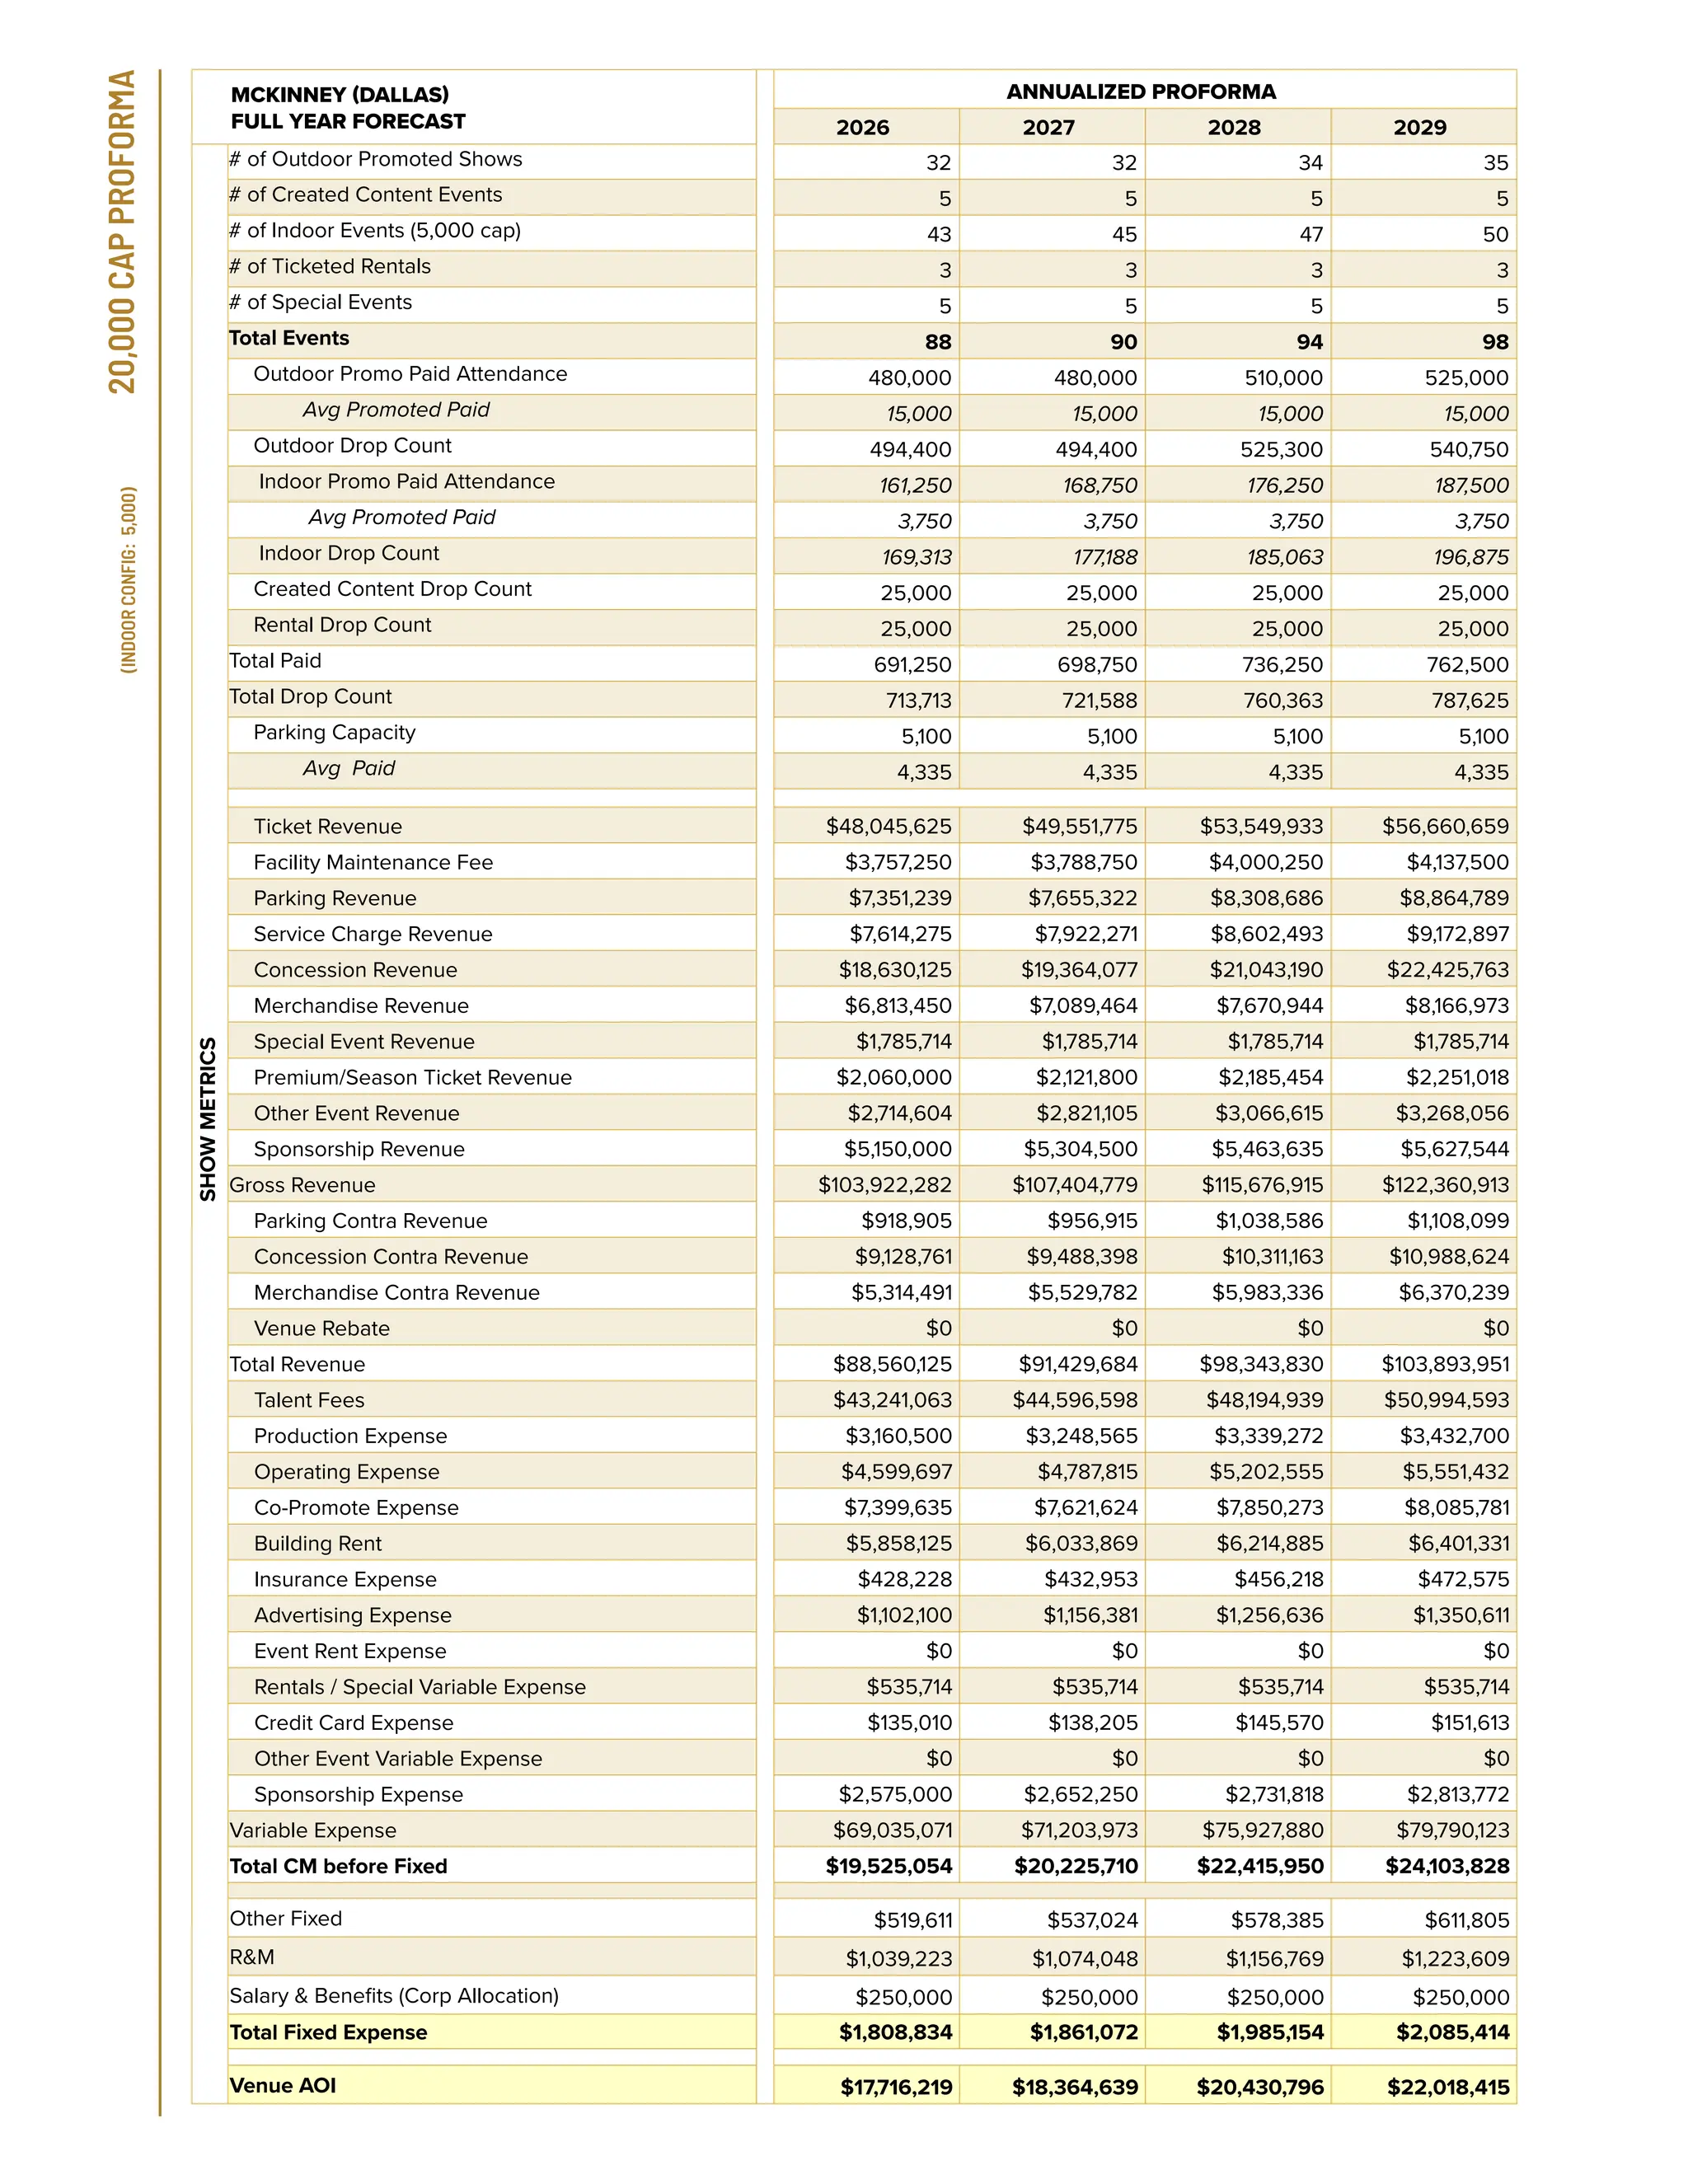
MCKINNEY, TX1
Total Seats ................20,000
Fire Pit Suites ..................327
FP Seating Cap ..............1,816
Owners Club ....................700
Lower Bowl Seats ........2,522
Mid Bowl Seats ............3,024
Upper Bowl Seats .........7,022
GA Seats .......................4,916
ADA ............included in areas
TOTAL SEATS ONCE ALL
THESE VENUES ARE OPEN
AND OPERATING
.................................79,570
SEATING CAPACITY FOR OUTDOOR AMPHITHEATER CONFIGURATION
1
Seating Capacity for multi-seasonal
configuration ~5,000
12
VENU | COMPANYOVERVIEW
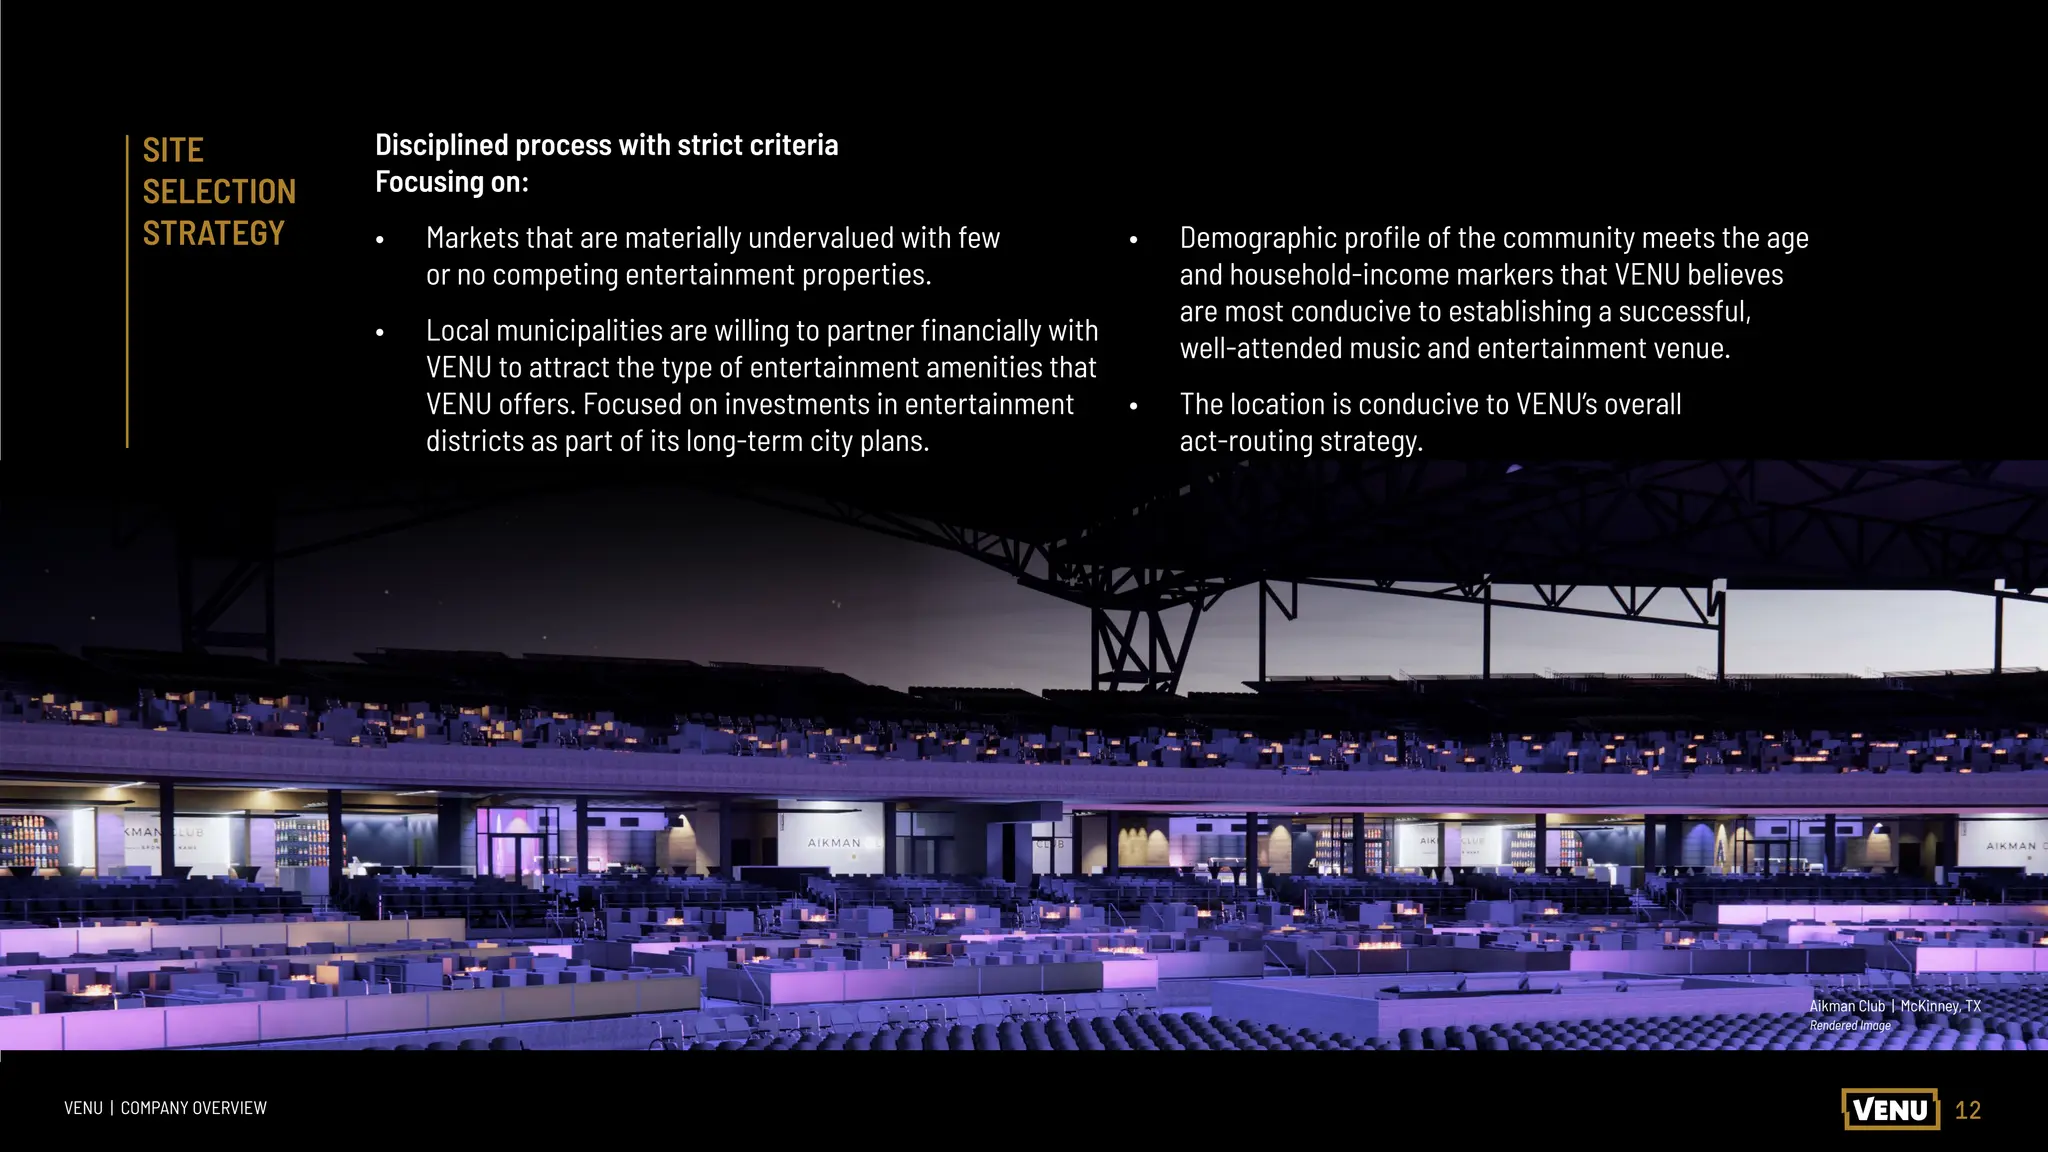
SITE
SELECTION
STRATEGY
Disciplined process with strict criteria
Focusing on:
• Markets that are materially undervalued with few
or no competing entertainment properties.
• Local municipalities are willing to partner financially with
VENU to attract the type of entertainment amenities that
VENU offers. Focused on investments in entertainment
districts as part of its long-term city plans.
• Demographic profile of the community meets the age
and household-income markers that VENU believes
are most conducive to establishing a successful,
well-attended music and entertainment venue.
• The location is conducive to VENU’s overall
act-routing strategy.
Aikman Club | McKinney, TX
Rendered Image
14
VENU | COMPANYOVERVIEW
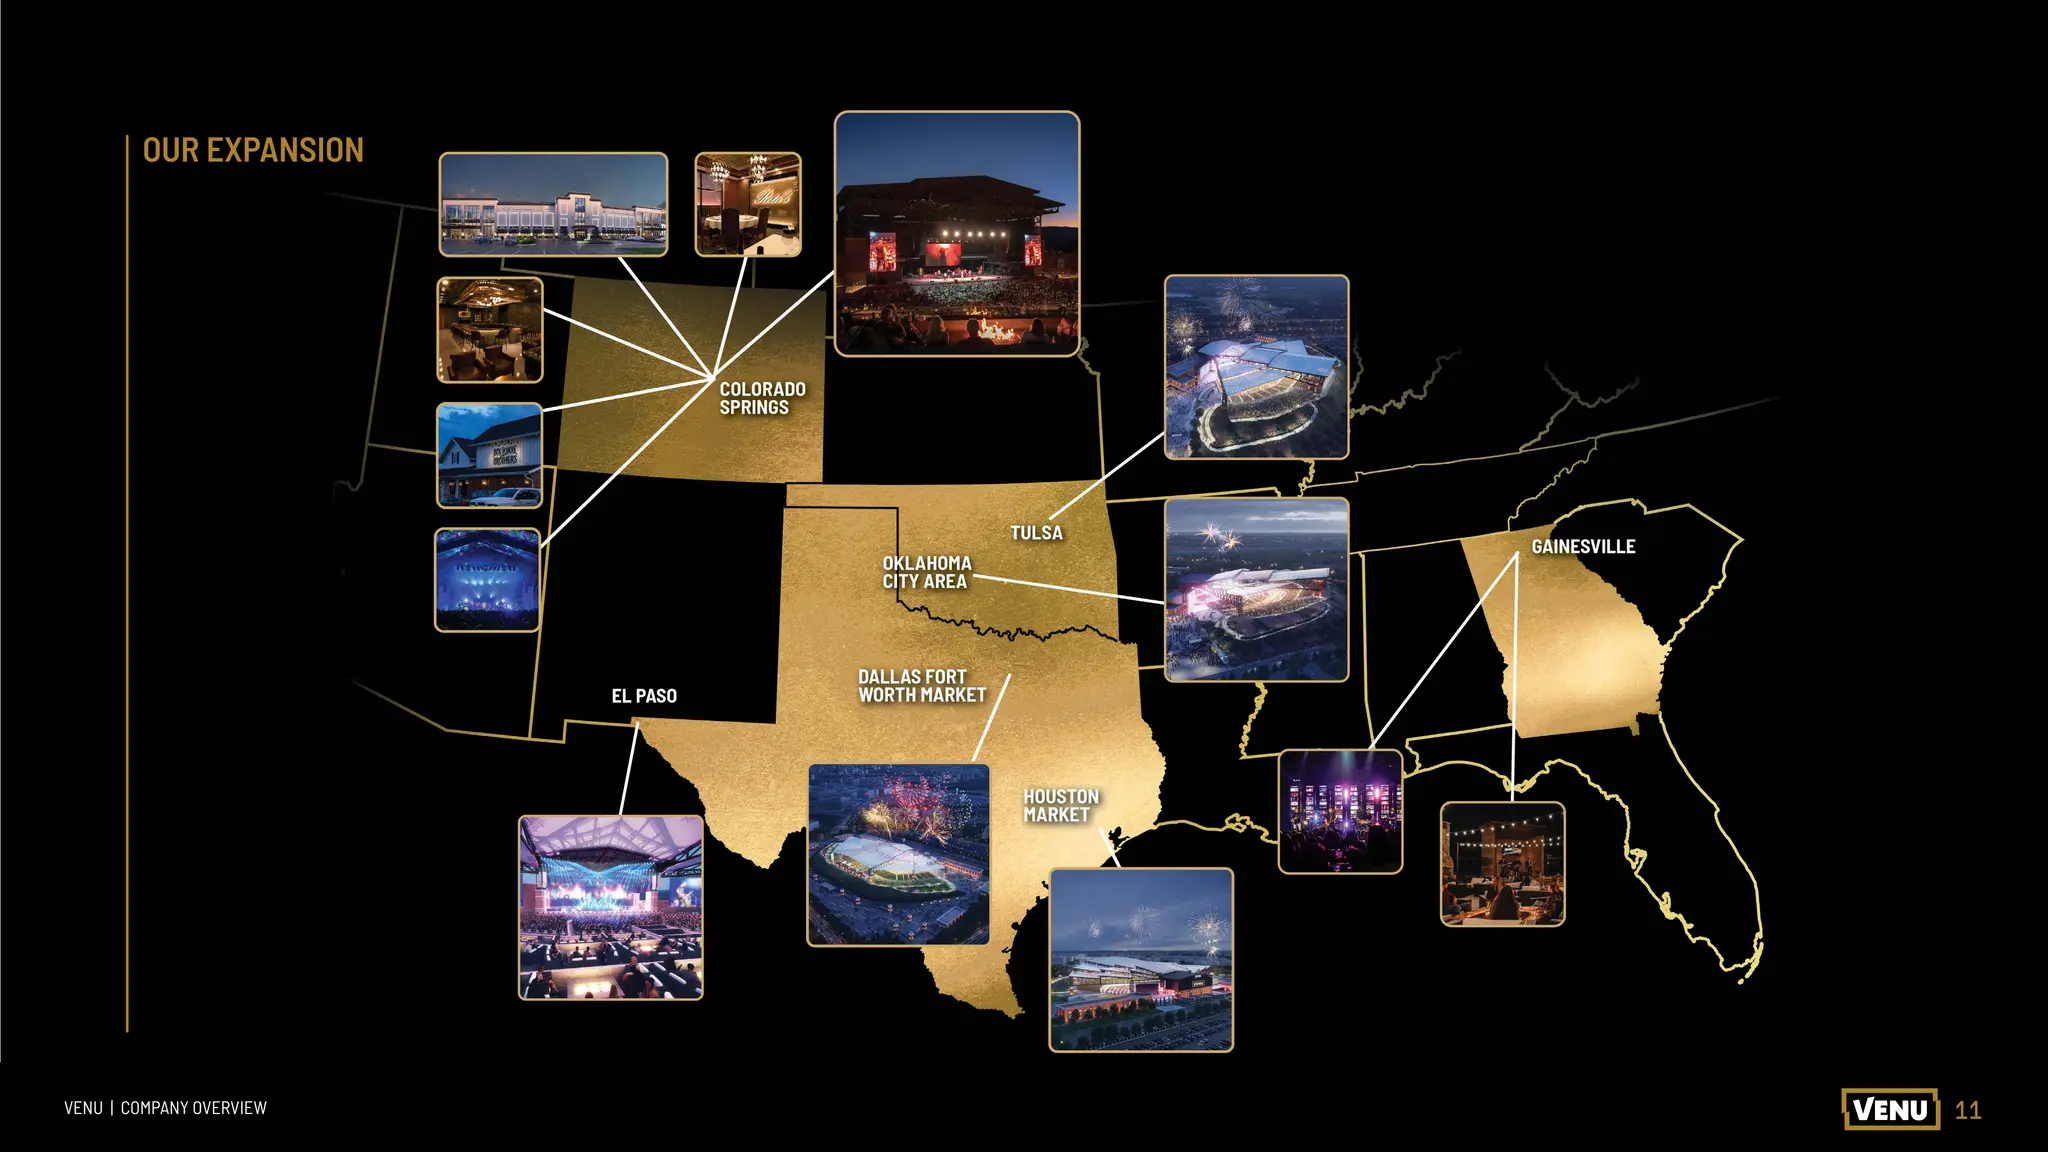
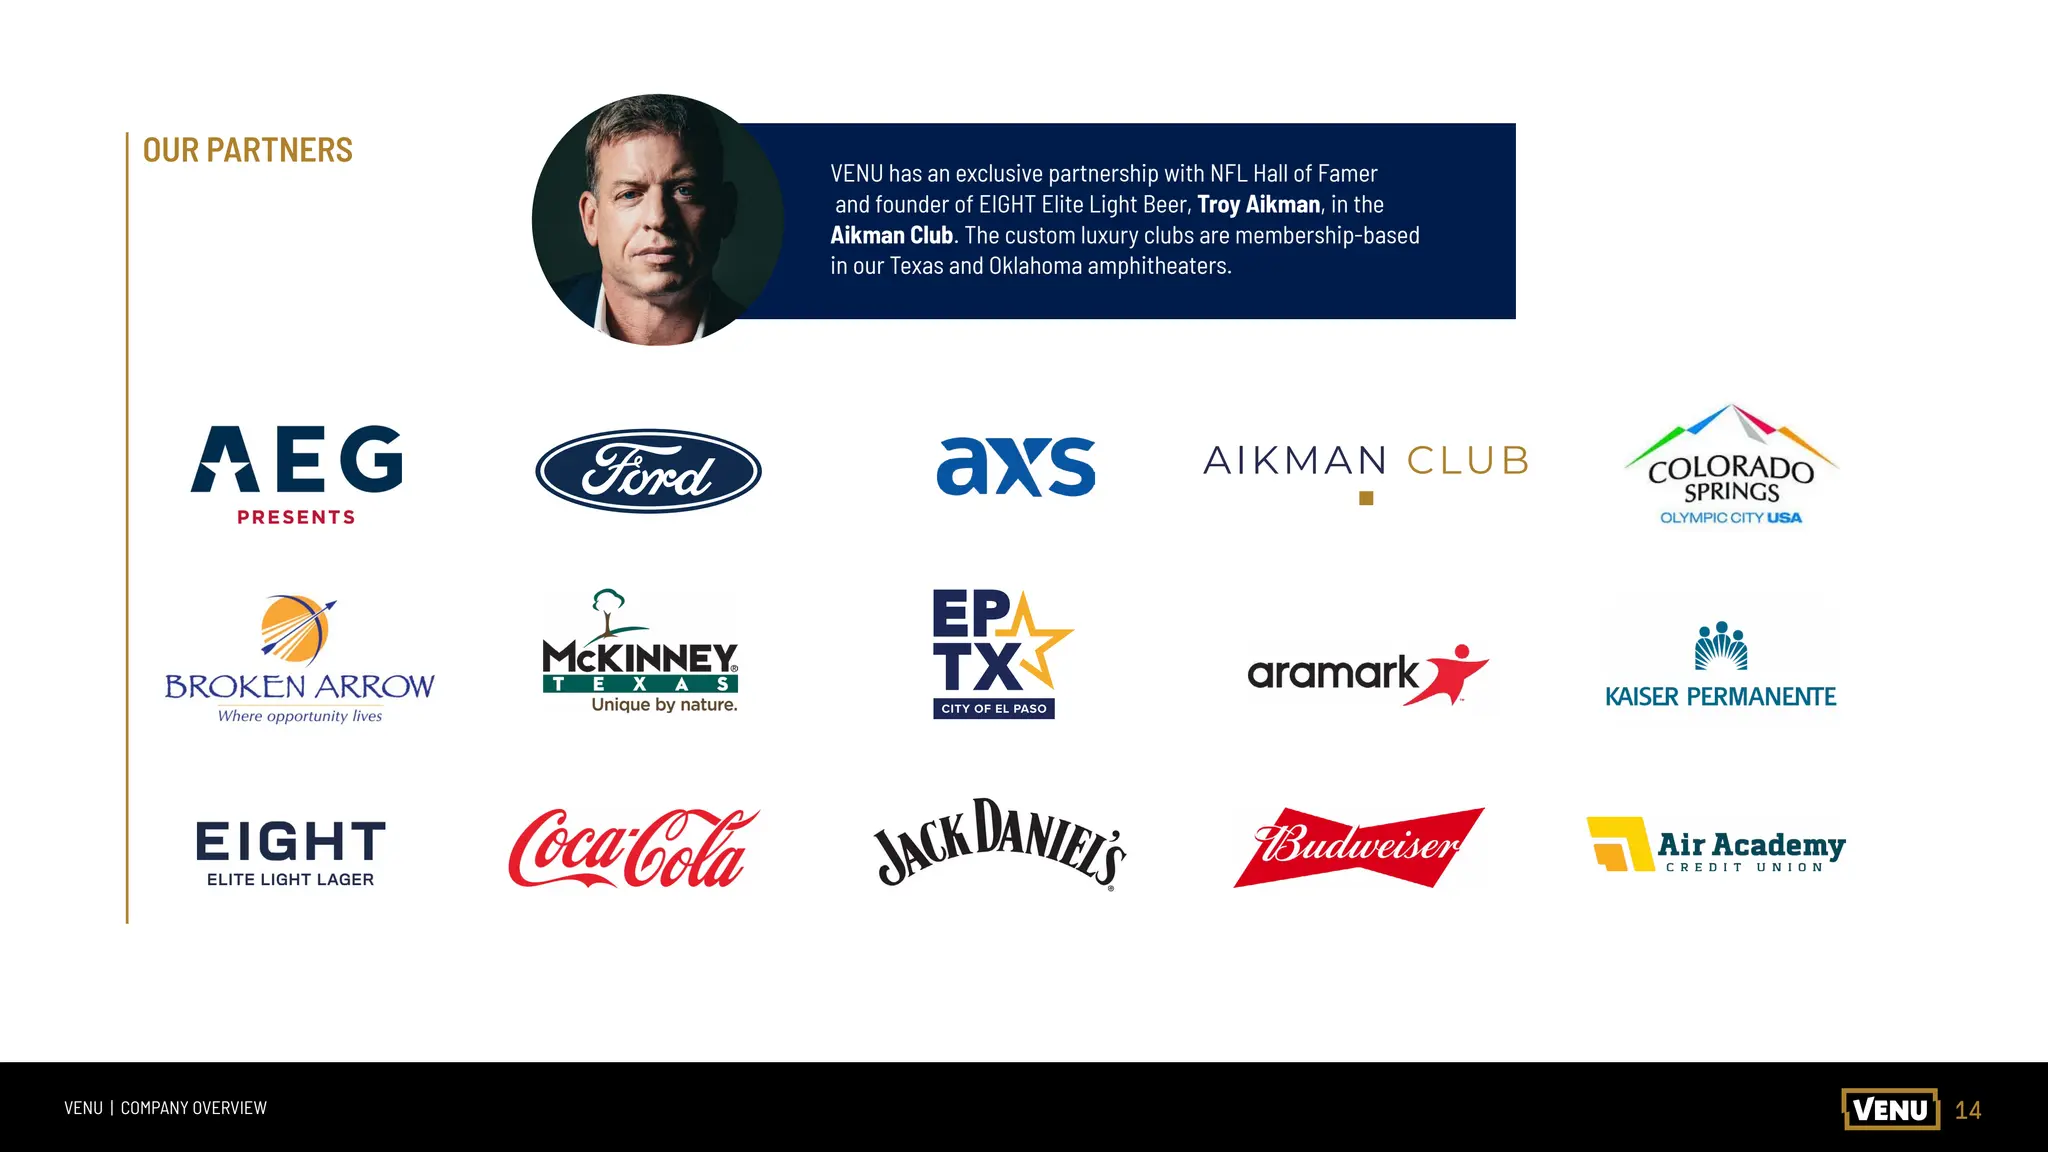
OUR PARTNERS
VENU has an exclusive partnership with NFL Hall of Famer
and founder of EIGHT Elite Light Beer, Troy Aikman, in the
Aikman Club. The custom luxury clubs are membership-based
in our Texas and Oklahoma amphitheaters.
15.
15
VENU | COMPANYOVERVIEW
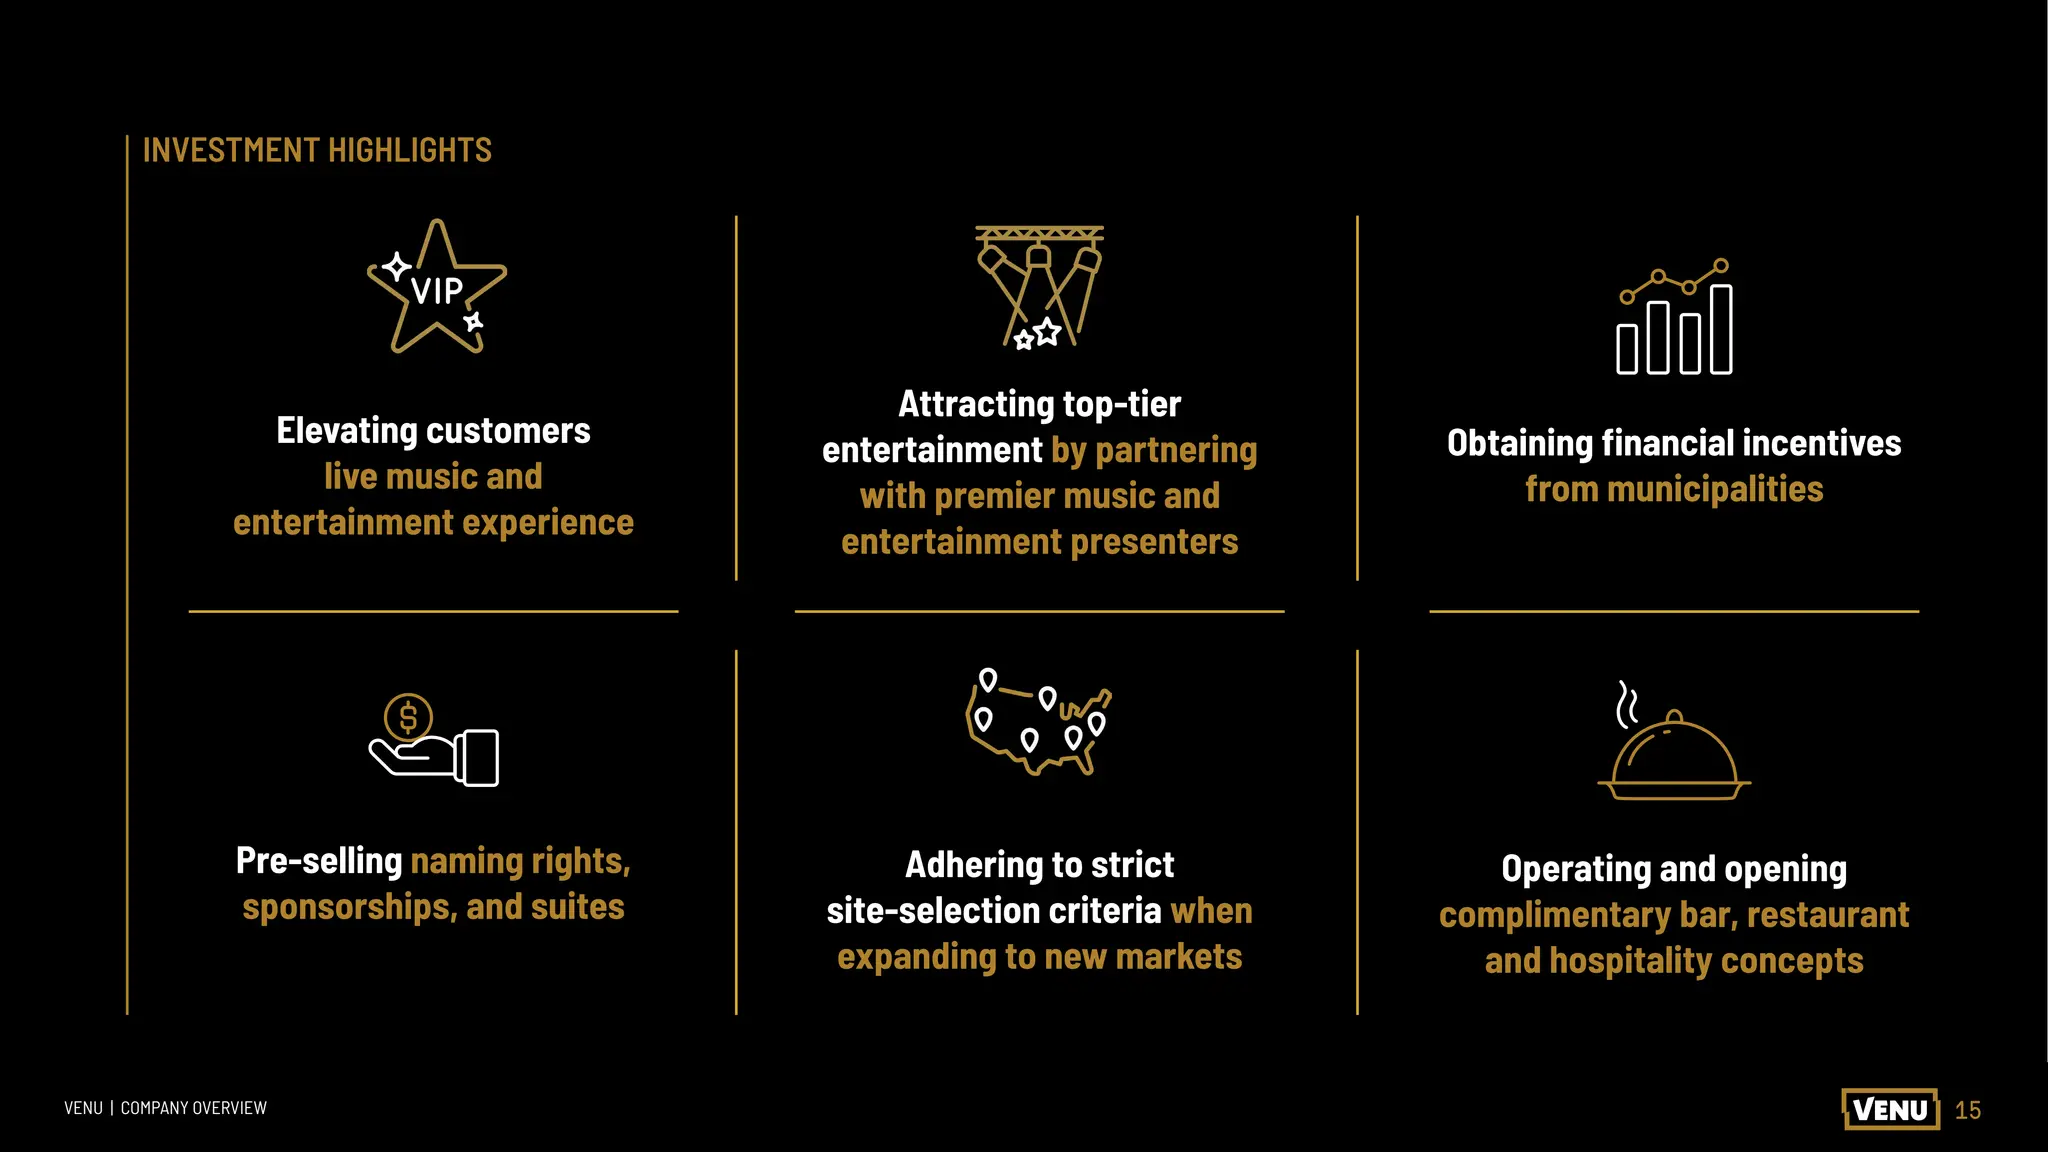
INVESTMENT HIGHLIGHTS
Pre-selling naming rights,
sponsorships, and suites
Elevating customers
live music and
entertainment experience
Attracting top-tier
entertainment by partnering
with premier music and
entertainment presenters
Adhering to strict
site-selection criteria when
expanding to new markets
Obtaining financial incentives
from municipalities
Operating and opening
complimentary bar, restaurant
and hospitality concepts
14
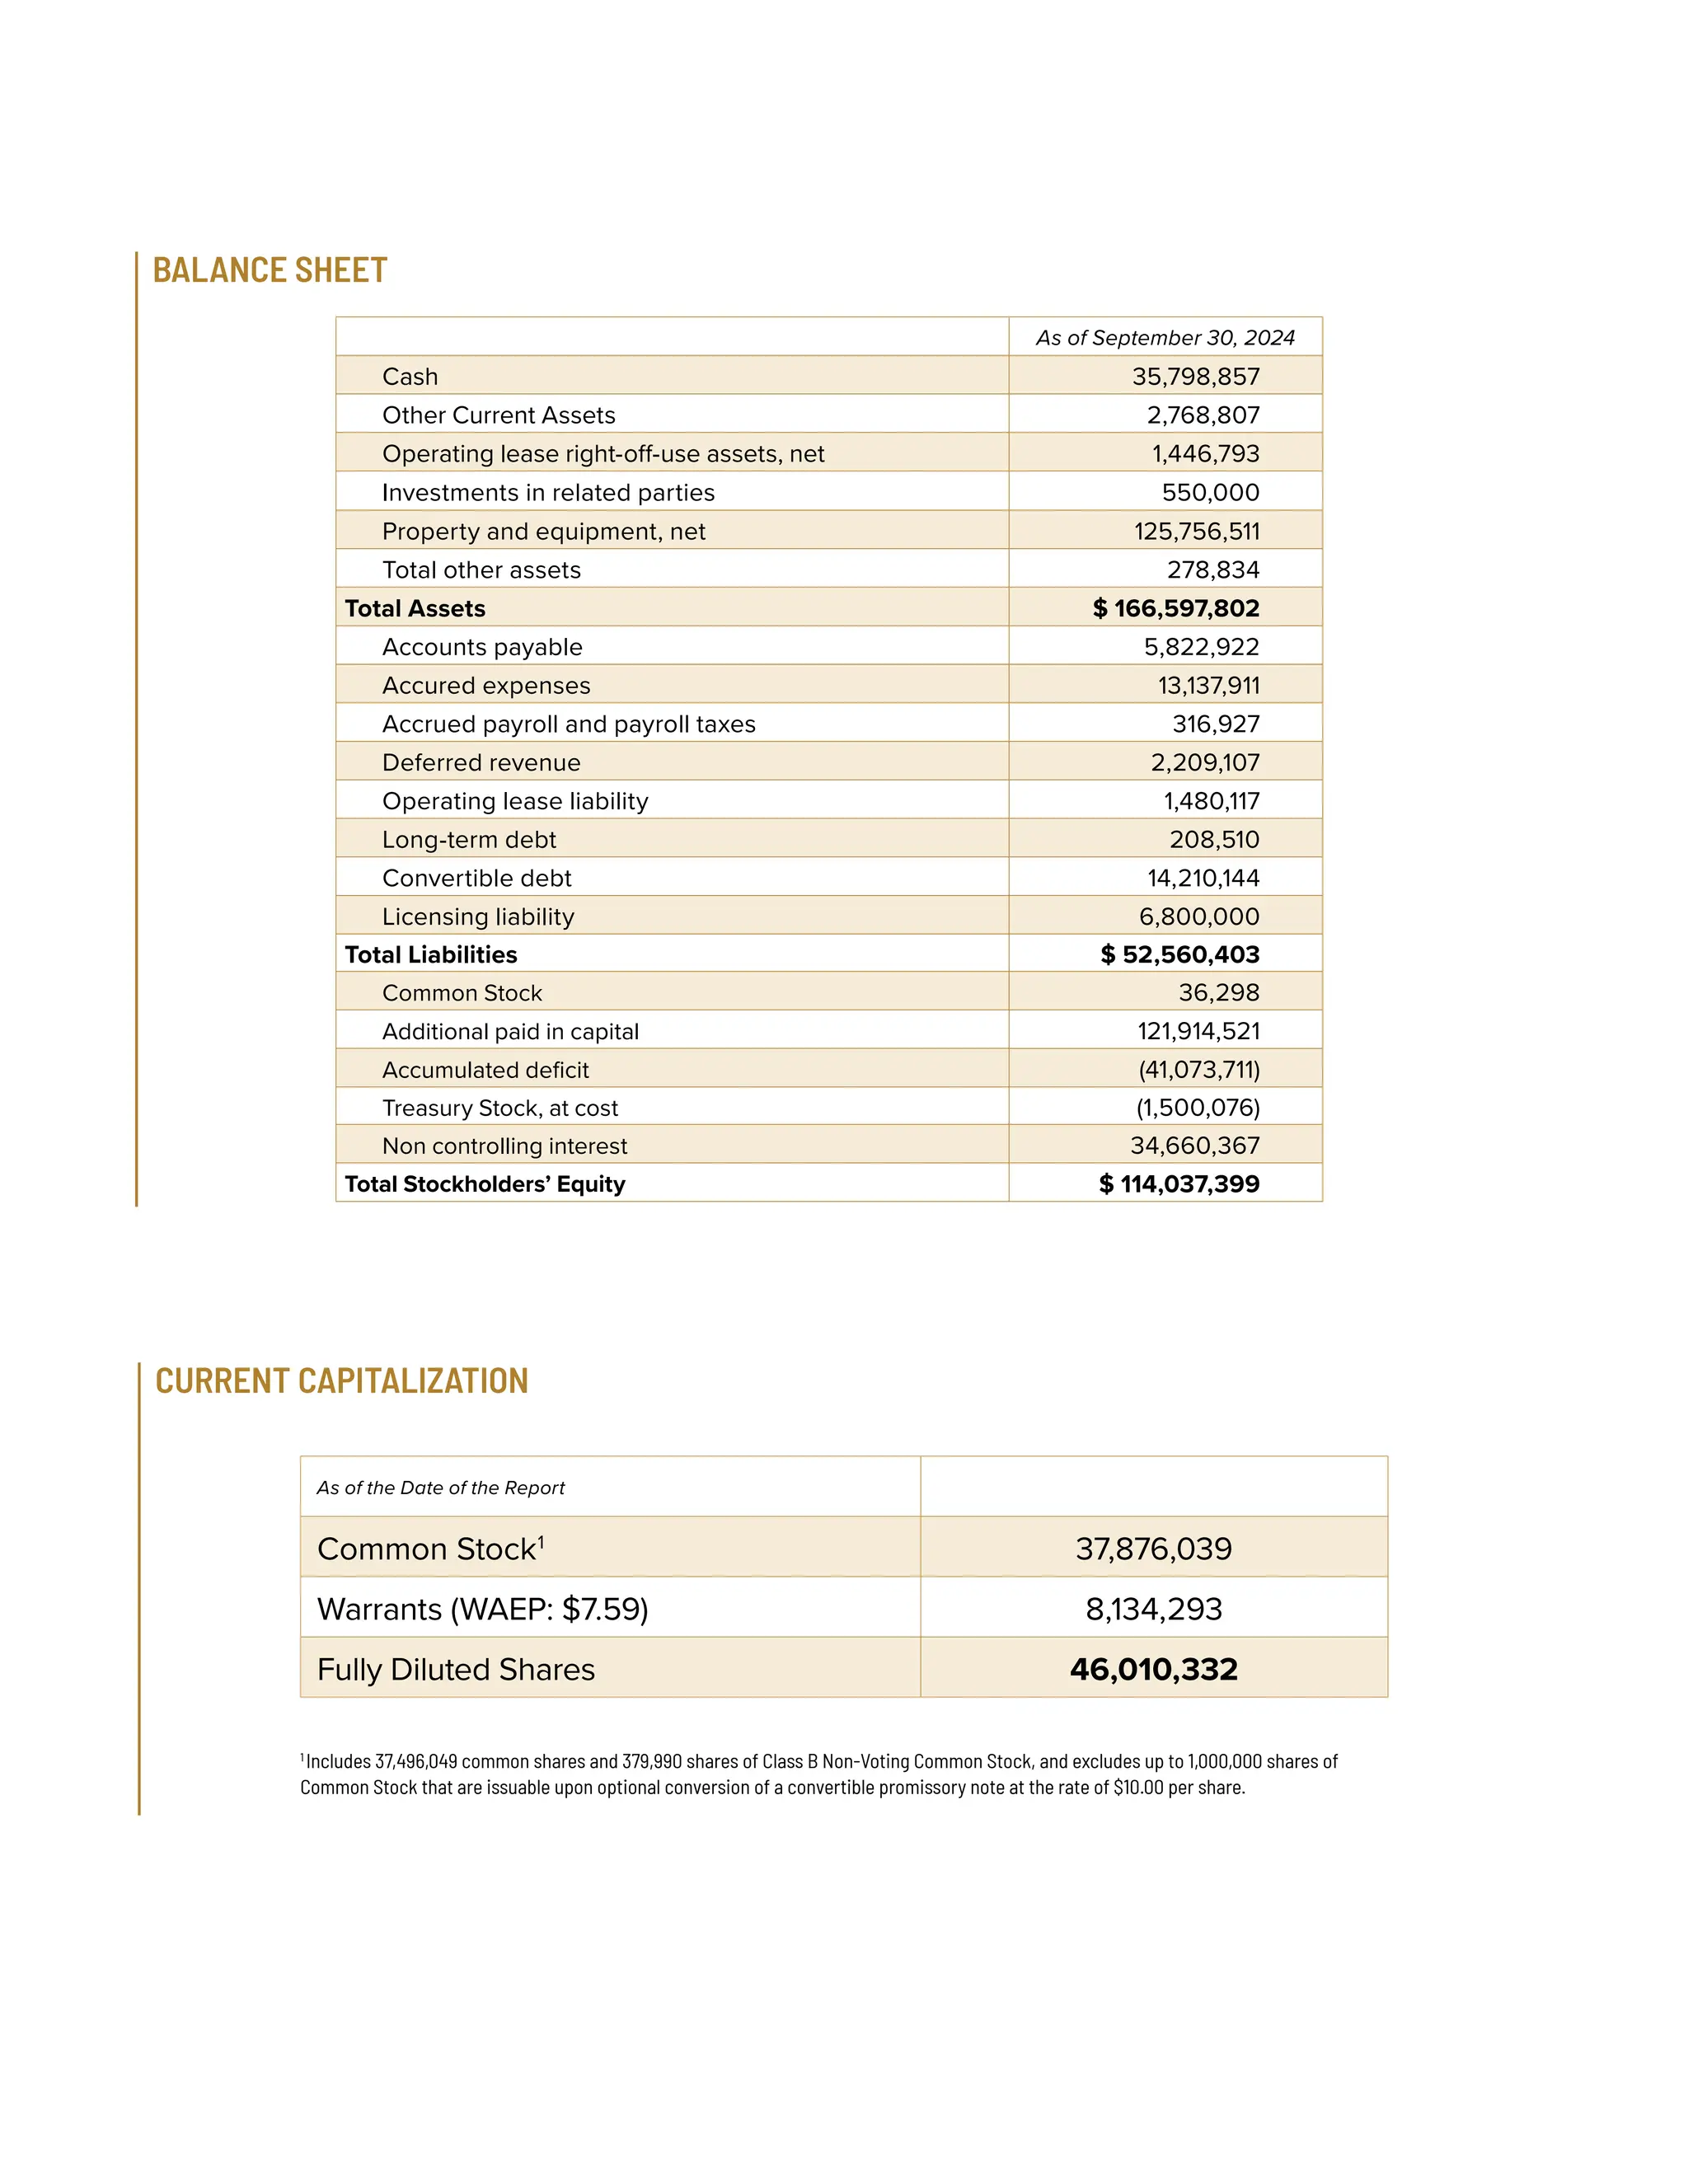
As of September30, 2024
Cash 35,798,857
Other Current Assets 2,768,807
Operating lease right-off-use assets, net 1,446,793
Investments in related parties 550,000
Property and equipment, net 125,756,511
Total other assets 278,834
Total Assets $ 166,597,802
Accounts payable 5,822,922
Accured expenses 13,137,911
Accrued payroll and payroll taxes 316,927
Deferred revenue 2,209,107
Operating lease liability 1,480,117
Long-term debt 208,510
Convertible debt 14,210,144
Licensing liability 6,800,000
Total Liabilities $ 52,560,403
Common Stock 36,298
Additional paid in capital 121,914,521
Accumulated deficit (41,073,711)
Treasury Stock, at cost (1,500,076)
Non controlling interest 34,660,367
Total Stockholders’ Equity $ 114,037,399
As of the Date of the Report
Common Stock1
37,876,039
Warrants (WAEP: $7.59) 8,134,293
Fully Diluted Shares 46,010,332
1
Includes 37,496,049 common shares and 379,990 shares of Class B Non-Voting Common Stock, and excludes up to 1,000,000 shares of
Common Stock that are issuable upon optional conversion of a convertible promissory note at the rate of $10.00 per share.
BALANCE SHEET
CURRENT CAPITALIZATION
21
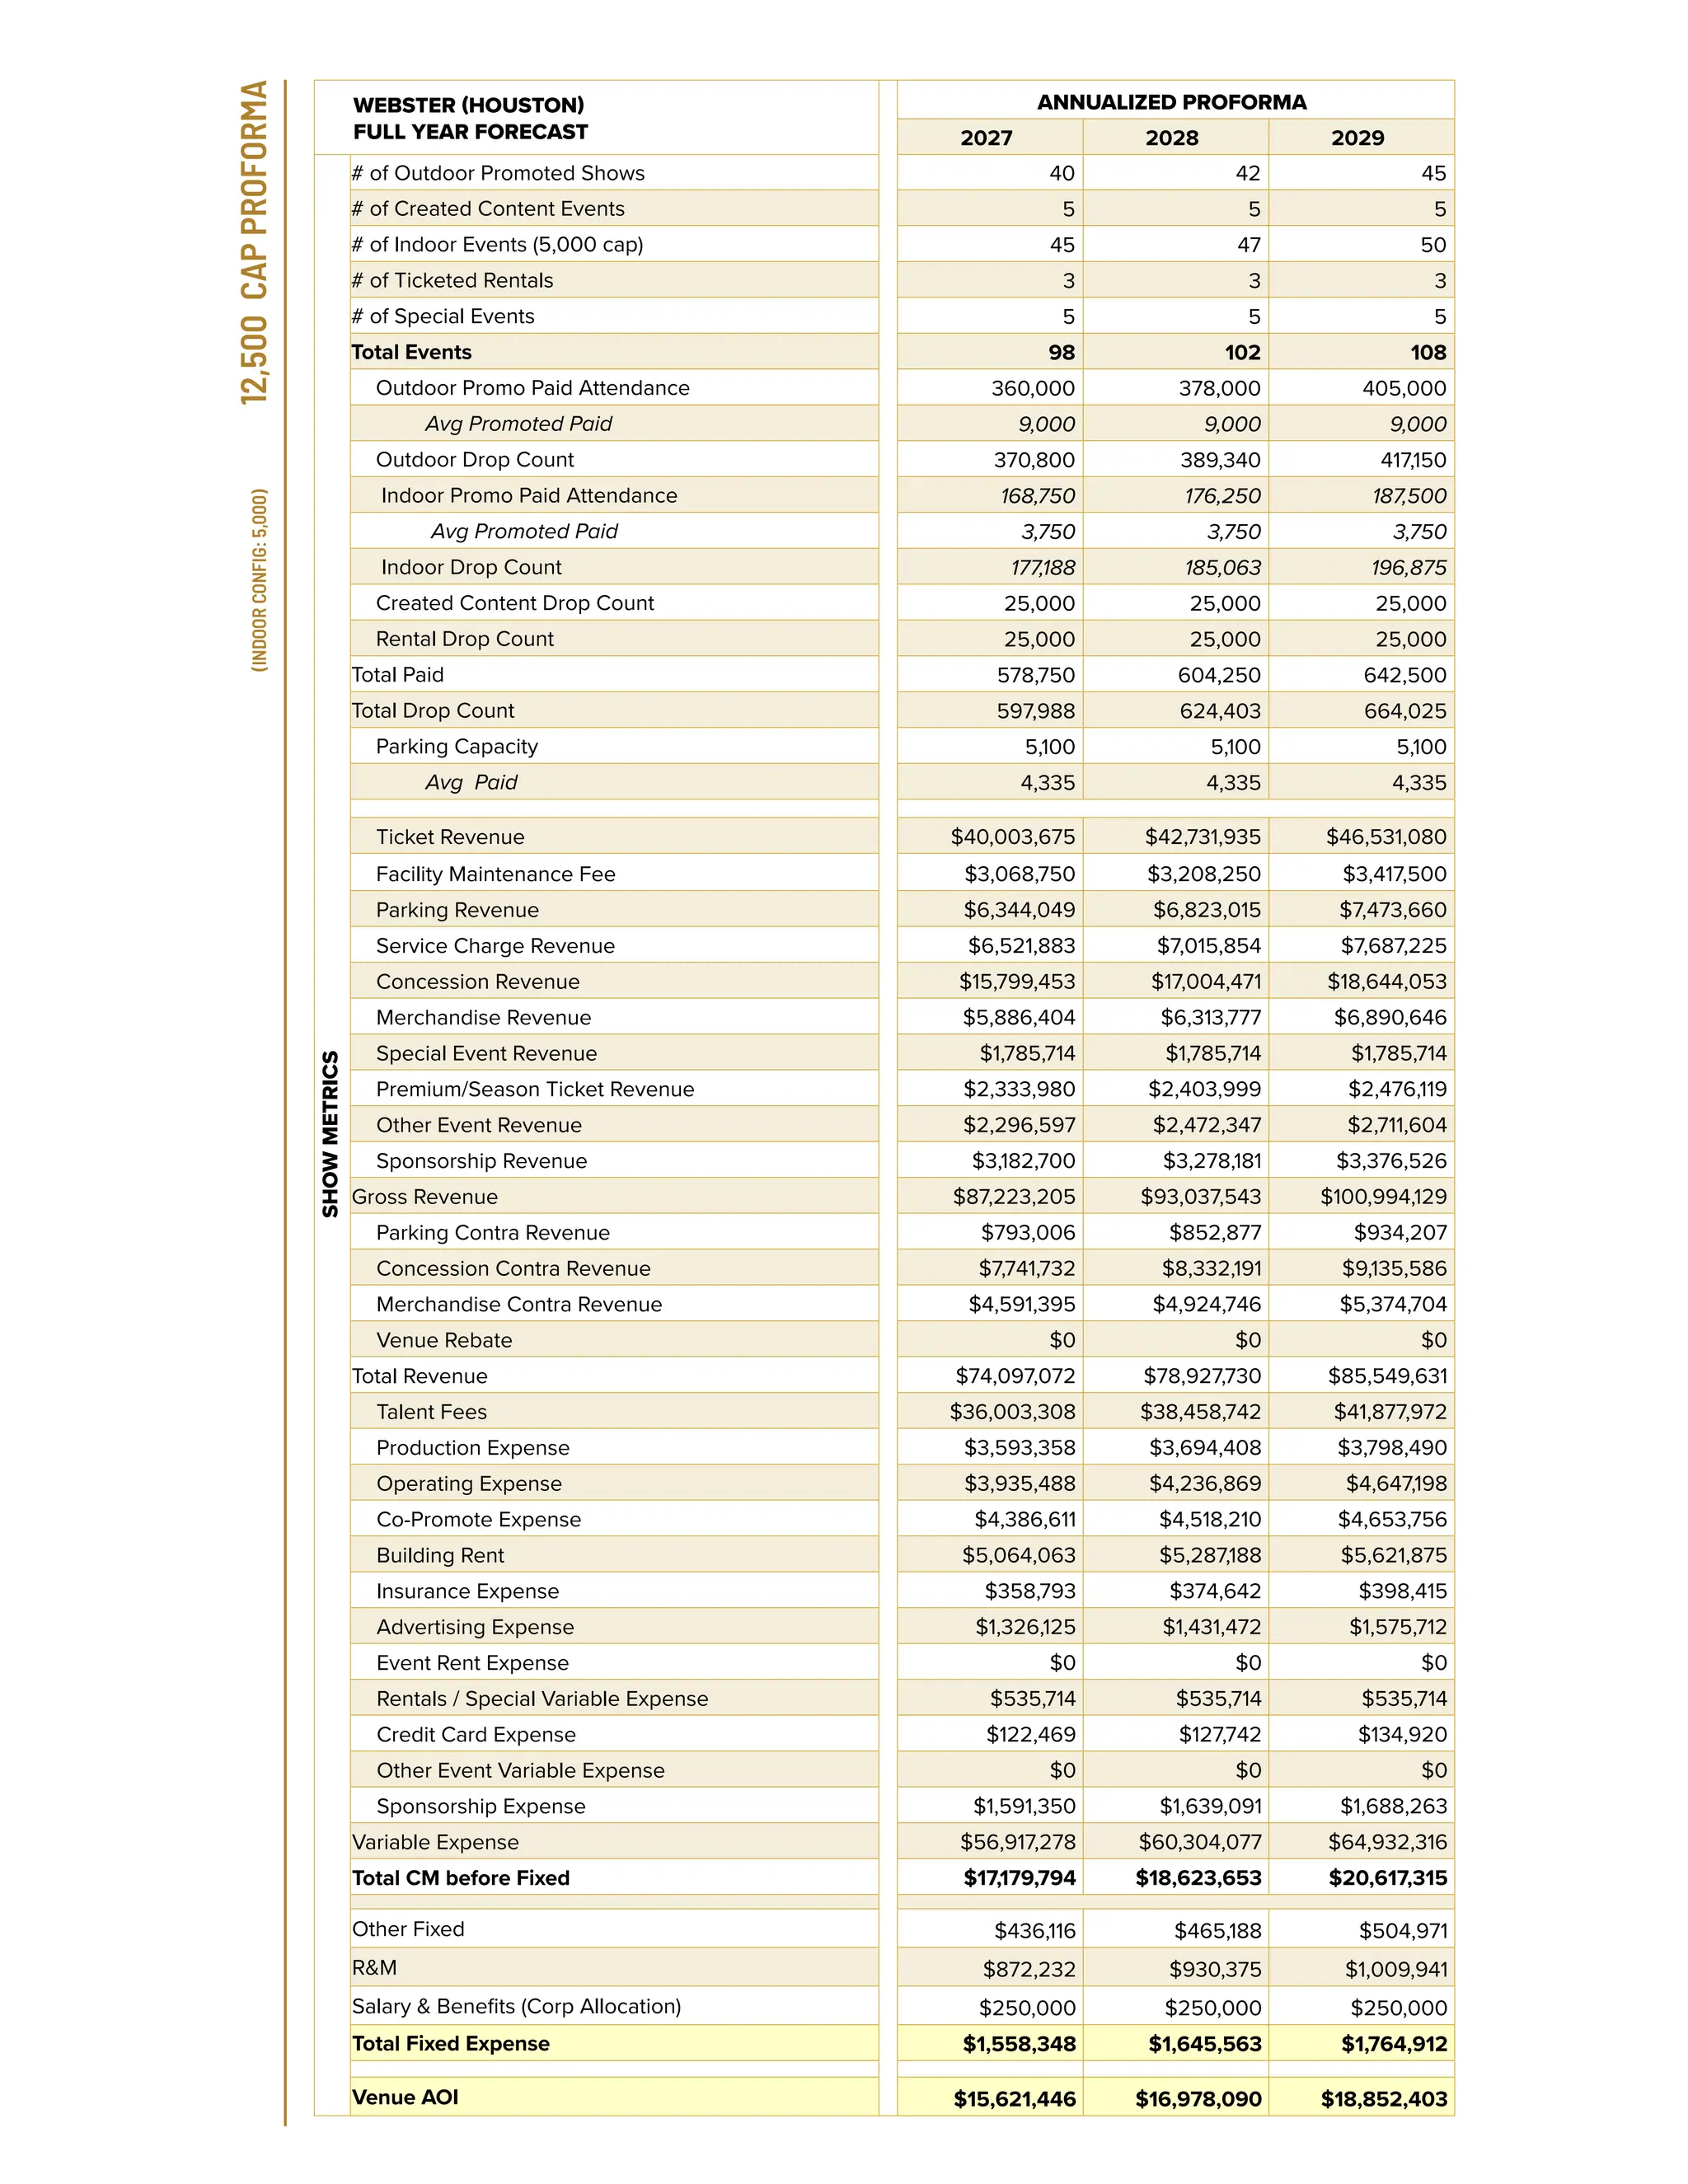
WEBSTER (HOUSTON)
FULL YEARFORECAST
ANNUALIZED PROFORMA
2027 2028 2029
SHOW
METRICS
# of Outdoor Promoted Shows 40 42 45
# of Created Content Events 5 5 5
# of Indoor Events (5,000 cap) 45 47 50
# of Ticketed Rentals 3 3 3
# of Special Events 5 5 5
Total Events 98 102 108
Outdoor Promo Paid Attendance 360,000 378,000 405,000
Avg Promoted Paid 9,000 9,000 9,000
Outdoor Drop Count 370,800 389,340 417,150
Indoor Promo Paid Attendance 168,750 176,250 187,500
Avg Promoted Paid 3,750 3,750 3,750
Indoor Drop Count 177,188 185,063 196,875
Created Content Drop Count 25,000 25,000 25,000
Rental Drop Count 25,000 25,000 25,000
Total Paid 578,750 604,250 642,500
Total Drop Count 597,988 624,403 664,025
Parking Capacity 5,100 5,100 5,100
Avg Paid 4,335 4,335 4,335
Ticket Revenue $40,003,675 $42,731,935 $46,531,080
Facility Maintenance Fee $3,068,750 $3,208,250 $3,417,500
Parking Revenue $6,344,049 $6,823,015 $7,473,660
Service Charge Revenue $6,521,883 $7,015,854 $7,687,225
Concession Revenue $15,799,453 $17,004,471 $18,644,053
Merchandise Revenue $5,886,404 $6,313,777 $6,890,646
Special Event Revenue $1,785,714 $1,785,714 $1,785,714
Premium/Season Ticket Revenue $2,333,980 $2,403,999 $2,476,119
Other Event Revenue $2,296,597 $2,472,347 $2,711,604
Sponsorship Revenue $3,182,700 $3,278,181 $3,376,526
Gross Revenue $87,223,205 $93,037,543 $100,994,129
Parking Contra Revenue $793,006 $852,877 $934,207
Concession Contra Revenue $7,741,732 $8,332,191 $9,135,586
Merchandise Contra Revenue $4,591,395 $4,924,746 $5,374,704
Venue Rebate $0 $0 $0
Total Revenue $74,097,072 $78,927,730 $85,549,631
Talent Fees $36,003,308 $38,458,742 $41,877,972
Production Expense $3,593,358 $3,694,408 $3,798,490
Operating Expense $3,935,488 $4,236,869 $4,647,198
Co-Promote Expense $4,386,611 $4,518,210 $4,653,756
Building Rent $5,064,063 $5,287,188 $5,621,875
Insurance Expense $358,793 $374,642 $398,415
Advertising Expense $1,326,125 $1,431,472 $1,575,712
Event Rent Expense $0 $0 $0
Rentals / Special Variable Expense $535,714 $535,714 $535,714
Credit Card Expense $122,469 $127,742 $134,920
Other Event Variable Expense $0 $0 $0
Sponsorship Expense $1,591,350 $1,639,091 $1,688,263
Variable Expense $56,917,278 $60,304,077 $64,932,316
Total CM before Fixed $17,179,794 $18,623,653 $20,617,315
Other Fixed $436,116 $465,188 $504,971
R&M $872,232 $930,375 $1,009,941
Salary & Benefits (Corp Allocation) $250,000 $250,000 $250,000
Total Fixed Expense $1,558,348 $1,645,563 $1,764,912
Venue AOI $15,621,446 $16,978,090 $18,852,403
12,500
CAP
PROFORMA
(INDOOR
CONFIG:
5,000)
25.
18
VENU | COMPANYOVERVIEW
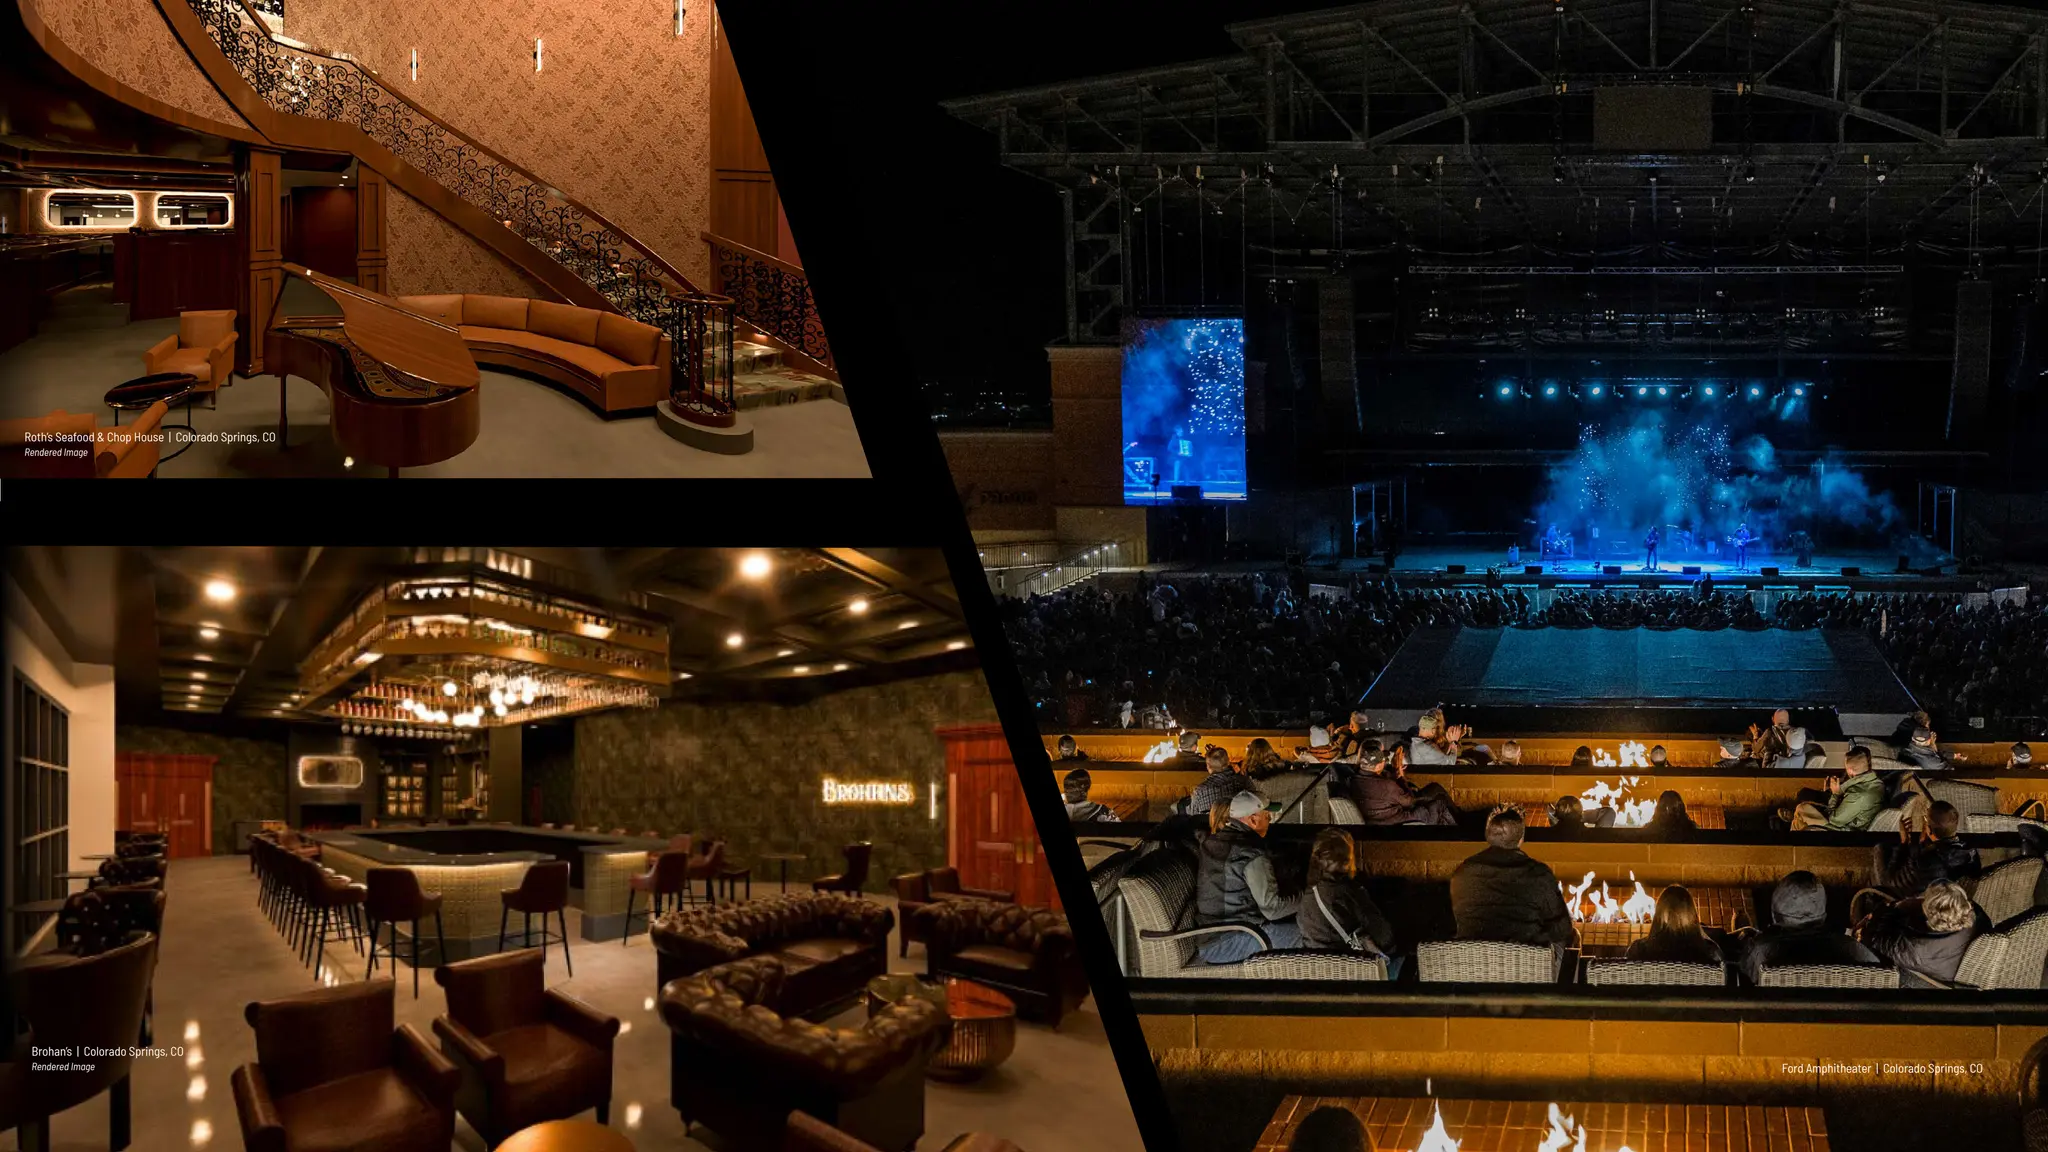
Roth’s Seafood & Chop House | Colorado Springs, CO
Rendered Image
Brohan’s | Colorado Springs, CO
Rendered Image Ford Amphitheater | Colorado Springs, CO