The document defines and provides methods for calculating market size, market share, and market growth. It states that market size is the total potential revenue from all buyers in a market. Market share is a firm's revenue as a percentage of total market revenue. Market growth is the percentage change in market size from one period to another. It then provides steps and examples for calculating each of these key market metrics.
Running page: BUSINESS MODEL 1
BUSINESS MODEL 2
Strategic Objectives
Jerry Seigle
BUS 475
Instructor: Fredric Hibbler
6/2/2015
Introduction
According to Porter (2008) the business has to survive in the market regardless of the competitors. The business need to make strategic objectives and vision that can promote competitive advantage. It is achieved by proper planning and market analysis. The importance of market analysis is to ensure that business owners are aware of the external factors that may affect the success of the enterprise. The outcome of the market analysis helps the manager to understand their strength and weaknesses.
The business trends may include; the change in demand and supply at a given period. The order will change at the time when the offer of product and services is not enough in the market. It is a pattern that arises especially in the time of low supply. The level of competition also increases or decrease in the market. The competitor ends up by developing the new products or substitute goods that are more competitive (Porter, 2008).
They try to win a larger market share so as to achieve high level of competitive advantage.
The assumptions of the business model include; the products that that are produced in the market by the company are acceptable and suitable for the customer use. The business has enough skilled workers to serve in the tactical and operational level. The company works towards the satisfaction of the client’s need. The company assumes that the stakeholders will support in finance and performance requirements.
The business may risk by targeting high number of customers through product redesigning. The redesigned product can then be introduced to the market through marketing strategies. The can also re-establish the required benchmarking standards to improve the efficiency of the business. The business owner can add more capital equipment for business work.
Strategic objectives
On shareholder value and financial perspective
The first objective is to increase the market share. The market is increased by attaining more number of customers in the market. The market share will be increased by 3% meaning that the business will increase its customer by 3%. The second objective involves the strengthening of financial facilities and resources. It means controlling the cost and increasing the revenues. The profits will be increased by 30 % while the cost will reduce by 10%. It means that the business level of profits will increase while the cost will reduce (Fahey, 1998).
Third is to increase the competitive power in the market. The power will be increased by 40% meaning the business products will have a competitive advantage in t.
Details about the Business size, Government, Employee, Supplier, Banks, Investors, Customers, competitors and Community, Methods ,Methods of measuring business size, small businesses , large businesses, and family businesses.
Sales Analysis for Management Consultants and Business AnalystsAsen Gyczew
This presentation will help you drastically improve your knowledge and skills in improving and developing sales and marketing through a series of practical cases. It is designed for people who want to become management consultants, business analysts or have to run and optimize sales and marketing on daily bases. In the course you will learn 3 things:
1. How to understand main challenges in sales and marketing
2. How to improve sales and marketing in order to increase margin and profit
3. Where to look for savings and improvements, how to calculate potential savings in Excel and implement them
The presentation is based on my 14 years of experience as a consultant in top consulting companies and as a Board Member responsible for strategy, improvement and turn-arounds in biggest companies from Retail, FMCG, SMG, B2B and services sector that I worked for.
This is part of my online course on Supply Chain for Management Consultants. Check the link to get a discount: http://bit.ly/SalesAnalysisManagementConsulting
Analyze the present scenario of the firm with revenue generated and net profit earned with the aid of this content ready Organic Growth PowerPoint Presentation Slides. Present the firm's current markets share as compared to its competitors using the professionally designed incremental growth PPT slideshow. Provide information about your competitors that are currently existing in the market and how they are growing their business organically and inorganically. Take the assistance of the visually appealing revenue growth PowerPoint templates to assess business priorities that are crucial for growth such as market share, competitive advantage, quality improvement, sales growth, etc. Utilize the topic-specific business growth strategy PowerPoint complete deck to analyze possible future events such as expected units of sales, revenue generated and Capex, etc. You can also use the growth planning PPT graphics to focus on existing customers that can increase brand loyalty. Thus download this ready-to-use organic growth strategy PowerPoint presentation to maximize customer outreach. Convince them you have the expertise with our Organic Growth PowerPoint Presentation Slides. They help demonstrate your authority. https://bit.ly/2W4cXwR
Business Analysis PowerPoint Presentation SlidesSlideTeam
Identify new business opportunities with the aid of our content ready Business Analysis PowerPoint Presentation Slides. Take the assistance of the professionally designed enterprise analysis PPT slideshow to illustrate problems faced by manufacturing companies such as inflexible manufacturing processes, inventory turnover ratio, etc. Demonstrate monthly milestones achieved by your company using this visually appealing requirement analysis PPT slides. The strategic business planning PowerPoint complete deck contains forty-three ready to use templates that help you to display the company’s market share in both domestic and global markets with its competitors. Utilize the company’s performance assessment PPT slides to showcase revenue split by quarter, geography, product, and segment. Talk about current methods to maintain product quality and advanced methods to improve it. You can also use the enterprise planning and assessment PowerPoint templates to represent the current performance status of your company. Thus, download our topic-specific business planning PowerPoint presentation to create a dashboard for measuring business performance. Our Business Analysis PowerPoint Presentation Slides ensure a full circle. You will get to experience completeness. https://bit.ly/2W37HKe
The global retail and wholesale market was valued at more than $3 trillion in 2017. Asia Pacific was the largest region in the retail and wholesale market in 2017, accounting for 29% market share. The USA was the largest country in the market in 2017, accounting for 20% market share.
Read Report
https://www.thebusinessresearchcompany.com/report/retail-and-wholesale-global-market-report-2018
Falcon stands out as a top-tier P2P Invoice Discounting platform in India, bridging esteemed blue-chip companies and eager investors. Our goal is to transform the investment landscape in India by establishing a comprehensive destination for borrowers and investors with diverse profiles and needs, all while minimizing risk. What sets Falcon apart is the elimination of intermediaries such as commercial banks and depository institutions, allowing investors to enjoy higher yields.
As a business owner in Delaware, staying on top of your tax obligations is paramount, especially with the annual deadline for Delaware Franchise Tax looming on March 1. One such obligation is the annual Delaware Franchise Tax, which serves as a crucial requirement for maintaining your company’s legal standing within the state. While the prospect of handling tax matters may seem daunting, rest assured that the process can be straightforward with the right guidance. In this comprehensive guide, we’ll walk you through the steps of filing your Delaware Franchise Tax and provide insights to help you navigate the process effectively.
Business Valuation Principles for EntrepreneursBen Wann
This insightful presentation is designed to equip entrepreneurs with the essential knowledge and tools needed to accurately value their businesses. Understanding business valuation is crucial for making informed decisions, whether you're seeking investment, planning to sell, or simply want to gauge your company's worth.
Explore our most comprehensive guide on lookback analysis at SafePaaS, covering access governance and how it can transform modern ERP audits. Browse now!
Buy Verified PayPal Account | Buy Google 5 Star Reviewsusawebmarket
Buy Verified PayPal Account
Looking to buy verified PayPal accounts? Discover 7 expert tips for safely purchasing a verified PayPal account in 2024. Ensure security and reliability for your transactions.
PayPal Services Features-
🟢 Email Access
🟢 Bank Added
🟢 Card Verified
🟢 Full SSN Provided
🟢 Phone Number Access
🟢 Driving License Copy
🟢 Fasted Delivery
Client Satisfaction is Our First priority. Our services is very appropriate to buy. We assume that the first-rate way to purchase our offerings is to order on the website. If you have any worry in our cooperation usually You can order us on Skype or Telegram.
24/7 Hours Reply/Please Contact
usawebmarketEmail: support@usawebmarket.com
Skype: usawebmarket
Telegram: @usawebmarket
WhatsApp: +1(218) 203-5951
USA WEB MARKET is the Best Verified PayPal, Payoneer, Cash App, Skrill, Neteller, Stripe Account and SEO, SMM Service provider.100%Satisfection granted.100% replacement Granted.
What are the main advantages of using HR recruiter services.pdfHumanResourceDimensi1
HR recruiter services offer top talents to companies according to their specific needs. They handle all recruitment tasks from job posting to onboarding and help companies concentrate on their business growth. With their expertise and years of experience, they streamline the hiring process and save time and resources for the company.
[Note: This is a partial preview. To download this presentation, visit:
https://www.oeconsulting.com.sg/training-presentations]
Sustainability has become an increasingly critical topic as the world recognizes the need to protect our planet and its resources for future generations. Sustainability means meeting our current needs without compromising the ability of future generations to meet theirs. It involves long-term planning and consideration of the consequences of our actions. The goal is to create strategies that ensure the long-term viability of People, Planet, and Profit.
Leading companies such as Nike, Toyota, and Siemens are prioritizing sustainable innovation in their business models, setting an example for others to follow. In this Sustainability training presentation, you will learn key concepts, principles, and practices of sustainability applicable across industries. This training aims to create awareness and educate employees, senior executives, consultants, and other key stakeholders, including investors, policymakers, and supply chain partners, on the importance and implementation of sustainability.
LEARNING OBJECTIVES
1. Develop a comprehensive understanding of the fundamental principles and concepts that form the foundation of sustainability within corporate environments.
2. Explore the sustainability implementation model, focusing on effective measures and reporting strategies to track and communicate sustainability efforts.
3. Identify and define best practices and critical success factors essential for achieving sustainability goals within organizations.
CONTENTS
1. Introduction and Key Concepts of Sustainability
2. Principles and Practices of Sustainability
3. Measures and Reporting in Sustainability
4. Sustainability Implementation & Best Practices
To download the complete presentation, visit: https://www.oeconsulting.com.sg/training-presentations
India Orthopedic Devices Market: Unlocking Growth Secrets, Trends and Develop...Kumar Satyam
According to TechSci Research report, “India Orthopedic Devices Market -Industry Size, Share, Trends, Competition Forecast & Opportunities, 2030”, the India Orthopedic Devices Market stood at USD 1,280.54 Million in 2024 and is anticipated to grow with a CAGR of 7.84% in the forecast period, 2026-2030F. The India Orthopedic Devices Market is being driven by several factors. The most prominent ones include an increase in the elderly population, who are more prone to orthopedic conditions such as osteoporosis and arthritis. Moreover, the rise in sports injuries and road accidents are also contributing to the demand for orthopedic devices. Advances in technology and the introduction of innovative implants and prosthetics have further propelled the market growth. Additionally, government initiatives aimed at improving healthcare infrastructure and the increasing prevalence of lifestyle diseases have led to an upward trend in orthopedic surgeries, thereby fueling the market demand for these devices.
Remote sensing and monitoring are changing the mining industry for the better. These are providing innovative solutions to long-standing challenges. Those related to exploration, extraction, and overall environmental management by mining technology companies Odisha. These technologies make use of satellite imaging, aerial photography and sensors to collect data that might be inaccessible or from hazardous locations. With the use of this technology, mining operations are becoming increasingly efficient. Let us gain more insight into the key aspects associated with remote sensing and monitoring when it comes to mining.
RMD24 | Retail media: hoe zet je dit in als je geen AH of Unilever bent? Heid...BBPMedia1
Grote partijen zijn al een tijdje onderweg met retail media. Ondertussen worden in dit domein ook de kansen zichtbaar voor andere spelers in de markt. Maar met die kansen ontstaan ook vragen: Zelf retail media worden of erop adverteren? In welke fase van de funnel past het en hoe integreer je het in een mediaplan? Wat is nu precies het verschil met marketplaces en Programmatic ads? In dit half uur beslechten we de dilemma's en krijg je antwoorden op wanneer het voor jou tijd is om de volgende stap te zetten.
RMD24 | Retail media: hoe zet je dit in als je geen AH of Unilever bent? Heid...
calculation.ppt
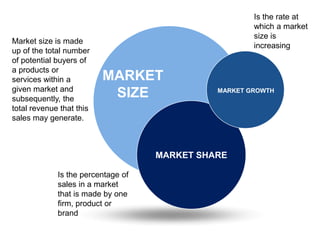
1. MARKET
SIZE
MARKET SHARE
MARKET GROWTH
Market size is made
up of the total number
of potential buyers of
a products or
services within a
given market and
subsequently, the
total revenue that this
sales may generate.
Is the percentage of
sales in a market
that is made by one
firm, product or
brand
Is the rate at
which a market
size is
increasing
2. Market Size Steps
1. Identifying total potential market
2. Identify target market
3. Determine penetration potential
4. Multiply target market by penetration
potential
HOW TO CALCULATE MARKET SIZE
3. Market Value (Potential
Revenue Example)
Each store sells
20,000/yr
400 stores x 20,000 = 8M
Market Size Example
Total potential market =
50,000 stores
Target market = 1,000
stores
Penetration potential = 40%
success rate
1,000 stores x 40 %
success rate = 400 stores
Number of Target Market (customers) X Purchases in
given period of time = Market Volume/Size
Market Size = Sales/Market share X 100
4. We know that Company A's total
sales revenue in 2021 was P550,000, and
its market share is 7 per cent.
Marketsize=P550,0000.07=P7,857,143
The market size is P7,857,143.
5. MARKET SHARE
Firm’s Revenue
X 100
Market Revenue
Example:
In a given year TJ dealership
had sales revenue of
P310,000. In that same year
P2,000,000 worth of revenue
was made in the automotive
industry. Calculate the market
share for TJ dealership.
310,000/2,000,000x100
= 15.5%
HOW TO CALCULATE MARKET SHARE
6. MARKET GROWTH
New Market Size – Old Market Size
X 100
Old Market Size
Ex:
Market growth in 2021 P2,000,000
Market growth in 2022 P2,600,000
2,600,000 – 2,000,000
X 100
2,000,000
= 30%
HOW TO CALCULATE MARKET GROWTH
7. Market growth measures how much a market has changed. It represents
the rate at which the market is increasing (or decreasing in some cases).
It measures the percentage of change in the market between two
years. Market growth is not the same as sales growth. Sales growth is the
change in the number of sales between two years.
Just because sales during a certain period have increased does not mean
that market share has also increased. In a growing market, sales often
increase due to the general growth of the market, especially when
compared to other, more stagnant markets. Increased sales do not
automatically mean increased market share.
Change in total sales
X 100
Total sales in first year
Sales Growth
8. The size of the market in 2019 was £1.7
million. The size of the market in 2020 is
£2 million. What is the market growth rate
of this market?
17.65%
In 2019, Company X's total sales were
£700,000. In 2020 Company X's total sales
amount to £750,000. What is the total
sales growth of Company X?
7.14%
9. Calculating Market Size (per period)
1. Number of units sold in market (per period) Units 100,000
Average selling price (P) in market SP 15.00
Market size = MSize
2. Firm's revenues (per period) Revs P250,000
Market Share (%) MShare 5.0%
Market size = MSize
3. Number of units sold (qty) in period Units 5,000
Average selling price (P) SP 20
Firm's Sales Revenue = Revs
4. Market size (P) MSize P2,000,000
Firm's Market share (%) MShare 5.0%
Firm's Sales Revenue = Revs
10. Market Share
5. Your company sells notebooks and planners and your total revenue for a
fiscal quarter is P200,000. During that same fiscal period, total industry
sales were P2,000,000.
=
6. Grayson Auto is a domestic company that manufactures non-luxury
vehicles. The company earned P60 billion in revenue in 2022. The auto
industry as a whole had P900 billion in revenue.
Market share =
7. In 2022, Grayson Auto sold 4 million vehicles. The worldwide auto
industry as a whole sold 60 million vehicles.
Market share =
11. 8. Market Size (P) This Year (Y1) Y1 P4,600,000
Market Size (P) Last Year (Y0) Y0 P4,200,000
Change in Market Size (P) (Y1 - Y0)
Market Growth
12. How to increase your market share
Here are a few strategies you can use to increase your company’s market share:
Lower prices: Pricing your product below the market could provide a competitive
advantage, allowing you to increase sales by providing a more appealing deal
than similar options. Lower prices often attract new customers, which is a driving
factor for generating revenue.
Innovate new products and features: Creating a new product or new features
for the product you sell can attract new customers. New customers make new
purchases and contribute to higher profit margins and larger contributions to
overall industry revenue.
Build customer loyalty: Customer loyalty measures a customer’s satisfaction
with a brand. Loyal customers are often likely to make repeat purchases or pay
more for products or services because they’ve had positive experiences with a
business in the past.
Increase brand awareness: Branding awareness and marketing play a large role
in capturing market share. It's important to get your name out there so customers
know who you are. Becoming a household name and the preferred brand in an
industry will help increase your market share.
Grow organic search market share through search engine optimization
(SEO): In terms of marketing return on investment (ROI), organic search can be
one of the most effective ways to acquire customers.
13. Calculating Market Size (per period)
1. Number of units sold in market (per period) Units 100,000
Average selling price (P) in market SP P15.00
Market size = (Unit x SP) MSize P1,500,000
Firm's revenues (per period) Revs P250,000
Market Share (%) MShare 5.0%
Market size = (Revs / Market Share) MSize P5,000,000
Number of units sold (qty) in period Units 5,000
Average selling price (P) SP P20
Firm's Sales Revenue = Revs £100,000
Market size (P) MSize P2,000,000
Firm's Market share (%) MShare 5.0%
Firm's Sales Revenue = MSize x MShare Revs P100,000
Market Size (P) This Year (Y1) Y1 P4,600,000
Market Size (P) Last Year (Y0) Y0 P4,200,000
Change in Market Size (P) (Y1 - Y0) P400,000
14. Market Share
5. Your company sells notebooks and planners and your total revenue for a
fiscal quarter is P200,000. During that same fiscal period, total industry
sales were P2,000,000.
= 10%
6. Grayson Auto is a domestic company that manufactures non-luxury
vehicles. The company earned P60 billion in revenue in 2022. The auto
industry as a whole had P900 billion in revenue.
Market share = (P60 billion / P900 billion) x 100 = 6.7%
7. In 2022, Grayson Auto sold 4 million vehicles. The worldwide auto
industry as a whole sold 60 million vehicles.
Market share = (4 million / 60 million) x 100 = 6.7%
15. Venn Diagram
This is a placeholder text.
Placeholder for your own sub headline