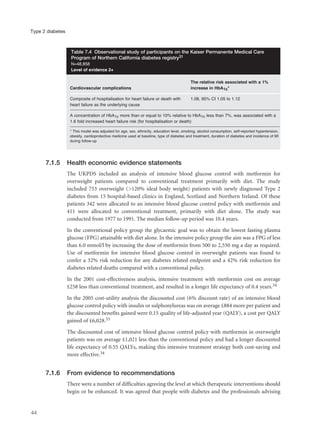
This document provides an introduction to Type 2 diabetes, including:
- Type 2 diabetes is caused by insulin insensitivity and a failure of pancreatic insulin secretion to compensate. It is associated with obesity and other cardiovascular risk factors.
- Without treatment, hyperglycemia can cause symptoms like polyuria and weight loss. Insulin deficiency increases risk of ketoacidosis or hyperosmolar coma.
- Type 2 diabetes significantly increases risk of cardiovascular disease like heart attacks and strokes. Management focuses on controlling multiple risk factors to reduce complications.
- Without control, hyperglycemia increases risk of eye, kidney and nerve damage. Treatment aims to lower blood glucose and control associated risks to improve health outcomes. Effective management of Type
Relationship between vascular system disfunction, neurofluid flow and Alzheim...
C13 nice type 2 diabetes 2008
1. TYPE 2 DIABETES
National clinical guideline for management
in primary and secondary care (update)
This is an update of the following
NICE (inherited) clinical guidelines on
Type 2 diabetes which were published in 2002:
E – retinopathy; F – renal disease; G – blood glucose;
H – management of blood pressure and blood lipids
The National Collaborating Centre
for Chronic Conditions
Funded to produce guidelines for the NHS by NICE
Published by
The recommendations on thiazolidinediones (R40 to R43, chapter 10), GLP-1 mimetic
(exenatide) (R44 to R46, chapter 10) and insulin therapy (R49 to R55), chapter 11) have been
updated and replaced by NICE short clinical guideline 87 ‘Type 2 diabetes: newer agents for
blood glucose control in type 2 diabetes’ (available at www.nice.org.uk/CG87shortguideline).
This short guideline contains details of the methods and evidence used to develop the updated
recommendations. Chapters 10 and 11 should be read in conjunction with the
short guideline.
3. iii
Contents
Members of the Guideline Development Group v
Acknowledgements vii
Preface viii
DEVELOPMENT OF THE GUIDELINE
1 Introduction
1.1 Background 3
1.2 Definition 4
1.3 Prevalence 4
1.4 Health and resource burden 5
2 Methodology
2.1 Aim 7
2.2 Scope 7
2.3 Audience 7
2.4 Involvement of people with Type 2 diabetes 8
2.5 Guideline limitations 8
2.6 Other work relevant to the guideline 8
2.7 Background 9
2.8 The process of guideline development 10
2.9 Disclaimer 14
2.10 Funding 14
3 Key messages of the guideline
3.1 Key priorities for implementation 15
3.2 Algorithms 16
4 Glossary and definitions 19
THE GUIDELINE
5 Education
5.1 Structured education 27
6 Lifestyle management/non-pharmacological management
6.1 Dietary advice 31
6.2 Management of depression 39
7 Glucose control levels
7.1 Clinical monitoring of blood glucose control 41
8 Self-monitoring of plasma glucose 47
9 Oral glucose control therapies (1): metformin, insulin secretagogues,
and acarbose
9.1 Clinical introduction 53
9.2 Metformin 53
4. 9.3 Insulin secretagogues 65
9.4 Acarbose 79
9.5 Oral glucose control therapies; from evidence to recommendations 85
10 Oral glucose control therapies (2): other oral agents and exenatide
10.1 Clinical introduction 89
10.2 Thiazolidinediones (glitazones) 89
10.3 Gliptins (GLP-1 enhancers): dipeptidyl peptidase 4 inhibitors (DPP-4 inhibitors) 114
10.4 Exenatide: GLP-1 mimetics 114
10.5 Oral glucose control therapies (2): other oral agents and exenatide; 120
from evidence to recommendations
11 Glucose control: insulin therapy
11.1 Oral agent combination therapy with insulin 125
11.2 Insulin therapy 130
11.3 Insulin detemir 146
11.4 Insulin delivery devices 146
12 Blood pressure therapy
12.1 Clinical introduction 151
12.2 Blood pressure lowering – targets and intervention levels 151
12.3 Blood pressure lowering medications 157
13 Cardiovascular risk estimation 181
14 Management of blood lipid levels
14.1 Overall clinical introduction 191
14.2 Targets and intervention levels 191
14.3 Statins and ezetimibe 193
14.4 Fibrates 198
14.5 Nicotinic acid and derivatives 205
14.6 Omega 3 fish oils 209
15 Antithrombotic therapy
15.1 Antiplatelet therapy 215
16 Kidney damage
16.1 Diabetes kidney disease management 223
17 Eye damage 233
18 Nerve damage
18.1 Diabetic neuropathic pain management 235
18.2 Autonomic neuropathy 246
18.3 Gastroparesis 247
18.4 Erectile dysfunction 250
18.5 Other aspects of autonomic neuropathy 255
19 Areas for future research 257
REFERENCES 259
iv
Type 2 diabetes
5. v
Members of the Guideline
Development Group
Professor Jonathan Mant (Chair)
Professor of Primary Care Stroke Research, University of Birmingham
Mrs Lina Bakhshi
Information Scientist, NCC-CC
Mrs Margaret Bannister
Nurse Consultant in Diabetes Care, Bradford and Airedale Primary Care Trust
Mrs Katherine Cullen
Health Economist, NCC-CC
Professor Melanie Davies
Professor of Diabetes Medicine, University of Leicester
Dr Jose Diaz
Health Services Research Fellow in Guideline Development, NCC-CC
Mrs Barbara Elster
Patient and Carer Representative, Essex
Dr Roger Gadsby
General Practitioner and Senior Lecturer in Primary Care, Warwickshire
Dr Anupam Garrib
Health Services Research Fellow, NCC-CC
Ms Irene Gummerson
Primary Care Pharmacist, Yorkshire
Dr Martin Hadley-Brown
General Practitioner Trainer, University of Cambridge
Professor Philip Home
Clinical Advisor to the GDG; Professor of Diabetes Medicine, Newcastle University
Mrs Kathryn Leivesley
Practice Nurse, North Manchester Primary Care Trust
Mrs Emma Marcus
Clinical Specialist Diabetes Dietitian, Hinckley and Bosworth Primary Care Trust
Mr Leo Nherera
Health Economist, National Collaborating Centre for Women’s and Children’s Health
Ms Roberta Richey
Health Services Research Fellow in Guideline Development, NCC-CC
Mr John Roberts
Patient and Carer Representative, Merseyside
6. Dr Mark Savage
Consultant Physician, North Manchester General Hospital
Lorraine Shaw
Paediatric Diabetes Clinical Nurse Specialist, Birmingham Children’s Hospital
Dr Stuart Smelie
Consultant Chemical Pathologist, Bishop Auckland General Hospital
Ms Nicole Stack
Guideline Development Project Manager, NCC-CC
Ms Claire Turner
Guideline Development Senior Project Manager, NCC-CC
Ms Susan Varney
Health Services Research Fellow in Guideline Development, NCC-CC
Dr Jiten Vora
Consultant Physician Endocrinologist, Royal Liverpool and Broadgreen University Hospital
The following experts were invited to attend specific meetings and to advise the Guideline
Development Group:
Dr Julian Barth
Consultant Chemical Pathologist, Leeds NHS Trust attended one meeting as a deputy for Dr
Stuart Smellie
Dr Indranil Dasgupta
Consultant Physician and Nephrologist, Birmingham Heartlands Hospital
Dr Michael Feher
Consultant Physician, Chelsea Westminster Hospital attended one meeting as a deputy for Dr
Mark Savage
Dr Charles Fox
Consultant Physician, Northampton General Trust attended one meeting as a deputy for
Professor Melanie Davies
Natasha Jacques
Principal Pharmacist Medicine, Solihull Hospital attended one meeting as a deputy for Ms
Irene Gummerson
Dr Eric Kilpatrick
Consultant Chemical Pathologist, University of Hull attended one meeting as a deputy for Dr
Stuart Smellie
Dr Ian Lawrence
Consultant Diabetologist, University of Leicester attended one meeting as a deputy for
Professor Melanie Davies and Dr Jiten Vora
Professor Sally Marshall
Professor of Diabetes, Newcastle University
Professor David Wood
Professor of Cardiovascular Medicine, Imperial College London
vi
Type 2 diabetes
7. Acknowledgements
The Guideline Development Group (GDG) is grateful to Bernard Higgins, Jane Ingham, Rob
Grant, Jill Parnham and Susan Tann of the NCC-CC for their support throughout the
development of the guideline.
The GDG would like to thank the following individuals for giving their time to advise us
regarding the design and interpretation of the economic model of analysis of third-line
therapy with insulins, glitazones or exenatide in Type 2 diabetes:
q Professor Alastair Gray, University of Oxford
q Dr Philip Clarke, University of Sydney
q Dr Joanne Lord, National Institute for Health and Clinical Excellence.
The GDG would like to thank the following individuals for peer reviewing the guideline:
q Professor Simon Heller, University of Sheffield
q Professor David Owens, Llandough Hospital, Penarth
q Professor Bryan Williams, University of Leicester
q Dr Miles Fisher, Glasgow Royal Infirmary
q Professor Soloman Tesfaye, University of Sheffield
q Mr Irvine Turner, Patient Representative.
vii
Acknowledgements
8. viii
Preface
In 2007, the Centers for Disease Control and Prevention in the USA took the step, unusual for
a non-infectious disease, of classifying the increase in the incidence of diabetes as an epidemic,
their projections suggesting that the prevalence of this already common disease will have
doubled by 2050. In the UK, diabetes already affects approximately 1.9 million adults overall,
and some estimates suggest that there are an additional 0.5 million with undiagnosed diabetes.*
This makes diabetes one of the commonest of all chronic medical conditions, and represents a
huge potential problem for our health services.
Over 90% of people with diabetes have Type 2 diabetes. This is still perceived as the milder
form, and while this may be true in some respects, such as the risk of ketoacidosis, the causation
of Type 2 diabetes is more complex and the management is not necessarily easier. Type 2
diabetes can cause severe complications, affecting the eye, the nervous system and the kidney.
The overall risk of cardiovascular disease is more than doubled, and life expectancy is reduced
by an average 7 years. In 2002, NICE published a suite of five guidelines dealing with different
aspects of the care of Type 2 diabetes. The rising prevalence of the disease, and the range of
complications which can arise, reinforce the importance of up-to-date guidance and accord-
ingly NICE have asked the National Collaborating Centre for Chronic Conditions (NCC-CC)
to produce this guideline, amalgamating and updating the previously published work.
The guideline is informed by extensive literature and covers many aspects of diabetes
management, although it is not intended to be a comprehensive textbook. It covers those topics
of particular relevance to life expectancy such as control of cholesterol and lipid levels, and
management of hypertension. It deals with major complications such as renal disease. There are
also key recommendations in areas of great importance to patients such as structured education
and the monitoring of glucose levels. Naturally, there are also sections dealing with control of
blood glucose levels and the use of the various drugs available for this purpose.
The guideline development group (GDG) have had a particularly difficult task during
development. The remit they were given was unusually large, and I have already mentioned the
vast amount of evidence which they were required to consider. They were required to
incorporate several existing NICE technology appraisals (TAs) within the guideline. In
addition, they had to contend with a major safety scare over one of the glucose lowering agents
which evolved over the course of guideline development. It is a measure of their commitment
and appetite for hard work that, despite the size of the existing task, they were frustrated rather
than relieved at not being able to include information about newer agents such as the DPP-4
inhibitors, the first of which was licensed towards the end of the development process (these
agents will be covered at a later date in a separate, short guideline). All at the NCC-CC are
extremely grateful to the GDG for the tremendous effort they have put into producing this
guideline on schedule. The challenge now is to implement its recommendations and to make a
genuine difference to the well-being and health of those with Type 2 diabetes.
Dr Bernard Higgins MD FRCP
Director, National Collaborating Centre for Chronic Conditions
* Department of Health. Health survey for England 2003. London: Stationary Office, 2004.
10. 1 Introduction
1.1 Background
Diabetes is a group of disorders with a number of common features, of which raised blood
glucose is by definition the most evident. In England and Wales the four commonest types of
diabetes are:
q Type 1 diabetes
q Type 2 diabetes
q secondary diabetes (from pancreatic damage, hepatic cirrhosis, endocrinological
disease/therapy, or anti-viral/anti-psychotic therapy)
q gestational diabetes (diabetes of pregnancy).
This guideline is concerned only with Type 2 diabetes. The underlying disorder is usually that of
a background of insulin insensitivity plus a failure of pancreatic insulin secretion to compensate
for this.
The insulin insensitivity is usually evidenced by excess body weight or obesity, and exacerbated
by overeating and inactivity. It is commonly associated with raised blood pressure, a disturbance
of blood lipid levels, and a tendency to thrombosis. This combination is often recognised as the
‘metabolic syndrome’, and is associated with fatty liver and abdominal adiposity (increased waist
circumference).
The insulin deficiency is progressive over time, such that the high glucose levels usually worsen
relentlessly over a timescale of years, requiring continued escalation of blood glucose lowering
therapy. The worsening insulin deficiency with age also means that diabetes can appear in
elderly people who are quite thin. In some people in middle age the condition can be difficult
to distinguish from slow onset Type 1 diabetes.
In people whose hyperglycaemia has yet to be treated, glucose metabolism may be sufficiently
disturbed to cause symptoms, typically of polyuria, thirst, weight loss and fatigue. Diabetic coma
(ketoacidosis) is uncommon in Type 2 diabetes unless exacerbating factors (infection, drugs) are
present, but insulin deficiency and high sugar intake can lead to a related state (hyperosmolar
coma).
Type 2 diabetes is notable for the increased cardiovascular risk that it carries. This can be
manifest as coronary artery disease (heart attacks, angina), peripheral artery disease (leg
claudication, gangrene), and carotid artery disease (strokes, dementia). Many people with
Type 2 diabetes have the same risk of a cardiovascular event as someone without diabetes who
has already had their first heart attack; people with diabetes and a previous cardiovascular event
are at very high risk – around 10 times the background population. Accordingly management
of cardiovascular risk factors plays a large part in care of people with Type 2 diabetes, and is
particularly cost effective.
Because of the problems of maintaining good blood glucose control associated with the
increasing insulin deficiency, the degree of hyperglycaemia occurring in some individuals is
sufficient to give rise to a risk of the specific (‘microvascular’) complications of diabetes. Due
3
11. to early death caused by cardiovascular disease these are less common than in people with
Type 1 diabetes, but include eye damage (sometimes blindness), kidney damage (sometimes
requiring dialysis or transplantation), and nerve damage (resulting in amputation, painful
symptoms, erectile dysfunction, and other problems).
This situation of multiple vascular risk factors and multiple complications leads to multiple
targets for reduction of risk and improvement of health in people with Type 2 diabetes. Such
targets for management include obesity, activity levels, plasma glucose control, blood pressure
control, blood lipid control, reduction of thrombogenicity, laser therapy for eye damage, drug
therapy to delay kidney damage, local foot care, and symptomatic treatments for various types
of nerve damage. As a result diabetes care is typically complex and time consuming.
The necessary lifestyle changes, the complexities of management, and the side effects of
therapy, together make self-monitoring and education for people with diabetes central parts of
management.
1.2 Definition
The GDG worked to the World Health Organization (WHO) definition of diabetes, which
requires a degree of high plasma glucose levels sufficient to put the individual at risk of the
specific (microvascular) complications of diabetes. Diagnosis is not addressed in this guideline.
This definition was reconfirmed by the WHO in 2006, but, like earlier versions, does not
contain a specific definition for Type 2 diabetes.2
People are normally thought to have Type 2 diabetes if they do not have Type 1 diabetes (rapid
onset, often in childhood, insulin-dependent, ketoacidosis if neglected) or other medical
conditions or treatment suggestive of secondary diabetes. However, there can be uncertainty in
the diagnosis particularly in overweight people of younger age. A further area of confusion is
the group of disorders classified as monogenetic diabetes – formally Maturity Onset Diabetes
of the Young (MODY) – which are usually not insulin requiring but which present in the first
decades of life.
It is noted that Type 1 diabetes with onset after childhood can be confused with Type 2 diabetes.
However, lower body weight, more rapid progression to insulin therapy, and absence of features
of the metabolic syndrome often give useful distinguishing clues.
1.3 Prevalence
The prevalence of diabetes in the UK is increasing as is the prevalence of obesity, decreased
physical activity, but also increased longevity after diagnosis thanks to better cardiovascular risk
protection. The current prevalence of Type 2 diabetes is unknown, and will vary with factors
such as mix of ethnic groups and degree of social deprivation.
4
Type 2 diabetes
12. Prevalence estimates vary from around 3.5 to 5.0%, the third edition of the International
Diabetes Federation (IDF) Atlas suggesting 4.0%, being 1.71 million in the 20- to 79-year-old
age group, of whom it is conventional to assume 85% have Type 2 diabetes.4 Current prevalence
estimates are a poor pointer to future burden of diabetes due to their continuing increase. The
healthcare burden is also affected by the improved longevity of people with diabetes with better
management, which means that overall they carry a larger burden of complications and insulin
deficiency needing more complex care.
1.4 Health and resource burden
Type 2 diabetes can result in a wide range of complications (see above), with repercussions for
both the individual patient and the NHS. The economic impact of this disease includes at least
three factors:
q direct cost to the NHS and associated healthcare support services
q indirect cost to the economy, including the effects of early mortality and lost productivity
q personal impact of diabetes and subsequent complications on patients and their families.
Mortality attributed to people with diabetes is suggested as 4.2% of deaths in men and 7.7% of
deaths in women in the UK. These are likely to be underestimates as deaths from vascular events
such as stroke and myocardial infarction (MI) are notorious for under-recording of the
underlying causative disease. In a population-based study in Cardiff, at a time when population
prevalence was only 2.5%, deaths in people with diabetes accounted for over 10% of the total,
with around 60% attributable to diabetes.5 Life years lost vary considerably with factors such as
blood glucose, blood pressure and blood lipid control, and smoking, as well as age, and can be
estimated by comparing United Kingdom Prospective Diabetes Study (UKPDS) risk engine
estimates to UK government statistical tables. Typically a 60-year-old man, newly diagnosed
and without existing arterial disease can expect to lose 8–10 years of life without proper
management.
5
1 Introduction
Men (≥55 years) Women (≥55 years)
General population (%) 4.3 3.4
Black Caribbean 10.0 8.4
Black African 5.0 2.1
Indian 10.1 5.9
Pakistani 7.3 8.6
Bangladeshi 8.2 5.2
Chinese 3.8 3.3
Irish 3.6 2.3
Table 1.1 The prevalence of doctor-diagnosed diabetes (2003)3
13. The direct cost of Type 2 diabetes to the NHS is unknown, as much is classified as
cardiovascular or renal disease. However, with prevalence estimates of 3.5–5.0%, and healthcare
costs double those of the background population or more, estimates of 7–12% of total NHS
expenditure seem not unreasonable. The IDF Atlas notes that in industrialised countries
healthcare costs in people with diabetes tend to be double those of the background population.
This suggests a £2.8 billion attributable cost for the UK for 2007.4
6
Type 2 diabetes
14. 2 Methodology
2.1 Aim
The aim of the National Collaborating Centre for Chronic Conditions (NCC-CC) is to provide
a user-friendly, clinical, evidence-based guideline for the NHS in England and Wales that:
q offers best clinical advice for the management of Type 2 diabetes
q is based on best published clinical and economic evidence, alongside expert consensus
q takes into account patient choice and informed decision making
q defines the major components of NHS care provision for Type 2 diabetes
q details areas of uncertainty or controversy requiring further research
q provides a choice of guideline versions for differing audiences.
2.2 Scope
The guideline was developed in accordance with a scope, which detailed the remit of the
guideline originating from the Department of Health (DH) and specified those aspects of
Type 2 diabetes care to be included and excluded. The application of the guideline to children
has not been excluded but we were not able to specifically search for paediatric literature due to
volume of work. When health carers are applying these guidelines to children they need to use
their clinical judgement in doing so. For further assistance with applying this guideline to
children please refer to the British National Formulary (BNF) for children.6
Prior to the commencement of the guideline development, the scope was subjected to stake-
holder consultation in accordance with processes established by the National Institute for
Health and Clinical Excellence (NICE).1 The full scope is shown in appendix B. Available at
www.rcplondon.ac.uk/pubs/brochure.aspx?e=247
2.3 Audience
The guideline is intended for use by the following people or organisations:
q all healthcare professionals
q people with Type 2 diabetes and their parents and carers
q patient support groups
q commissioning organisations
q service providers.
7
15. 2.4 Involvement of people with Type 2 diabetes
The NCC-CC was keen to ensure the views and preferences of people with Type 2 diabetes and
their carers informed all stages of the guideline. This was achieved by:
q having two people with Type 2 diabetes as patient representatives on the GDG
q consulting the Patient and Public Involvement Programme (PPIP) housed within NICE
during the pre-development (scoping) and final validation stages of the guideline project
q the inclusion of patient groups as registered stakeholders for the guideline.
2.5 Guideline limitations
The guideline has the following limitations.
q NICE clinical guidelines usually do not cover issues of service delivery, organisation or
provision (unless specified in the remit from the DH).
q NICE is primarily concerned with health services and so recommendations are not
provided for social services and the voluntary sector. However, the guideline may address
important issues in how NHS clinicians interface with these other sectors.
q Generally, the guideline does not cover rare, complex, complicated or unusual conditions.
q Where a meta-analysis was available, generally the individual papers contained within
were not appraised.
q It is not possible in the development of a clinical guideline to complete an extensive
systematic literature review of all pharmacological toxicity, although NICE expect their
guidelines to be read alongside the summaries of product characteristics (SPCs).
2.6 Other work relevant to the guideline
The guideline will update the following NICE technology appraisals (TAs) but only in relation
to Type 2 diabetes:
q ‘Guidance on the use of glitazones for the treatment of Type 2 diabetes’, NICE technology
appraisal guidance no. 63 (2003)
q ‘Guidance on the use of patient-education models for diabetes’, NICE technology appraisal
guidance no. 60 (2003)
q ‘Guidance on the use of long-acting insulin analogues for the treatment of diabetes –
insulin glargine’, NICE technology appraisal guidance no. 53 (2002).
Related NICE public health guidance:
q ‘Smoking cessation services, including the use of pharmacotherapies, in primary care,
pharmacies, local authorities and workplaces, with particular reference to manual
working groups, pregnant smokers and hard to reach communities’, Public health
programme guidance no. PH010 (February 2008)
q ‘Physical activity guidance for the Highways Agency, local authorities, primary care,
pharmacists, health visitors and community nurses, schools, workplaces, the leisure and
fitness industry and sports clubs’, Public health programme guidance no. PH008 (January
2007).
8
Type 2 diabetes
16. Related NICE clinical guidelines:
q ‘Cardiovascular risk assessment: the modification of blood lipids for the primary and
secondary prevention of cardiovascular disease’ (expected date of publication May 2008)
q ‘Diabetes in pregnancy: management of diabetes and its complications from pre-
conception to the postnatal period’, NICE clinical guideline no. 63 (2008)
q ‘Hypertension: management of hypertension in adults in primary care’ (partial update of
NICE CG18), NICE clinical guideline no. 34 (2006)
q ‘Obesity: the prevention, identification, assessment and management of overweight and
obesity in adults and children’, NICE clinical guideline no. 43 (2006)
q ‘Type 1 diabetes: diagnosis and management of type 1 diabetes in children, young people
and adults’, NICE clinical guideline no. 15 (2004, to be reviewed 2008)
q ‘Type 2 diabetes: prevention and management of foot problems’, NICE clinical guideline
no. 10 (2004).
Related TA guidance:
q ‘Guidance on the use of ezetimibe for the treatment of primary (heterozygous-familial
and non-familial) hypercholesterolaemia’, NICE technology appraisal guidance no. 132
(2007)
q ‘Guidance on the use of statins for the prevention of cardiovascular events in patients at
increased risk of developing cardiovascular disease or those with established
cardiovascular disease’, NICE technology appraisal guidance no. 94 (2006)
q ‘Guidance on the use of inhaled insulin for the treatment of Type 1 and Type 2 diabetes’,
NICE technology appraisal guidance no. 113 (2006)
q ‘Guidance on the use of clopidogrel and dipyridamole for the prevention of
artherosclerotic events’, NICE technology appraisal guidance no. 90 (2005)
q ‘Guidance on the use of the clinical effectiveness and cost effectiveness of insulin pump
therapy’, NICE technology appraisal guidance no. 57 (2003).
2.7 Background
The development of this evidence-based clinical guideline draws upon the methods described
by the NICE’s ‘Guideline development methods manual’1 and the methodology pack7
specifically developed by the NCC-CC for each chronic condition guideline (see
www.rcplondon.ac.uk/clinical-standards/ncc-cc/Pages/NCC-CC.aspx). The developers’ role
and remit is summarised in table 2.1.
9
2 Methodology
17. 2.8 The process of guideline development
The basic steps in the process of producing a guideline are:
q developing clinical evidence-based questions
q systematically searching for the evidence
q critically appraising the evidence
q incorporating health economic evidence
q distilling and synthesising the evidence and writing recommendations
q grading the evidence statements
q agreeing the recommendations
10
Type 2 diabetes
NCC-CC The NCC-CC was set up in 2001 and is housed within the Royal
College of Physicians (RCP). The NCC-CC undertakes commissions
received from NICE.
A multiprofessional partners’ board inclusive of patient groups and
NHS management governs the NCC-CC.
NCC-CC Technical Team The technical team met approximately two weeks before each
GDG meeting and comprised the following members:
GDG Chair
GDG Clinical Adviser
Information Scientist
Two Research Fellows
Health Economist
Project Manager.
GDG The GDG met monthly (June 2006 to July 2007) and comprised a
multidisciplinary team of professionals and people with Type 2
diabetes who were supported by the technical team.
The GDG membership details including patient representation and
professional groups are detailed in the GDG membership table at the
front of this guideline.
Guideline Project Executive The Project Executive was involved in overseeing all phases of the
guideline. It also reviewed the quality of the guideline and compliance
with the DH remit and NICE scope.
The Project Executive comprises:
NCC-CC Director
NCC-CC Assistant Director
NCC-CC Manager
NICE Commissioning Manager
Technical Team.
Formal consensus At the end of the guideline development process the GDG met to
review and agree the guideline recommendations.
Members of the GDG declared any interests in accordance with the NICE technical manual.1 A register is
given in appendix D, available online at www.rcplondon.ac.uk/pubs/brochure.aspx?e=247
Table 2.1 Role and remit of the developers
18. q structuring and writing the guideline
q updating the guideline.
s Developing evidence-based questions
The technical team drafted a series of clinical questions that covered the guideline scope. The
GDG and Project Executive refine and approve these questions, which are shown in appendix A.
Available at www.rcplondon.ac.uk/pubs/brochure.aspx?e=247
s Searching for the evidence
The information scientist developed a search strategy for each question. Key words for the
search were identified by the GDG. In addition, the health economist searched for additional
papers providing economic evidence or to inform detailed health economic work (for example,
modelling). Papers that were published or accepted for publication in peer-reviewed journals
were considered as evidence by the GDG. Conference paper abstracts and non-English language
papers were excluded from the searches.
Each clinical question dictated the appropriate study design that was prioritised in the search
strategy but the strategy was not limited solely to these study types. The research fellow or
health economist identified titles and abstracts from the search results that appeared to be
relevant to the question. Exclusion lists were generated for each question together with the
rationale for the exclusion. The exclusion lists were presented to the GDG. Full papers
were obtained where relevant. See appendix A for literature search details. Available at
www.rcplondon.ac.uk/pubs/brochure.aspx?e=247
s Appraising the evidence
The research fellow or health economist, as appropriate, critically appraised the full papers. In
general, no formal contact was made with authors; however, there were ad hoc occasions when
this was required in order to clarify specific details. Critical appraisal checklists were compiled
for each full paper. One research fellow undertook the critical appraisal and data extraction.
The evidence was considered carefully by the GDG for accuracy and completeness.
All procedures are fully compliant with the:
q NICE methodology as detailed in the ‘Guideline Development Methods – Information for
National Collaborating Centres and Guideline Developers’ Manual1
q NCC-CC quality assurance document and systematic review chart available at
www.rcplondon.ac.uk/clinical-standards/ncc-cc/Pages/NCC-CC.aspx.
s Health economic evidence
Areas for health economic modelling were agreed by the GDG after the formation of the clinical
questions. The health economist reviewed the clinical questions to consider the potential
application of health economic modelling, and these priorities were agreed with the GDG.
The health economist performed supplemental literature searches to obtain additional data for
modelling. Assumptions and designs of the models were explained to and agreed by the GDG
members during meetings, and they commented on subsequent revisions.
11
2 Methodology
19. s Distilling and synthesising the evidence and developing recommendations
The evidence from each full paper was distilled into an evidence table and synthesised into
evidence statements before being presented to the GDG. This evidence was then reviewed by
the GDG and used as a basis upon which to formulate recommendations. The criteria for
grading evidence are shown in table 2.2.
Evidence tables are available online at www.rcplondon.ac.uk/pubs/brochure.aspx?e=247
s Grading the evidence statements
s Agreeing the recommendations
The GDG employed formal consensus techniques to:
q ensure that the recommendations reflected the evidence base
q approve recommendations based on lesser evidence or extrapolations from other situations
q reach consensus recommendations where the evidence was inadequate
q debate areas of disagreement and finalise recommendations.
The GDG also reached agreement on the following:
q five recommendations as key priorities for implementation
q five key research recommendations
q algorithms.
In prioritising key recommendations for implementation, the GDG took into account the
following criteria:
12
Type 2 diabetes
Table 2.2 Grading the evidence statements1
Level of
evidence Type of evidence
1++ High-quality meta-analyses, systematic reviews of RCTs, or RCTs with a very low risk of
bias.
1+ Well-conducted meta-analyses, systematic reviews of RCTs, or RCTs with a low risk of bias.
1– Meta-analyses, systematic reviews of RCTs, or RCTs with a high risk of bias.*
2++ High-quality systematic reviews of case-control or cohort studies.
High-quality case-control or cohort studies with a very low risk of confounding, bias or
chance and a high probability that the relationship is causal.
2+ Well-conducted case-control or cohort studies with a low risk of confounding, bias or
chance and a moderate probability that the relationship is causal.
2– Case-control or cohort studies with a high risk of confounding, bias or chance and a
significant risk that the relationship is not causal.*
3 Non-analytic studies (for example case reports, case series).
4 Expert opinion, formal consensus.
*Studies with a level of evidence ‘–’ are not used as a basis for making a recommendation.
RCT, randomised controlled trial
20. q high clinical impact
q high impact on reducing variation
q more efficient use of NHS resources
q allowing the patient to reach critical points in the care pathway more quickly.
Audit criteria for this guideline will be produced for NICE by Clinical Accountability Service
Planning and Evaluation (CASPE) Research following publication in order to provide
suggestions of areas for audit in line with the key recommendations for implementation.
s Structuring and writing the guideline
The guideline is divided into sections for ease of reading. For each section the layout is similar
and contains the following parts.
q Clinical introduction sets a succinct background and describes the current clinical context.
q Methodological introduction describes any issues or limitations that were apparent when
reading the evidence base.
q Evidence statements provide a synthesis of the evidence base and usually describes what
the evidence showed in relation to the outcomes of interest.
q Health economics presents, where appropriate, an overview of the cost effectiveness
evidence base, or any economic modelling.
q From evidence to recommendations sets out the GDG decision-making rationale providing
a clear and explicit audit trail from the evidence to the evolution of the
recommendations.
q Recommendations provide stand alone, action-orientated recommendations.
q Evidence tables are not published as part of the full guideline but are available online at
www.rcplondon.ac.uk/pubs/brochure.aspx?e=247. These describe comprehensive details
of the primary evidence that was considered during the writing of each section.
s Writing the guideline
The first draft version of the guideline was drawn up by the technical team in accord with the
decisions of the GDG, incorporating contributions from individual GDG members in their
expert areas and edited for consistency of style and terminology. The guideline was then
submitted for a formal public and stakeholder consultation prior to publication. The registered
stakeholders for this guideline are detailed on the NICE website, www.nice.org.uk. Editorial
responsibility for the full guideline rests with the GDG.
13
2 Methodology
21. s Updating the guideline
Literature searches were repeated for all of the evidence-based questions at the end of the GDG
development process allowing any relevant papers published up until 16 April 2007 to be
considered. Future guideline updates will consider evidence published after this cut-off date.
Two years after publication of the guideline, NICE will ask a National Collaborating Centre
to determine whether the evidence base has progressed significantly to alter the guideline
recommendations and warrant an early update. If not, the guideline will be considered for
update approximately 4 years after publication.
2.9 Disclaimer
Healthcare providers need to use clinical judgement, knowledge and expertise when deciding
whether it is appropriate to apply guidelines. The recommendations cited here are a guide
and may not be appropriate for use in all situations. The decision to adopt any of the
recommendations cited here must be made by the practitioner in light of individual patient
circumstances, the wishes of the patient, clinical expertise and resources.
The NCC-CC disclaims any responsibility for damages arising out of the use or non-use of
these guidelines and the literature used in support of these guidelines.
2.10 Funding
The NCC-CC was commissioned by NICE to undertake the work on this guideline.
14
Type 2 diabetes
Full version Details the recommendations, the supporting evidence base and the
expert considerations of the GDG. Published by the NCC-CC.
Available at www.rcplondon.ac.uk/pubs/brochure.aspx?e=247
NICE version Documents the recommendations without any supporting evidence.
Available at www.nice.org.uk
‘Quick reference guide’ An abridged version.
Available at www.nice.org.uk
‘Understanding NICE A lay version of the guideline recommendations.
guidance’ Available at www.nice.org.uk
Table 2.3 Versions of this guideline
22. 3 Key messages of the guideline
3.1 Key priorities for implementation
Offer structured education to every person and/or their carer at and around the time of
diagnosis, with annual reinforcement and review. Inform people and their carers that
structured education is an integral part of diabetes care.
Provide individualised and ongoing nutritional advice from a healthcare professional with
specific expertise and competencies in nutrition.
When setting a target glycated haemoglobin (GHb):
q involve the person in decisions about their individual HbA1c target level, which may be
above that of 6.5 % set for people with Type 2 diabetes in general
q encourage the person to maintain their individual target unless the resulting side effects
(including hypoglycaemia) or their efforts to achieve this impair their quality of life
q offer therapy (lifestyle and medication) to help achieve and maintain the HbA1c target
level
q inform a person with a higher HbA1c that any reduction in HbA1c towards the agreed
target is advantageous to future health
q avoid pursuing highly intensive management to levels of less than 6.5 %.
Offer self-monitoring of plasma glucose to a person newly diagnosed with Type 2 diabetes only
as an integral part of his or her self-management education. Discuss its purpose and agree how
it should be interpreted and acted upon.
When starting insulin therapy, use a structured programme employing active insulin dose
titration that encompasses:
q structured education
q continuing telephone support
q frequent self-monitoring
q dose titration to target
q dietary understanding
q management of hypoglycaemia
q management of acute changes in plasma glucose control
q support from an appropriately trained and experienced healthcare professional.
15
23. 3.2 Algorithms
16
Type 2 diabetes
HbA1c ≥6.5%* after trial
of lifestyle measures
Metformin
with active dose titration
HbA1c <6.5%*
HbA1c ≥6.5%*
HbA1c ≥7.5%*
HbA1c ≥7.5%*
Monitor for expected
deterioration
Metformin + sulfonylurea
with active dose titration
Add thiazolidinedione or insulin
with active dose titration
Insulin + metformin + sulfonylurea
with active dose titration
Increase insulin dose and intensify
regimen with time
Monitor for expected deterioration
A sulfonylurea may be considered here for
people who are not overweight or if glucose levels
are particularly high
Exenatide may be considered here when body
weight is a special problem and recommendations
in the guideline are met
A rapid-acting insulin secretagogue may be
considered for people with non-routine daily
lifestyle patterns to assist in attaining glucose
control to their individual target
Only consider a thiazolidinedione here if
hypoglycaemia on sulfonylurea is a potential
problem
Figure 3.1 Scheme for the pharmacotherapy of glucose lowering in people with Type 2 diabetes
For details see recommendations on glucose lowering targets, clinical monitoring, use of oral agents, and use of
insulin
* or as individually agreed
24. 17
3 Key messages
Figure 3.2 Scheme for the management of blood pressure (BP) for people with Type 2 diabetes
ACEI, angiotensin-converting enzyme inhibitor; A2RB, angiotensin 2 receptor blocker (sartan); CCB, calcium
channel blocker
Measure BP annually if not hypertensive or
renal disease
If >140/80 mmHg confirm consistently raised
Trial lifestyle measures alone unless
>140/90 mmHg
Maintain
lifestyle
measures
Start ACEI (and titrate dose)
(if African-Caribbean plus
diuretic or plus CCB)
Add CCB or diuretic
Add diuretic or CCB
Add α-blocker, β-blocker,
or potassium-sparing diuretic
Add α-blocker, β-blocker,
or potassium-sparing diuretic,
or refer to specialist
Above target
Above target
Above target
Above target
Above target
Above target
Targets
People with retinopathy or cerebrovascular
disease or with microalbuminuria:
follow algorithm with target <130/80 mmHg
Others:
follow algorithm with target <140/80 mmHg
Women with possibility of pregnancy:
avoid use of ACEI or A2RB drugs
Begin with CCB
In people with continuing intolerance to an
ACE inhibitor (other than renal deterioration or
hyperkalaemia):
Substitute the ACE inhibitor with an A2RB drug
People with microalbuminuria:
will already be on full dose of ACEI or alternative.
Then follow algorithm with target <130/80 mmHg
25. 18
Type 2 diabetes
Figure 3.3 Diabetic symptomatic neuropathy management – a therapeutic summary
*Where neuropathic symptoms cannot be adequately controlled it is useful, to help individuals cope, to explain
the reasons for the problem, the likelihood of remission in the medium term, the role of improved blood glucose
control
Enquire annually for neuropathic symptoms (paraesthesia, burning sensations, shooting pains, other)
Add a trial of the cheapest (at maximum dose) of duloxetine, gabapentin, or pregabalin
– monitor for response
Consider a trial of another of duloxetine, gabapentin, or pregabalin – titrate dose and monitor for response
Review for opiate analgesia, pain clinical referral and psychological support
Monitor for worsening or remission
Controlled
Controlled
Controlled
Controlled
Uncontrolled*
Uncontrolled*
Uncontrolled*
Monitor for worsening or remission
Assess severity if present
(sleep disturbance, depression, interference with normal activities)
Maintain good blood glucose control
Non-severe
Offer local measures and simple analgesia
Monitor for worsening
Severe
Offer local measures and trial of tricyclic medication
Monitor for response
26. 4 Glossary and definitions
ACEI Angiotensin-converting enzyme inhibitor
ACR Albumin creatinine ratio
ADA American Diabetes Association
AER Albumin excretion rate – a measure of kidney damage due to
diabetes (and other conditions) and a risk factor for arterial disease.
Albuminuria The presence of albumin and other proteins in urine.
Alpha-glucosidase Group of drugs which inhibit the digestion of complex carbohydrates
inhibitors in the gut, and thus flatten the post-meal blood glucose excursion.
BMI Body mass index – a index of body weight corrected for height.
Cohort study A retrospective or prospective follow-up study. Groups of
individuals to be followed up are defined on the basis of presence or
absence of exposure to a suspected risk factor or intervention.
A cohort study can be comparative, in which case two or more
groups are selected on the basis of differences in their exposure to
the agent of interest.
CKD Chronic kidney disease
Confidence interval (CI) A range of values which contains the true value for the population
with a stated ‘confidence’ (conventionally 95%). The interval is
calculated from sample data, and generally straddles the sample
estimate. The 95% confidence value means that if the study, and the
method used to calculate the interval, is repeated many times, then
95% of the calculated intervals will actually contain the true value
for the whole population.
Cochrane review The Cochrane Library consists of a regularly updated collection of
evidence-based medicine databases including the Cochrane
Database of Systematic Reviews (reviews of randomised controlled
trials prepared by the Cochrane Collaboration).
Concordance Concordance is a concept reflecting the extent to which a course of
action agreed between clinicians and a person with diabetes is
actually carried out; often but not solely used in the sense of
therapeutic interventions or behavioural changes.
Cost-effectiveness An economic study design in which consequences of different
analysis interventions are measured using a single outcome, usually in
natural units (for example, life-years gained, deaths avoided, heart
attacks avoided, cases detected). Alternative interventions are then
compared in terms of cost per unit of effectiveness.
Cost-utility analysis A form of cost-effectiveness analysis in which the units of
effectiveness are quality adjusted life years.
DCCT Diabetes Control and Complications Trial – a landmark study of the
effects of intensification of diabetes care on development of
microvascular complications.
19
27. Diabetes centre A generic term for a source of a unified multidisciplinary diabetes
service.
Diabetes mellitus Chronic condition characterised by elevated blood glucose levels.
Diabetes is of diverse aetiology and pathogenesis, and should not be
regarded as a single disease. Predominant types are Type 1 diabetes
and Type 2 diabetes, diabetes secondary to other pancreatic disease
or other endocrine disease, and diabetes of onset in pregnancy.
Diabetes UK Self-help charity for people with diabetes in the UK, and a
professional organisation for diabetes care.
Education In the context of this guideline, patient education in self-
management of everyday diabetes issues like insulin therapy, dietary
changes, self-monitoring of glucose level, physical exercise, coping
with concurrent illness, how to avoid hypoglycaemia, complications,
arterial risk control, jobs, travel, etc.
FBG Fasting blood glucose level or concentration
FPG Fasting plasma glucose level or concentration
Framingham equation A widely known and used calculation of arterial risk, derived from a
long-term study in Framingham, Massachusetts. Not valid in people
with Type 1 or Type 2 diabetes.
GDG Guideline Development Group
Glucose excursions Change in blood glucose levels especially after meals.
GFR Glomerular filtration rate – a measure of kidney function.
GHb Glycated haemoglobin – see HbA1c.
GI Gastrointestinal
HbA1c The predominant form of glycated haemoglobin, present in red
blood cells, and formed when the normal haemoglobin A reacts
non-enzymatically with glucose. As the reaction is slow and only
concentration dependent, the amount of HbA1c formed is
proportional only to the concentration of HbA and glucose. As HbA
remains in the circulation for around 3 months, the amount of
HbA1c present, expressed as a percentage of HbA, is proportional to
the glucose concentration over that time.
HTA Health Technology Assessment, funded by the NHS Research and
Development Directorate.
IDF International Diabetes Federation – a global federation of diabetes
associations.
Incremental cost The cost of one alternative less the cost of another.
Incremental cost The ratio of the difference in costs between two alternatives to the
effectiveness ratio difference in effectiveness between the same two alternatives.
(ICER)
Insulin analogues A derivative of human insulin in which change of the amino-acid
sequence alters duration of action after injection.
20
Type 2 diabetes
28. Insulin regimen A therapeutic combination of different insulin preparations,
including time of injection and frequency during a day.
IHD Ischaemic heart disease
Meta-analysis A statistical technique for combining (pooling) the results of a
number of studies that address the same question and report on the
same outcomes to produce a summary result.
Metabolic syndrome Overweight (abdominal adiposity), insulin insensitivity, higher
blood pressure, abnormal blood fat profile.
Methodological Features of the design or reporting of a clinical study which are
limitations known to be associated with risk of bias or lack of validity. Where a
study is reported in this guideline as having significant
methodological limitations, a recommendation has not been
directly derived from it.
MI Myocardial infarction
Microalbuminuria A low but clinically significant level of albumin and other proteins
in the urine.
NCC-CC The National Collaborating Centre for Chronic Conditions, set up
in 2000 to undertake commissions from the NICE to develop
clinical guidelines for the NHS.
NHS National Health Service – this guideline is written for the NHS in
England and Wales.
NICE National Institute for Health and Clinical Excellence – a special
health authority set up within the NHS to develop appropriate and
consistent advice on healthcare technologies, and to commission
evidence-based guidelines.
NPH insulin Neutral protamine Hagedorn insulin – a basal insulin, named after
the Danish researcher Hans Christian Hagedorn, and developed in
the 1940s. Synonymous with isophane insulin.
NS Not significant (at the 5% level unless stated otherwise).
NSC National Screening Committee (UK)
NSF National Service Framework – a nationwide initiative designed to
improve delivery of care for a related group of conditions.
Observational study Retrospective or prospective study in which the investigator
observes the natural course of events with or without control
groups, for example cohort studies and case-control studies.
Odds ratio A measure of relative treatment effectiveness. An odds ratio of 1
means equality between the comparisons in the study, and higher
numbers mean greater differences. The odds of an event happening
in the intervention group, divided by the odds of it happening in the
control group.
PDE5 inhibitors Phosphodiesterase type 5 inhibitors, a class of drugs developed in
recent years to treat erectile dysfunction.
21
4 Glossary and definitions
29. PROCAM Prospective Cardiovascular Münster Heart Study – an epidemiological
study performed in Germany.
Proteinuria The presence of protein in the urine.
p-values The probability that an observed difference could have occurred by
chance. A p-value of less than 0.05 is conventionally considered to
be ‘statistically significant’.
Quality of life A term used to describe an individual’s level of satisfaction with
their life and general sense of well-being. It is often measured as
physical, psychological and social well-being.
Quality of life-adjusted A measure of health outcome which assigns to each period of time
year (QALY) a weight, ranging from 0 to 1, corresponding to the health-related
quality of life during that period, where a weight of 1 corresponds to
optimal health, and a weight of 0 corresponds to a health state
judged equivalent to death; these are then aggregated across time
periods.
RCT Randomised controlled trial. A trial in which people are randomly
assigned to two (or more) groups – one (the experimental group)
receiving the treatment that is being tested, and the other (the
comparison or control group) receiving an alternative treatment, a
placebo (dummy treatment) or no treatment. The two groups are
followed up to compare differences in outcomes to see how effective
the experimental treatment was. Such trial designs help minimise
experimental bias.
RR Relative risk
Sensitivity analysis A measure of the extent to which small changes in parameters and
variables affect a result calculated from them. In this guideline,
sensitivity analysis is used in health economic modelling.
Short-form 36 (SF-36) The SF-36 assesses functioning and well-being in chronic disease.
Thirty-six items in eight domains are included, which cover
functional status, well-being, and overall evaluation of health.
Specialist A clinician whose practice is limited to a particular branch of
medicine or surgery, especially one who is certified by a higher
medical educational organisation.
Stakeholder Any national organisation, including patient and carers’ groups,
healthcare professionals and commercial companies with an interest
in the guideline under development.
Statistical significance A result is deemed statistically significant if the probability of the
result occurring by chance is less than 1 in 20 (p<0.05).
Systematic review Research that summarises the evidence on a clearly formulated
question according to a pre-defined protocol using systematic and
explicit methods to identify, select and appraise relevant studies, and
to extract, collate and report their findings. It may or may not use
statistical meta-analysis.
22
Type 2 diabetes
30. Technology appraisal Formal ascertainment and review of the evidence surrounding a
health technology, restricted in the current document to appraisals
undertaken by NICE.
Thiazolidinediones A group of drugs which improve insulin sensitivity in people with
reduced sensitivity to their own or injected insulin; presently the
licensed drugs are both of the chemical group known as trivially
‘glitazones’ or PPAR-γ agonists.
Type 1 diabetes Insulin-deficiency disease, developing predominantly in childhood,
characterised by hyperglycaemia if untreated, and with a
consequent high risk of vascular damage usually developing over a
period of decades.
Type 2 diabetes Diabetes generally of slow onset mainly found in adults and in
association with features of the metabolic syndrome. Carries a very
high risk of vascular disease. While not insulin dependent many
people with the condition eventually require insulin therapy for
optimal blood glucose control.
UAER Urinary albumin excretion rate
UKPDS United Kingdom Prospective Diabetes Study – a landmark study of
the effect of different diabetes therapies on vascular complications
in people with Type 2 diabetes.
WHO World Health Organization
23
4 Glossary and definitions
32. 5 Education
5.1 Structured education
5.1.1 Clinical introduction
Type 2 diabetes mellitus is a progressive long-term medical condition that is predominantly
managed by the person with the diabetes and/or their carer as part of their daily life. Accordingly,
understanding of diabetes, informed choice of management opportunities, and the acquisition of
relevant skills for successful self-management play an important role in achieving optimal
outcomes. Delivery of these needs is not always assured by conventional clinical consultations.
Structured programmes have been designed not only to improve people’s knowledge and skills,
but also to help motivate and sustain people with diabetes in taking control of their condition and
in delivering effective self-management.
Recent information from the Health Commission survey in 2007 suggests that only 11% of people
with Type 2 diabetes report being offered structured education.8 This suggests that the majority of
healthcare providers have found it difficult to implement and resource quality education
programmes that meet these standards. There appears to be an urgent need to ensure that all
people with Type 2 diabetes are offered high-quality structured education. The aims of structured
education and self-management programmes are to improve outcomes through addressing the
individual’s health beliefs, optimising metabolic control, addressing cardiovascular risk factors
(helping to reduce the risk of complications), facilitating behaviour change (such as increased
physical activity), improving quality of life and reducing depression. An effective programme will
also enhance the relationship between the person with diabetes and their healthcare professionals,
thereby providing the basis of true partnership in diabetes management.
The clinical question that has been addressed is how to deliver such education, including what
approaches deliver the intended benefits, and what components of the education process best
deliver the surrogate, self-care, and quality of life outcomes.
5.1.2 Methodological introduction and evidence statements
Please refer to the Technology Assessment Report ‘The clinical effectiveness of diabetes
education models for Type 2 diabetes: a systematic review’ commissioned by the NHS R&D
Health Technology Assessment (HTA) programme on behalf of the NCC-CC. Available at
www.ncchta.org/project/1550.asp
5.1.3 Health economic methodological introduction
Two papers were identified in the search for health economics. Neither study was conducted in
the UK and the results were not generalisable to the UK setting so both were excluded.9,10
5.1.4 From evidence to recommendations
The GDG noted that the last review of this area by a HTA on behalf of NICE in 2003 looked at
the evidence for structured education. Little robust evidence of the effectiveness of any
27
33. particular educational approach for people with Type 2 diabetes was found. One conclusion
was that further research was required, but meanwhile that educational programmes with a
theoretical basis demonstrated improved outcomes, and that group education was a more
effective use of resources and may have additional benefits.
Educational interventions are not only complex in themselves, but they also exist in a complex
environment with other aspects of managing a chronic disease. Such interventions will interact
with, and support medical management directed at vascular risk factors and that of diabetes
complications which have already developed. Their success is likely to depend on the
individual’s personal and cultural beliefs, the overall healthcare setting, their lifestyles, and
perhaps their educational background.
It was noted that to address some of the difficulties in describing and implementing effective
structured education and self-management programmes, a Patient Education Working Group
(PEWG) had been convened by the Department of Health and Diabetes UK, and had laid out in
detail the necessary requirements for developing high-quality patient education programmes.
The key criteria had been endorsed by the recent HTA review. The five standards were as follows.
1 Any programme should have an underpinning philosophy, should be evidence-based, and
suit the needs of the individual. The programme should have specific aims and learning
objectives, and should support development of self-management attitudes, beliefs,
knowledge and skills for the learner, their family and carers.
2 The programme should have a structured curriculum which is theory-driven, evidence-
based, resource-effective, have supporting materials, and be written down.
3 It should be delivered by trained educators who should have an understanding of the
educational theory appropriate to the age and needs of the programme learners, and be
trained and competent in delivery of the principles and content of the specific
programme they are offering.
4 The programme itself should be quality assured, be reviewed by trained, competent,
independent assessors and be assessed against key criteria to ensure sustained consistency.
5 The outcomes from the programme should be regularly audited.
The GDG found no reason to diverge from these principles. The GDG noted and endorsed the
importance of quality assurance and audit in this complex area.
As the intervention is complex, the measured outcomes of any particular programme are by
nature multifaceted and will vary with such factors as the timing in relation to diagnosis, critical
changes of therapy, or other critical clinical findings. Even then, appropriate study outcomes are
for the most part interim surrogate measures; no studies included late complications. However,
psychological outcomes as well as biomedical outcomes can be appropriately assessed, to
include quality of life and change in healthcare behaviours, and aspects of depressed mood.
More directly cognitive measures, knowledge, acquisition of skills, and changing health beliefs
were found to be useful indicators of a programme’s effectiveness.
The HTA commissioned for the current review included 14 studies, of which eight appeared to
have been conducted since 2003, and most were for people with established (rather than newly
diagnosed) Type 2 diabetes. The GDG noted that, as expected, some studies showed effects on
HbA1c, others improved body weight and other lifestyle changes, some improved quality of life
or knowledge, and yet others changed health beliefs or reduced depression. This diversity was
often simply a reflection of study aims and design. The HTA review acknowledged that health
28
Type 2 diabetes
34. psychology approaches and some methods of health promotion have a good evidence base, but
little is incorporated into studies of structured education, even though addressing health beliefs
and motivating individuals to change behaviour is a cornerstone of any educational
programme. Reported training for diabetes educators was poorly detailed in most studies.
The GDG was concerned that only three studies were UK-based. As cultural issues, patient
health beliefs and attitudes are likely to differ from one country to another, applicability of the
others may be limited. The GDG noted that the UK Diabetes Education and Self Management
for Ongoing and Newly Diagnosed (DESMOND study) found changes in health beliefs,
reduction in depression, and increases in self-reported physical activity, reduction in weight
and improvement in smoking status. In people with established diabetes there was useful
evidence from the X-PERT programme with improvements in HbA1c, reduced diabetes
medication, body weight, waist circumference, total serum cholesterol, diabetes knowledge and
increase in self-reported physical activity and treatment satisfaction.
Overall the GDG then felt that well-designed and well-implemented programmes were likely to
be effective and cost-effective interventions for people with Type 2 diabetes, in line with the
NICE TA. For those people in whom education delivered in a group setting is appropriate, it is
evidently likely to be more cost effective.
RECOMMENDATIONS
R1 Offer structured education to every person and/or their carer at and around the time of
diagnosis, with annual reinforcement and review. Inform people and their carers that
structured education is an integral part of diabetes care.
R2 Select a patient-education programme that meets the criteria laid down by the Department of
Health and Diabetes UK Patient Education Working Group.
q Any programme should be evidence-based, and suit the needs of the individual. The
programme should have specific aims and learning objectives, and should support
development of self-management attitudes, beliefs, knowledge and skills for the learner,
their family and carers.
q The programme should have a structured curriculum that is theory-driven and evidence-
based, resource-effective, has supporting materials, and is written down.
q The programme should be delivered by trained educators who have an understanding of
education theory appropriate to the age and needs of the programme learners, and are
trained and competent in delivery of the principles and content of the programme they are
offering.
q The programme itself should be quality assured, and be reviewed by trained, competent,
independent assessors who assess it against key criteria to ensure sustained consistency.
q The outcomes from the programme should be regularly audited.
R3 Ensure the patient education programme provides the necessary resources to support the
educators, and that educators are properly trained and given time to develop and maintain their
skills.
R4 Offer group education programmes as the preferred option. Provide an alternative of equal
standard for a person unable or unwilling to participate in group education.
29
5 Education
35. R5 Ensure the patient-education programmes available meet the cultural, linguistic, cognitive, and
literacy needs within the locality.
R6 Ensure all members of the diabetes healthcare team are familiar with the programmes of patient
education available locally, that these programmes are integrated with the rest of the care
pathway, and that people with diabetes and their carers have the opportunity to contribute to
the design and provision of local programmes.
30
Type 2 diabetes
36. 6 Lifestyle management/
non-pharmacological management
6.1 Dietary advice
6.1.1 Clinical introduction
All people with Type 2 diabetes should be supported to:
q try to achieve and maintain blood glucose levels and blood pressure in the normal range
or as close to normal as is safely possible
q maintain a lipid and lipoprotein profile that reduces the risk of vascular disease.
Optimal dietary behaviours can contribute to all of these.
Dietary intervention should address the individual’s nutritional needs, taking into account
personal choices, cultural preferences and willingness to change, and to ensure that quality of
life is optimised. It is usual that a registered dietician plays a key role in providing nutritional
care advice within the multidisciplinary diabetes team. It is also recognised that all team
members need to be knowledgeable about nutritional therapy, and give emphasis to consistent
dietary and lifestyle advice.11
The management of obesity is not specifically addressed in the current guideline. Readers
are referred to the NICE obesity management guideline which addresses the area in some
detail.12
Smoking cessation is not addressed in the current guideline. Readers are referred to the NICE
public health programme guidance on smoking cessation services, including the use of
pharmacotherapies, in primary care, pharmacies, local authorities and workplaces, with
particular reference to manual working groups, pregnant smokers and hard to reach
communities. Guidance was published in February 2008.
Clinical questions arise around the optimal strategies to reduce calorie intake (and thus
improve sensitivity to endogenous insulin), to control exogenous delivery of free sugars into the
circulation, to control blood pressure, and to optimise the blood lipid profile. Issues specifically
related to people with kidney disease or of medical use of fish oils are not considered in this
section. Issues specifically related to delivery of patient education are considered in the chapter
on Patient Education (see chapter 5).
6.1.2 Methodological introduction
The search attempted to identify RCTs and observational studies conducted in adults with
Type 2 diabetes which were assessing different forms of dietary advice targeting weight loss. A
sample size threshold of N=50 and a follow-up of at least 3 months were established as cut-off
points. Studies evaluating purely pharmacological interventions for weight reduction were
excluded.
31
37. There were only eight studies that addressed this question.13–20 Two RCTs were excluded due
to methodological limitations.* In all the studies, the intent was for participants to lose weight
and thereby improve glycaemic, lipid and blood pressure control.** Among the remaining six
studies there were four RCTs and two observational studies. No major methodological
limitations were identified across these studies.
s RCTs
One RCT17 compared the effects of a combined intervention; low-calorie diet, sibutramine
therapy and meal replacements with an individualised reduced calorie diet, and was the only
study to include the use of weight-loss medication.
Two RCTs used the American Diabetes Association (ADA) guidelines as a comparison group to
either a soy-based meal replacement intervention,13 N=104 with a 1-year follow-up, or a low-
fat vegan diet,14 N=99 with a 22-week follow-up.
A further RCT compared a low-fat with a low-carbohydrate diet.16
s Observational studies
A case series with a follow-up of 6.5 years investigated the onset of diabetic complications and
adherence to ADA recommendations.19 A prospective cohort study addressed the relationship
between eating habits and long-term weight gain, following a group of patients being managed
in primary care for a period of 4 years.20
It should be noted that the results of diet interventions aimed at patients with Type 2 diabetes
are difficult to interpret due to differences in the interventions, the populations, the study
designs and the outcomes reported.
As is obvious, isolated diet interventions without adequate educational support and
concomitant lifestyle changes are very unlikely to reduce risk factors and to improve clinical
outcomes and quality of life for patients with Type 2 diabetes.
6.1.3 Health economic methodological introduction
No health economic papers were identified.
6.1.4 Evidence statements
s Weight reduction and glycaemic control outcomes
RCTs
Studies that compared a meal replacement intervention with a reduced calorie diet
An RCT comparing a soy-based meal replacement with an individualised diet based on ADA
recommendations in obese Type 2 diabetics13 found that average weight reduction in the meal
replacement group was greater than that in the individualised diet group. At 6 months, the meal
32
Type 2 diabetes
* One RCT comparing the effects of a high-protein with a low-protein diet15 and another RCT comparing
low-carbohydrate versus conventional weight loss diets in severely obese adults.18
** Four studies focused on the effects of diet in obese Type 2 diabetics.
38. replacement group had lost on average 5.24±0.60 kg, and the individualised diet group had lost
an average of 2.85±0.67 kg (p=0.0031). At 1 year this difference was not significant with the
meal replacement group losing on average 4.35±0.81 kg and the individualised diet group
losing an average of 2.36±0.76 kg (p=0.0670). Level 1+
The same RCT reported that similar changes were observed in the body mass index (BMI) at
12 months with a reduction of 1.47±0.27 kg/m2 in the meal replacement group and
0.77±0.25 kg/m2 in the individualised diet group. Although these values were significantly
different from their baseline values, none were significantly different from each other (p=0.0687).
Level 1+
With respect to glycaemic control, the RCT found that mean HbA1c levels were significantly
lower in the meal replacement than in the individualised diet group, 0.49±0.22% (p=0.0291),
for the entire study period. Plasma glucose concentrations were significantly lower in the meal
replacement group than in the individualised diet group at 3 (p=0.04) and 6 (p=0.002) months,
but not at 12 months (p=0.595). Level 1+
The study by Redmon17 reported on a combination intervention including sibutramine, an
intermittent low-calorie diet with the use of meal replacements for 1 week every 2 months, and
the use of meal replacements between the low-calorie diet weeks. The comparison group
received an individualised diet plan with a 500–1,000 kcal energy deficit per day.
The study reported that at 1 year of follow-up, the combination therapy group had a
significantly greater weight loss of 7.3±1.3 kg than the standard therapy group 0.8±0.9 kg
(p<0.001), with most weight loss occurring during the low-calorie weeks and some weight gain
occurring in between the low-calorie weeks. Level 1+
In relation to glycaemic control, the study showed that at 1 year, HbA1c had declined from a
baseline of 8.1±0.2% to 7.5±0.3% in the combination therapy group but had remained
unchanged at 8.2±0.2% in the standard therapy group, and this difference was significant
(p=0.05). After adjusting for medication changes, this difference remained significant. In an
analysis of those participants whose medication had not changed, it was found that there was a
significant positive linear association between change in weight at 1 year and change in HbA1c
(r=0.53; p=0.006). A 5 kg decrease in weight at 1 year was associated with a 0.4% decrease in
HbA1c. Level 1+
Studies comparing a low-carbohydrate with a low-fat diet
One RCT16 examined the short-term effects, participants were followed up for 3 months, of a
low-carbohydrate diet compared with a reduced portion low-fat diet in obese Type 2 diabetics.
There was a significantly larger mean weight reduction in the low-carbohydrate arm (N=51) of
their RCT, 3.55±0.63 kg, than in the low-fat arm (N=51) which showed a mean reduction of
0.92±0.40 kg (p=0.001). Level 1+
The same RCT reported that glycaemic control improved in both arms of the trial.
Improvements were greater in the low-carbohydrate arm, HbA1c decreased from a baseline of
9.00±0.20%, by 0.55±0.17%, but this did not reach statistical significance. In the low-fat arm
HbA1c decreased from a baseline of 9.11±0.17% by 0.23±0.13% (p=0.132). Level 1+
33
6 Lifestyle management/non-pharmacological management
39. Studies comparing low- or modified-fat diets with reduced calorie diets
Barnard et al.14 investigated the effects of a low-fat vegan diet compared with a diet based on
ADA guidelines, on body weight and glycaemic control in an RCT with 99 Type 2 diabetics,
followed up for 22 weeks. During the study period, 43% (21/49) of vegan participants and
26% (13/50) of ADA participants reduced their diabetic medications, mainly as a result of
hypoglycaemia. Eight per cent in each group, 4/49 of the vegan group and 4/50 of the ADA
group, increased their medications.
The study concluded that for the whole sample, body weight was reduced in both groups by 5.8 kg
in the vegan group and 4.3 kg in the ADA group, but this difference was not statistically significant
(p=0.082). In those whose medication was stable this difference was significant with a 6.5 kg
reduction in the vegan group, and 3.1 kg in the ADA group, p<0.001. BMI declined by
2.1±1.5 kg/m2 in the vegan group and by 1.5±1.5 kg/m2 in the ADA group (p=0.08). The waist-
to-hip ratio declined in the vegan group 0.02±0.01 but not in the ADA group (p=0.003). Level 1+
With respect to glycaemic control, the RCT stated that while the HbA1c decline in both groups
was statistically significant from their baseline values with a decline of 0.96% (p<0.0001) in the
vegan group and 0.56% (p=0.0009) in the ADA group, there was no significant difference
between the groups (p=0.089). Again the results were different in those participants whose
medication was unchanged. The HbA1c decline was greater in the vegan group, 1.23±1.38%,
than in the ADA group, 0.38±1.11%, (p=0.01). Level 1+
Observational studies
In an observational study with 4 years of follow-up,20 the authors investigated the association
between eating behaviour and long-term weight gain. Ninety-seven Type 2 diabetics were
recruited at diagnosis and after initial nutrition advice were followed up for a period of 4 years.
The study found that at the end of follow-up, mean body weight change in men was a gain of
1.3±5.4 kg, whereas in women, there was a mean body weight reduction of –1.1±5.0 kg. These
changes were not statistically significant, (p values not given). Similarly, BMI increased in men
by 0.42±1.76 kg/m2 and decreased in women by 0.40±1.89 kg/m2, (p values not given).
Glycaemic outcomes were not reported. Level 2+
34
Type 2 diabetes
RCTs T= Comparison Comparison Weight/BMI Glycaemic control
Li (2005)13 1 year Soy-based meal Individualised diet Weight and HbA1c significantly
replacement BMI=NS lower in meal
replacement arm
Redmon 1 year Sibutramine + low- Individualised diet Weight reduction HbA1c significantly
(2003)17 calorie diet + meal significantly higher lower in combination
replacement in combination arm arm*
Daly (2006)16 3 months Low-carbohydrate Reduced portion low- Weight reduction HbA1c=NS
diet fat diet significantly higher in
carbohydrate arm
Barnard 22 weeks Low-fat vegan diet Diet based on ADA Weight=NS HbA1c=NS
(2006)14 guidelines
* A 5 kg decrease in weight at 1 year was associated with a 0.4% decrease in HbA1c.
Table 6.1 Summarised results for body weight reduction and glycaemic control across RCTs
40. In the second observational study,19 weight loss over the 6.5-year follow-up is not reported.
However, metabolic control did improve in patients over the period, with the proportion of
patients with HbA1c <7% increasing from 52.4% to 64.3% in men and from 43.9 to 50.9% in
women. It was not reported whether or not this was significant. Level 3
s Blood pressure and blood lipid control outcomes
RCTs
Studies that compared a meal replacement intervention with a reduced calorie diet
The RCT by Li et al.,13 reporting on the comparison of a soy-based meal replacement plan with
an individualised diet plan, did not report on changes in blood pressure during the study.
For the blood lipid control outcomes, while there were no significant differences between
groups during the study for lipid parameters, there were differences within the groups when
compared to baseline values. In the meal replacement group, there were decreases in total
cholesterol, triglycerol, low-density lipoprotein (LDL) and high-density lipoprotein (HDL) at
the end of the study, however these changes were only significant in the triglycerol group with
an overall decrease from baseline of 28.00 mg/dl (p=0.038). Decreases in total cholesterol were
significant at 3 (p<0.0001) and 6 (p=0.0037) months, but at 12 months with a reduction of
10.76 mg/dl from baseline, this was not significant (p=0.084). LDL decreased by 11.04 mg/dl at
3 months (p=0.024), but at 12 months the change from baseline had reduced to 6.10 mg/dl
(p=0.255). HDL had decreased by 0.97 mg/dl at 12 months (p=0.345). In the individualised
diet plan group, after initial decreases at 3 or 6 months, at 12 months there were increases in
total cholesterol by 5.26 mg/dl (p=0.396), LDL by 8.76 mg/dl (p=0.129) and HDL by 2.26 mg/dl
(p=0.012). Only in triglycerol levels was there a sustained decreased at 12 months with a
reduction from baseline of 28.89 mg/dl (p=0.119). Level 1+
In the study by Redmon17 which compared a combined intervention (described above) with an
individualised diet plan, at 1 year there were reductions in systolic and diastolic blood pressure
in both groups, although this did not differ between the groups. Systolic blood pressure reduced
in the combination group by 6±3 mmHg and by 6±2 mmHg in the comparison group.
Diastolic blood pressure reduced in the combination group by 3±1 mmHg and by 6±2 mmHg
in the comparison group. Level 1+
At 1 year, changes in fasting cholesterol, HDL, LDL and fasting triglycerides did not differ between
groups. There were reductions from baseline values in fasting cholesterol and LDL cholesterol in
both groups, with a decrease in fasting cholesterol of 6±8 mg/dl in the combination therapy group
and 17±9 mg/dl in the comparison group (p=0.90). LDL decreased by 12±5 mg/dl in the
combination therapy group and 13±6 mg/dl in the comparison group (p=0.89). Fasting
triglycerides decreased by 46±24 mg/dl in the combination group compared to an increase of 8±18
mg/dl in the comparison group, however this was not significant (p=0.07). Level 1+
Studies comparing a low-carbohydrate with a low-fat diet
At 12 weeks of follow-up, in the low-carbohydrate arm of this RCT16 there was a reduction in
systolic blood pressure of 6.24±2.96 mmHg and a reduction of 0.39±2.64 mmHg in the low-fat
arm, with no significant difference between the arms (p=0.147). Level 1+
35
6 Lifestyle management/non-pharmacological management
41. With respect to lipid parameters, there was a greater reduction in the total cholesterol: HDL
ratio in the low-carbohydrate arm, mean reduction of 0.48, than in the low-fat arm, mean
reduction 0.10 (p=0.011). There were also reductions in triglycerides in both arms, 0.67 mmol/l
in the low-carbohydrate arm and 0.25 in the low-fat arm, which did not approach statistical
significance (p=0.223). Level 1+
Studies comparing low- or modified-fat diets with reduced calorie diets
In the RCT comparing the low-fat vegan diet with the ADA diet,14,20 there were non-significant
reductions in systolic and diastolic blood pressure in both groups. In the vegan group systolic
blood pressure decreased by 3.8±12.6 mmHg (p<0.05) compared with baseline and in the ADA
group by 3.6±13.7 mmHg from baseline, with no significant difference between the groups
(p=0.93). Similarly the reduction in diastolic blood pressure was greater in the vegan group,
5.1±8.3 mmHg (p<0.0001) than in the ADA group 3.3±8.8 mmHg (p<0.05) although this was
not different between groups (p=0.30). Level 1+
For the entire sample, although lipid parameters decreased significantly from baseline values,
there were no significant differences between groups. Among those whose lipid controlling
medications remained constant (vegan N=39/49; ADA N=41/50), total cholesterol reduced in
the vegan groups by 33.5±21.5 mg/dl (p<0.0001), in the ADA group by 19.0±28.5 mg/dl
(p<0.0001) and this was a significantly different between groups (p=0.01). Reductions in HDL
cholesterol were not significantly different between the groups.
Reductions in non-HDL cholesterol were significantly lower than baseline in the vegan groups
27.6±21.1 mg/dl (p<0.0001) and in the ADA group 16.3±30.1 mg/dl (p<0.05), but not
significantly different between the groups (p=0.05).
LDL cholesterol reduced in the vegan group by 22.6±22.0 mg/dl (p<0.0001) and in the ADA
group by 10.7±23.3 mg/dl (p<0.05), and was significantly different between the groups (p=0.02).
The total-to-HDL cholesterol ratio and triglyceride concentrations fell for both groups, but there
was no difference between the groups. Level 1+
36
Type 2 diabetes
RCTs T= Comparison Comparison Blood pressure Lipid levels
Li (2005)13 1 year Soy-based meal Individualised diet No changes NS differences
replacement
Redmon 1 year Sibutramine + low Individualised diet NS differences NS differences
(2003)17 calorie diet + meal
replacement
Daly (2006)16 3 months Low-carbohydrate Reduced portion low- NS differences TC:HDL ratio
diet fat diet significantly lower in
carbohydrate arm
Barnard 22 weeks Low-fat vegan diet Diet based on ADA NS differences NS differences
(2006)14 guidelines
Table 6.2 Summarised results for blood pressure and lipid levels across RCTs
42. Observational studies
In the observational study investigating the effect of eating behaviours on weight,20 changes in
blood pressure or lipid profiles were not reported.
In the diabetes nutrition and complications trial19 changes in blood pressure were reported as
the proportion of patients who had a systolic blood pressure <130 mmHg, which decreased
from 28.6% at baseline to 11.9% at the end of the study. Similarly in women there was a
decrease from 15.8% at baseline to 8.8% after 6.5 years. The proportion of patients with a
diastolic blood pressure of <80 mmHg decreased from 26.2% to 21.4% and from 31.6% to
28.1% in men and women respectively.
In this study they reported the number of patients who were adherent to the ADA diet
recommendations and were able to achieve the recommended intakes of various types of fats.
They found that levels of adherence to the recommendations was low with only 26.6% of patients
consuming the recommended amount of saturated fatty acids (SFAs), 13.0% consuming the
recommended ≥10% of dietary energy from polyunsaturated fats, and 38.5% consuming the
recommended ≥60% of dietary energy from carbohydrates and monounsaturated fats. They also
estimated that 46.4% of patients consumed a ratio of polyunsaturated fatty acids (PUFAs)/SFAs
>0.4 and 69% consumed a ratio of monounsaturated fats (MUFAs)/SFAs >1.5. Patients who
consumed MUFAs/SFAs <1.5 had a 3.6–4.7 times greater risk of developing diabetic
complications (confidence intervals (CIs) not presented). Patients who consumed PUFAs/SFAs
<0.4 were 3.4–8.2 times more at risk of developing diabetic complications. Level 3
6.1.5 From evidence to recommendations
The GDG noted that there was little new evidence to warrant any change to previous views in
this field. The major consensus-based recommendations from the UK and USA emphasise
sensible practical implementation of nutritional advice for people with Type 2 diabetes. Other
relevant NICE guidance should be considered where relevant, including clinical guideline
no. 43 on the assessment and management of overweight and obesity in adults and children and
clinical guideline no. 48 which gives dietary and lifestyle advice post-MI. Overlap with the
NICE/RCP Type 1 diabetes guideline was noted. Management otherwise will concentrate on
principles of healthy eating (essentially those for optimal cardiovascular risk protection), and
reduction of high levels of free carbohydrate in food that are hyperglycaemic in the presence of
defective insulin secretory reserve.
If people are currently gaining weight, weight maintenance is advantageous.
The GDG noted that in some people with Type 2 diabetes and weight problems it might be
appropriate to consider pharmacotherapy, however this was not within the clinical questions
addressed.
As with Patient Education (see chapter 5) delivery of dietary advice was noted to depend not
only on specific skills, but also required all members of the diabetes care team to be familiar
with local policy and thus delivering consistent advice.
Concerns continue to be noted over the promotion of ‘diabetic foods’ which may be low in
classical sugars but high in calories and thus unsuitable as well as unnecessary for the overweight.
While reduction in weight was clearly understood to be beneficial through improvements in
37
6 Lifestyle management/non-pharmacological management
43. insulin insensitivity (whether relying on endogenous or exogenous insulin), low-carbohydrate
diets were noted to be of unproven safety in the long term and thus could not be endorsed.
Similarly high-protein diets are acknowledged as promoting short-term weight loss, but cannot
be recommend as safe in the long term.
A dietary plan for people with diabetes would follow the principles of healthy eating in the
population, and thus include carbohydrate from fruits, vegetables, wholegrains, and pulses
(and thus high fibre and low glycaemic index), reduction in salt intake, the inclusion of low-fat
milk and oily fish, and control of saturated and trans fatty acid intake.
The importance of advice on alcohol to the overweight and to those prone to hypoglycaemia
through use of insulin secretagogues or insulin was judged important.
RECOMMENDATIONS
R7 Provide individualised and ongoing nutritional advice from a healthcare professional with
specific expertise and competencies in nutrition.
R8 Provide dietary advice in a form sensitive to the individual’s needs, culture and beliefs being
sensitive to their willingness to change, and the effects on their quality of life.
R9 Emphasise advice on healthy balanced eating that is applicable to the general population when
providing advice to people with Type 2 diabetes. Encourage high-fibre, low glycaemic index
sources of carbohydrate in the diet, such as fruit, vegetables, wholegrains and pulses; include
low-fat dairy products and oily fish; and control the intake of foods containing saturated and
trans fatty acids.
R10 Integrate dietary advice with a personalised diabetes management plan, including other aspects
of lifestyle modification, such as increasing physical activity and losing weight.
R11 Target, for people who are overweight, an initial body weight loss of 5–10%, while remembering
that lesser degrees of weight loss may still be of benefit and that larger degrees of weight loss in
the longer term will have advantageous metabolic impact.
R12 Individualise recommendations for carbohydrate and alcohol intake, and meal patterns.
Reducing the risk of hypoglycaemia should be a particular aim for a person using insulin or an
insulin secretagogue.
R13 Advise individuals that limited substitution of sucrose-containing foods for other carbohydrate
in the meal plan is allowable, but that care should be taken to avoid excess energy intake.
R14 Discourage the use of foods marketed specifically for people with diabetes.
R15 When patients are admitted to hospital as inpatients or to any other institutions, implement a
meal planning system that provides consistency in the carbohydrate content of meals and
snacks.
38
Type 2 diabetes
44. 6.2 Management of depression
6.2.1 Clinical introduction
Psychological well-being is clearly part of being healthy. It is an important part of healthcare
management of any condition where psychological health is impaired or where it has particular
impact on clinical management.
There is evidence of a high prevalence of psychological ill-health in people with diabetes,
notably for depression,21 which is often under-recognised.22 Additionally because of the
importance of self-care to the management of the condition, there is evidence that
psychological ill-health is associated with adverse effects on other aspects of the long-term
health of people with Type 2 diabetes.23–25
Formal assessment of psychological well-being is not a standard part of practice in diabetes care
in the UK. Other guidelines, including the NICE guideline for people with Type 1 diabetes, have
emphasised the importance of recognising and managing depression. Only general
recommendations have been made regarding being alert to problems, availability of skills to
manage routine psychological disorders, and of appropriate referral to those with special
expertise where the condition is more severe.26 NICE has recently published a guideline on the
management of depression.27
No evidence search has been performed for the purpose of the current guideline due to the
availability of the NICE depression guideline. People with Type 2 diabetes with psychological
and/or depressive disorders should be identified by continuing professional awareness, and
managed in accordance with current national guidelines.
39
6 Lifestyle management/non-pharmacological management
45. 7 Glucose control levels
7.1 Clinical monitoring of blood glucose control
7.1.1 Clinical introduction
The risk of arterial disease and microvascular complications in people with diabetes are known
to be related to the extent of hyperglycaemia with time. While the lifestyle, oral agent, and
injectable therapies discussed in this guideline can improve blood glucose control, their efficacy
is limited, as the underlying pathogenesis of diabetes worsens with time. As symptoms are not
a reliable guide to blood glucose control in people on therapy, it is important to have an
accurate means of measuring blood glucose control over time, to enable decision-making.
This section addresses the clinical questions as to the tests of blood glucose control best
predictive of future vascular damage from diabetes, the nature of the relationship between test
results and such vascular risk, how tests should be deployed in clinical practice, and how they
might be interpreted.
7.1.2 Methodological introduction
The UKPDS is a large (N=3,867) landmark study with a 10-year follow-up period. It evaluated
whether in people newly diagnosed with Type 2 diabetes more intense therapy to achieve tighter
glycaemic control would result in a greater reduction in the incidence of microvascular and
macrovascular complications than would conservative therapy. Due to the size and duration of
this study, other studies published from 2001 onwards in this area were only considered if they
had a sample size of at least N=2,000 people with Type 2 diabetes, or mixed Type 1 and 2 diabetes
populations. Studies were not reviewed if they simply found significant associations between
HbA1c and diabetes complications without giving further information about that association.
Published results from the UKPDS were included in this review if they specifically reported
results on the relationship between HbA1c and microvascular and/or macrovascular
complications. One prospective observational study28 was identified which analysed the UKPDS
glucose control results in terms of both macrovascular and microvascular complications.
A meta-analysis29 was also identified which assessed the association between glycosylated
haemoglobin and cardiovascular (CV) disease in people with diabetes. This included an analysis
of 10 studies specifically of people with Type 2 diabetes. As some of the cohorts included in this
analysis were participants in the UKPDS study, it is necessary to be alert to double-counting.
Other observational studies identified, which were not published results of the UKPDS study or
included in the meta-analysis, considered the relationship between glycaemic control and CV
and renal risk,30 and between glycaemic control and heart failure.31
7.1.3 Health economic methodological introduction
One paper was identified which was excluded from further consideration as it was not possible
to compare the costs between patients with good or poor control because the well-controlled
patients were probably earlier in the course of the disease.32 Two evaluations based on the
UKPDS were identified that were considered to be of good quality.33
41
46. 42
Type 2 diabetes
7.1.4 Evidence statements
q The risk of each of the microvascular and macrovascular complications of Type 2 diabetes
and cataract extraction was strongly associated with hyperglycaemia as measured by
updated mean HbA1c.
q There was no indication of a threshold for any complication below which risk no longer
decreased, nor a level above which risk no longer increased.
q There was an increase in CV risk with increasing levels of glycosylated haemoglobin in
persons with Type 2 diabetes.
Microvascular/macrovascular complications or 1% reduction in updated mean HbA1c was
mortality associated with reductions in risk of*
Any endpoint related to diabetes (MI, sudden death, angina, 21%, 95% CI 17% to 24% (p<0.0001)
stroke, renal failure, lower extremity amputation or death
from peripheral vascular disease, death from
hyperglycaemia or hypoglycaemia, heart failure, vitreous
haemorrhage, retinal photocoagulation, and cataract
extraction)
For deaths related to diabetes (MI, sudden death, stroke, 21%, 95% CI 15% to 27% (p<0.0001)
lower extremity amputation or fatal peripheral vascular
disease, renal disease, hyperglycaemia or hypoglycaemia)
All cause mortality 14%, 95% CI 9% to 19% (p<0.0001)
MI (fatal MI, non-fatal MI, and sudden death) 14%, 95% CI 8% to 21% (p<0.0001)
Stroke (fatal and non-fatal stroke) 12%, 95% CI 1% to 21% (p=0.035)
Peripheral vascular disease (lower extremity amputation or 43%, 95% CI 31% to 53% (p<0.0001)
death from peripheral vascular disease)
Microvascular complications (retinopathy requiring 37%, 95% CI 33% to 41% (p<0.0001)
photocoagulation, vitreous haemorrhage, and fatal or
non-fatal renal failure)
Heart failure (non-fatal, without a precipitating MI) 16%, 95% CI 3% to 26% (p=0.016)
Cataract extraction 19%, 95% CI 11% to 26% (p<0.0001)
The adjusted incidence rates for any endpoint related to diabetes increased with each higher category of
updated mean HbA1c, with no evidence of a threshold and with a three-fold increase over the range of
updated mean HbA1c of less than 6%, to equal to, or more than, 10%.
* Data adjusted for age at diagnosis of diabetes, sex, ethnic group, smoking, presence of albuminuria, systolic blood
pressure, high and low density lipoprotein cholesterol and triglycerides
Table 7.1 UKPDS study28
N=3,642 included in the analysis of relative risk
Level of evidence 2++
47. q There was an independent progressive relationship between GHb and incident
cardiovascular events, renal disease and death.
q There was an independent graded association between glycaemic control and incidence of
hospitalisation and/or death due to heart failure.
43
7 Glucose control levels
Pooled RR for each 1 percentage point
Cardiovascular complications or mortality increase in glycosylated haemoglobin*
Total CV (combining 10 studies of coronary heart disease 1.18 (95% CI 1.10 to 1.26)
alone, stroke alone, and stroke and coronary heart disease
combined)
Coronary heart disease (combining five studies of 1.13 (95% CI 1.06 to 1.20)
MI, angina and IHD)
Fatal coronary heart disease (combining five studies of 1.16 (95% CI 1.07 to 1.26)
fatal MI, angina and IHD)
Cerebrovascular disease (combining three studies of fatal 1.17 (95% CI 1.09 to 1.25)
and non-fatal stroke)
Peripheral arterial disease (combining three studies of 1.28 (95% CI 1.18 to 1.39)
lower extremity peripheral arterial disease, amputation and
claudication)
* All RR estimates in the pooled analyses were from the most fully adjusted multivariate model
IHD, ischaemic heart disease; RR, relative risk
Table 7.2 Meta-analysis of prospective cohort studies29
N=10 studies in people with Type 2 diabetes
Level of evidence 2+
A 1% absolute rise in updated glycated
haemoglobin was associated with relative
Cardiovascular and renal complications risks of*
Future CV events (the first occurrence of one or more of 1.07, 95% CI 1.01 to 1.13 (p=0.014)
the following: non-fatal MI, stroke or CV death)
Death 1.12, 95% CI 1.05 to 1.19 (p=0.0004)
Hospitalisation for heart failure 1.20, 95% CI 1.08 to 1.33 (p=0.0008)
Overt nephropathy 1.26, 95% CI 1.17 to 1.36 (p=0.0001)
There was a consistent and progressive relationship between the GHb level (both baseline and updated) and
the age and sex adjusted relative hazard of the above outcomes. All showed significant trends with the
strongest relationships being seen with the updated GHb level
* After adjusting for age, sex, diabetes duration, blood pressure, BMI, hyperlipidaemia and ramipril
Table 7.3 Prospective observational study of participants in the Heart Outcomes Prevention
Evaluation (HOPE) study30
N=3,529
Level of evidence 2+