Clinical Practice Guideline on management of patients with diabetes and chronic kidney disease
•
2 likes•1,381 views

This document provides a summary of a clinical practice guideline on managing patients with diabetes and chronic kidney disease (CKD) stage 3b or higher. It outlines the composition of the guideline development group, which included nephrologists, endocrinologists, and epidemiologists from several European countries. The group aimed to provide guidance on evidence-based approaches to improve care for this patient population. The guideline's target audience is healthcare professionals treating adults with both diabetes and reduced kidney function (eGFR <45 mL/min). It focuses on developing standards of care for managing this complex patient group.

Recommended
Recommended
More Related Content
What's hot
What's hot (20)
Similar to Clinical Practice Guideline on management of patients with diabetes and chronic kidney disease
Similar to Clinical Practice Guideline on management of patients with diabetes and chronic kidney disease (20)
More from Ahmed Albeyaly
More from Ahmed Albeyaly (20)
Clinical Practice Guideline on management of patients with diabetes and chronic kidney disease
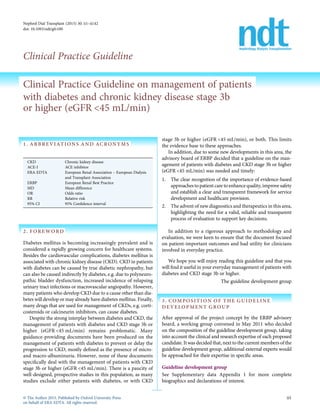
- 1. Nephrol Dial Transplant (2015) 30: ii1–ii142 doi: 10.1093/ndt/gfv100 Clinical Practice Guideline Clinical Practice Guideline on management of patients with diabetes and chronic kidney disease stage 3b or higher (eGFR <45 mL/min) 1. ABBREVIATIONS AND ACRONYMS CKD Chronic kidney disease ACE-I ACE inhibitor ERA-EDTA European Renal Association – European Dialysis and Transplant Association ERBP European Renal Best Practice MD Mean difference OR Odds ratio RR Relative risk 95% CI 95% Confidence interval 2. FOREWORD Diabetes mellitus is becoming increasingly prevalent and is considered a rapidly growing concern for healthcare systems. Besides the cardiovascular complications, diabetes mellitus is associated with chronic kidney disease (CKD). CKD in patients with diabetes can be caused by true diabetic nephropathy, but can also be caused indirectly by diabetes, e.g. due to polyneuro- pathic bladder dysfunction, increased incidence of relapsing urinary tract infections or macrovascular angiopathy. However, many patients who develop CKD due to a cause other than dia- betes will develop or mayalready have diabetes mellitus. Finally, many drugs that are used for management of CKDs, e.g. corti- costeroids or calcineurin inhibitors, can cause diabetes. Despite the strong interplay between diabetes and CKD, the management of patients with diabetes and CKD stage 3b or higher (eGFR <45 mL/min) remains problematic. Many guidance-providing documents have been produced on the management of patients with diabetes to prevent or delay the progression to CKD, mostly defined as the presence of micro- and macro-albuminuria. However, none of these documents specifically deal with the management of patients with CKD stage 3b or higher (eGFR <45 mL/min). There is a paucity of well-designed, prospective studies in this population, as many studies exclude either patients with diabetes, or with CKD stage 3b or higher (eGFR <45 mL/min), or both. This limits the evidence base to these approaches. In addition, due to some new developments in this area, the advisory board of ERBP decided that a guideline on the man- agement of patients with diabetes and CKD stage 3b or higher (eGFR <45 mL/min) was needed and timely: 1. The clear recognition of the importance of evidence-based approachesto patient care to enhance quality, improve safety and establish a clear and transparent framework for service development and healthcare provision. 2. The advent of new diagnostics and therapeutics in this area, highlighting the need for a valid, reliable and transparent process of evaluation to support key decisions. In addition to a rigorous approach to methodology and evaluation, we were keen to ensure that the document focused on patient-important outcomes and had utility for clinicians involved in everyday practice. We hope you will enjoy reading this guideline and that you will find it useful in your everyday management of patients with diabetes and CKD stage 3b or higher. The guideline development group 3. COMPOSITION OF THE GUIDELINE DEVELOPMENT GROUP After approval of the project concept by the ERBP advisory board, a working group convened in May 2011 who decided on the composition of the guideline development group, taking into account the clinical and research expertise of each proposed candidate. It was decided that, next to the current members of the guideline development group, additional external experts would be approached for their expertise in specific areas. Guideline development group See Supplementary data Appendix 1 for more complete biographics and declarations of interest. © The Author 2015. Published by Oxford University Press on behalf of ERA-EDTA. All rights reserved. ii1
- 2. Henk Bilo Consultant physician, Department of Internal Medicine, Isala Clinics, Zwolle, the Netherlands University Medical Center, Groningen, the Netherlands Luis Coentrão Consultant nephrologist, Nephrology and Infectious Diseases Research and Development Group, INEB-(I3S), University of Porto, Porto, Portugal Cécile Couchoud Epidemiologist, REIN registry, Agence de la biomédecine, Saint-Denis La Plaine, France Adrian Covic Consultant nephrologist, Clinic of Nephrology, C. I. Parhon University Hospital, Gr T. Popa, University of Medicine and Pharmacy, Iasi, Romania Johan De Sutter Consultant cardiologist, Maria Middelares Ziekenhuis, Ghent, Belgium Christiane Drechsler Consultant nephrologist, Division of Nephrology, University of Würzburg, Würzburg, Germany Member of the ERBP Methods Support Team Luigi Gnudi Consultant endocrinologist, Unit for Metabolic Medicine, Department of Diabetes and Endocrinology, Cardiovascular Division, Guy’s and St. Thomas Hospital, King’s College London, London SE1 9NH, United Kingdom David Goldsmith Consultant nephrologist, Renal and Transplantation Depart- ment, Guy’s Hospital, London, UK James Heaf Consultant nephrologist, Department of Nephrology B, Herlev Hospital, University of Copenhagen, Copenhagen, Denmark Olof Heimburger Consultant nephrologist, Division of Renal Medicine, Depart- ment of Clinical Science, Karolinska Institutet, Huddinge University Hospital, Stockholm, Sweden Kitty J. Jager Epidemiologist, director of the ERA-EDTA registry, Depart- ment of Medical Informatics, Amsterdam Medical Center, Am- sterdam, the Netherlands Hakan Nacak PhD-student, Department of Clinical Epidemiology, University Medical Centre, Leiden, the Netherlands Maria José Soler Consultant nephrologist, Department of Nephrology, Hospital del Mar, Barcelona, Spain, Institut Hospital del Mar of Medical Research (IMIM), Barcelona, Spain Liesbeth Van Huffel Resident endocrinologist, Endocrinology Division, Ghent University Hospital, Ghent, Belgium. Charlie Tomson Consultant nephrologist, Newcastle upon Tyne Foundation Trust, Newcastle upon Tyne, United Kingdom Steven Van Laecke Consultant nephrologist, Renal Division, Ghent University Hospital, Ghent, Belgium Laurent Weekers Consultant nephrologist, Service of Nephrology, Dialysis and Transplantation, Centre Hospitalier Universitaire, Liège, Belgium Andrzej Wieçek Consultant nephrologist, Department of Nephrology, Endo- crinology, and Metabolic Diseases, Medical University of Silesia, Katowice, Poland ERBP methods support team Davide Bolignano Clinical researcher, Institute of Clinical Physiology, National Council of Research, Reggio Calabria-Italy Maria Haller Specialist registrar nephrology, KH Elisabethinen Linz, Linz, Austria Evi Nagler Consultant nephrologist, Renal Division, Ghent University Hospital, Ghent, Belgium Ionut Nistor Consultant nephrologist, Gr. T. Popa University of Medicine and Pharmacy, Iasi, Romania Sabine van der Veer Implementation specialist, Centre for Health Informatics, University of Manchester, Manchester, United Kingdom Wim Van Biesen (chair of the guideline development group) Chair of ERBP Consultant nephrologist, Renal Division, Ghent University Hospital, Ghent, Belgium 4. CONFLICT OF INTEREST 4.1. Conflict of interest policy We required all members of the guideline development group to complete a detailed ‘declaration of interest statement’ including all current and future conflicts of interest as well as past conflicts of interest restricted to 2 years before joining the guideline development group. ERBP felt that excluding all CLINICALPRACTICEGUIDELINE ii2 Clinical Practice Guideline
- 3. individuals with some degree of potential conflict of interest would prevent the assembly of a guideline development group. We therefore allowed members of the guideline development group to have past financial and/or intellectual conflicts of interest. We did not attach any consequences to the stated inter- ests, but rather insisted on transparency. All members of the guideline development group were allowed to participate in all discussions and had equal weight in formulating the state- ments. All were allowed equal involvement in data extraction and writing the rationales. 4.2. Guideline development group declaration of interest The declaration of interest forms are available from http://www.european-renal-best-practice.org/content/ERBP- Workgroup-Diabetes-0 and are updated on a regular basis. They can also be found in Supplementary data (Appendix 1). 5. PURPOSE AND SCOPE OF THIS GUIDELINE 5.1. Why was this guideline produced? This clinical practice guideline was designed to facilitate in- formed decision-making on the management of adult indivi- duals with diabetes mellitus and CKD stage 3b or higher (eGFR <45 mL/min). It was not intended to define a standard of care, and should not be construed as such. It should not be interpreted as a prescription for an exclusive course of management. 5.2. Who is this guideline for? This guideline intends to support clinical decision making by any health care professional caring for patients with diabetes and CKD stage 3b or higher (eGFR <45 mL/min), i.e. for gen- eral practitioners, internists, surgeons and other physicians dealing with this specific patient population in both an out- patient and an in-hospital setting. The guideline also aims to inform about the development of standards of care by policy-makers. 5.3. What is this guideline about? The intended scope of the guideline was determined at the first meeting held in Brussels in May 2011 with a steering group assembled for this purpose by the ERBP advisory board. This steering group defined a set of healthcare questions related to the management of patients with diabetes and CKD stage 3b or higher (eGFR <45 mL/min) 3b–5. An electronic survey was taken among all members of European Renal Association-European Dialysis and Transplant Association to prioritize these questions. 5.3.1. Population. The guideline covers adults with diabetes mellitus and CKD stage 3b or higher (eGFR <45 mL/min), as defined by the recent KDIGO classification [1]. The guideline does not cover interventions in patients with diabetes and CKD stages 1–2 to prevent or delay development of micro- or macro-albuminuria. 5.3.2. Conditions. The guideline specifically covers the man- agement of patients with diabetes mellitus and CKD stage 3b or higher (eGFR <45 mL/min), with a focus on three major areas: (i) selection of renal replacement modality; (ii) management of glycaemic control; (iii) management and prevention of cardio- vascular comorbidity. 5.3.3. Healthcare setting. This guideline targets the manage- ment of patients with diabetes and CKD stage 3b or higher (eGFR <45 mL/min) in primary, secondary and tertiary health- care settings. 5.3.4. Clinical management. The guideline intends to pro- vide an evidence-based rationale for the day-to-day manage- ment of patients with diabetes and CKD stage 3b or higher (eGFR <45 mL/min), and to develop pathways of care by sys- tematically compiling available evidence in this area. It provides an evidence-based rationale on why management of patients with diabetes and CKD stage 3b or higher (eGFR <45 mL/ min) should or should not be different from patients with dia- betes but without CKD stage 3b or higher (eGFR <45 mL/min), or from patients with CKD stage 3b or higher (eGFR <45 mL/ min) but without diabetes. In line with the mission statement of ERBP, the guideline document intends to inform all involved stakeholders and to stimulate shared decision-making [2]. 6. METHODS FOR GUIDELINE DEVELOPMENT 6.1. Establishment of the guideline development group As defined by our guideline development methodology [3], the ERBP advisory board installed a steering group, which, after selection of the topics, selected further members for the guide- line development group. Members of the steering group and the guideline development group were selected based on their clin- ical and research expertise and their willingness to invest the ne- cessary time and effort to perform the task according to the proposed deadlines and the agreed methodology. The guideline development group consisted of content experts, including in- dividuals with expertise in endocrinology and diabetes, general internal medicine and clinical nephrology. In addition, experts in epidemiology and systematic review methodology were added to the guideline development group. The ERBP methods support team provided methodological input and practical as- sistance throughout the process. 6.2. Development of clinical questions With the final guideline scope as point of departure, the guideline devleopment group identified specific research ques- tions for which a systematic review would be conducted. All questions addressed issues related to one of the following three areas: 1. Renal replacement modality selection in patients with dia- betes with end-stage renal disease (CKD stage 5). 2. Glycaemic control in patients with diabetes and CKD stage 3b or higher (eGFR <45 mL/min). CLINICALPRACTICEGUIDELINE C l i n i c a l P r a c t i c e G u i d e l i n e ii3
- 4. 3. Management of cardiovascular risk in patients with diabetes and CKD stage 3b or higher (eGFR <45 mL/min). 6.3. Development of review questions The methods support team assisted in developing review questions, i.e. framing the clinical questions into a searchable format. This required detailed specification of the patient group (P), intervention (I), comparator (C) and outcomes (O) for intervention questions and the patient group, index tests, reference standard and target conditions for questions of diagnostic test accuracy [4]. For each question, the guideline development group agreed upon explicit review question criteria including study design features (see Appendices for detailed review questions and PICO tables). 6.4. Assessment of the relative importance of the outcomes For each intervention question, the guideline development group compiled a list of outcomes, reflecting both benefits and harms of alternative management strategies. They ranked the outcomes as critical, highly important or moderately im- portant according to the relative importance of that outcome in the decision-making process (Table 1). 6.5. Target population perspectives An effort was made to capture the target population perspec- tives by adopting different strategies. ERBP has a permanent patient representative on its advisory board. Although he was not included in the guideline develop- ment group or in the evidence review process, drafts of the guideline document were sent out for his review, and his com- ments were taken into account in revising and drafting the final document. 6.6. Searching for evidence 6.6.1. Sources. The ERBP methods support team searched The Cochrane Database of Systematic Reviews (May 2014), DARE (May 2014), CENTRAL (May 2014) and Medline (1946 to May, week 4, 2014) for all questions. The search strat- egies combined subject headings and text words for the patient population, index test and target condition for the diagnostic questions and subject headings and text words for the popula- tion and intervention for the intervention questions. The de- tailed search strategies are available in Appendix 3. Reference lists from the included publications were screened to identify additional papers. The methods support team also searched guideline databases and organizations including the National Guideline Clearinghouse, Guidelines International Network, Guidelines Finder, Centre for Reviews and Dissemin- ation, National Institute for Clinical Excellence and professional societies of nephrology and endocrinology for guidelines to screen the reference lists. 6.6.2. Selection. For diagnostic questions, we included all studies that compared any of the pre-defined clinical or biochemical tests with a golden standard reference test. For intervention questions, we included all studies in which one of the pre-defined interventions was evaluated in humans. We excluded case series that reported on benefit if the number of participants was ≤5, but included even individual case re- ports if they reported an adverse event. No restriction was made based on language. We used the Early Reference Organisation Software (EROS) ( http://www.eros-systematic-review.org) to organize the initial step of screening and selection of papers. The title and abstract of all papers retrieved by the original search were made available to those responsible for screening through this system. For each question, a member of the ERBP methods support team and one member of the guideline development group dedicated to this question independently screened all titles and abstracts and discarded the clearly irrelevant ones and those that did not meet the inclusion criteria. Any discrepancies at this stage were re- solved by consensus. In a second round, full texts of potentially relevant studies were retrieved and independently examined for eligibility and final inclusion in the data extraction step. Any discrepancies were resolved by consensus. If no consensus could be reached, the disagreement was settled by group arbitrage. The flow of the paper selection is presented for each question in Appendix 5. 6.6.3. Data extraction and critical appraisal of individual studies. For each included study, we collected relevant infor- mation on design, conduct and relevant results through a tailor- made online software system. For each question, two reviewers independently extracted all data. We produced tables displaying the data extraction of both reviewers. Any discrepancies were resolved by consensus, and if no consensus could be reached, disagreements were resolved by a third independent referee. From these data extraction tables, we produced merged consen- sus evidence tables for informing the recommendations. The evidence tables are available in Appendix 6. Table 1. Suggested outcomes and level of importance Critically important outcomes Survival/mortality Progression to end-stage kidney disease/Deterioration of residual renal function Hospital admissions: Highly important Qol/patient satisfaction Major morbid events: Myocardial infarction Stroke Amputation Loss of vision Highly important outcomes Hypoglycaemia Delayed wound healing Infection Visual disturbances Pain Functional status Moderately important outcomes (surrogate outcomes) Hyperglycaemia Glycaemic control Glycated haemoglobin Point of care (measure) Question-specific outcomes As mentioned in the specific PICO questions CLINICALPRACTICEGUIDELINE ii4 Clinical Practice Guideline
- 5. Risk of bias of the included studies was evaluated using validated checklists, as recommended by the Cochrane Collab- oration. These were AMSTAR for Systematic Reviews [5], the Cochrane Risk of Bias tool for randomized controlled trials (RCTs) [6], the Newcastle Ottawa scale for cohort and case– control studies [7] and QUADAS for diagnostic test accuracy studies [8]. Data were compiled centrally by the ERBP methods support team. 6.6.4. Evidence profiles. For research questions regarding therapeutic interventions, the methods support team con- structed evidence profiles using the ‘Grading of Recommenda- tions Assessment, Development and Evaluation (GRADE) toolbox’ developed by the international GRADE working group (http://www.gradeworkinggroup.org/). The evidence profiles include details of the quality assessment as well as summary—pooled or unpooled—outcome data, an absolute measure of intervention effect when appropriate, and the sum- mary of quality of evidence for each outcome. Evidence profiles were reviewed and approved with the rest of the guideline de- velopment group. Evidence profiles were constructed only for research questions addressed by at least two RCTs. If the body of evidence for a particular comparison of interest consisted of only one RCT or of solely observational data, the summary tables provided the final level of synthesis. 6.7. Rating the quality of the evidence for each outcome across studies The guideline development group rated the overall quality of the evidence for each intervention separately addressing each outcome (see Table 3). In accordance with GRADE, the guide- line development group initially categorized the quality of the evidence for each outcome as high if it originated predominant- ly from RCTs and as low if it originated from observational studies. We subsequently downgraded the quality of the evi- dence one or two levels if results from individual studies were at a high or very high risk of bias, there were serious inconsist- encies in the results across studies, the evidence was indirect, the data were sparse or imprecise or publication bias was suspected. The quality of evidence arising from observational studies was upgraded if effect sizes were large, there was evidence of a dose– response gradient, or all plausible confounding would either reduce a demonstrated effect or suggest a spurious effect when results showed no effect (Table 2). Uncontrolled case ser- ies and case reports automatically received downgrading from a ‘low’ to ‘very low’ level of evidence for risk of bias, so that no other reasons for downgrading were marked. 6.8. Formulating and grading statements 6.8.1. Statements. After the evidence tables and profiles had been prepared, revised and approved, the guideline develop- ment group formulated and graded the statements during two full-day plenary meetings. Recommendations can be for or against a certain strategy. The guideline development group drafted the statements based on their interpretation of the available evidence. Individ- ual statements were made and discussed in an attempt to reach group consensus. If we could not reach consensus, we held a formal open vote by show of hands. An arbitrary 80% had to cast a positive vote for a statement to be accepted. Voting results and reasons for disagreement were specified in the rationale where applicable. In accordance to GRADE [9], we classified the strength of the statements as strong (coded 1) or weak (coded 2) (Table 4, Figure 1). Table 2. Method of rating the quality of the evidence. Adapted from Balshem et al. [222] Step 1: Starting grade according to study design Step 2: Lower if Step 3: Higher if Step 4: Determine final grade for quality of evidence Randomized trials = high Observational studies = low Risk of bias − 1 Serious − 2 Very serious Inconsistency − 1 Serious − 2 Very serious Indirectness − 1 Serious − 2 Very serious Imprecision − 1 Serious − 2 Very serious Publication Bias − 1 Likely − 2 Very likely Large effect + 1 Large + 2 Very large Dose–response + 1 Evidence of a gradient All plausible confounding + 1 Would reduce a demonstrated effect + 1 Would suggest a spurious effect when results show no effect High (four plus: ⊕⊕⊕⊕) Moderate (three plus: ⊕⊕⊕○) Low (two plus: ⊕⊕○○) Very Low (one plus: ⊕○○○) Table 3. Grade for the overall quality of evidence. Adapted from Guyatt et al. [223] Grade Quality Level Definition A High We are confident that the true effects lie close to those of the estimates of the effect. B Moderate The true effects are likely to be close to the estimates of the effects, but there is a possibility that they are substantially different. C Low The true effects might be substantially different from the estimates of effects. D Very low The estimates are very uncertain and will often be far from the truth. CLINICALPRACTICEGUIDELINE C l i n i c a l P r a c t i c e G u i d e l i n e ii5
- 6. Judgements around four key factors determined the strength of a recommendation: the balance between desirable and un- desirable consequences of alternative therapeutic or diagnostic strategies, the quality of the evidence and the variability in va- lues and preferences. We did not conduct formal decision or cost analysis. 6.8.2. Ungraded statements. We decided to use an additional category of ungraded statements for areas where formal evidence was not sought and statements were based on common sense, or expert experience alone. The ungraded statements were generally written as simple declarative statements but were not intended to be stronger than level 1 or 2 recommendations. 6.8.3. Optimizing implementation. Recommendations often fail to reach implementation in clinical practice partly be- cause of their wording [10, 11]. Care was therefore taken to produce the evidence in clear, unambiguous wordings. Preferentially, data were presented either as flowcharts with de- cision points or as tables. We also provided additional advice for clinical practice. This advice is not graded, elaborates on one or more statements and is intended only to facilitate practical implementation. 6.9. Writing the rationale We collated recommendations and ungraded statements for each clinical question in separate chapters structured according to a specific format. Each question resulted in one or more specific boxed statements. All statements were accompanied by their GRADE classification as levels 1 or 2 (strength of re- commendations) and A, B, C or D (quality of the supporting evidence) (Table 4). These statements are followed by advice for clinical practice where relevant and the rationale of the statement. The rationale contains a brief section on ‘Why this question?’ with relevant background and justification of the topic, followed by a short narrative review of the evidence in ‘What did we find?’ and fi- nally a justification of how the evidence was translated into the recommendations made in ‘How did we translate the evidence into the statement?’ When areas of uncertainty were identified, the guideline de- velopment group considered making suggestions for future re- search based on the importance to patients or the population, and on ethical and technical feasibility. 6.10. Internal and external review 6.10.1. Internal review. A first draft of the guideline was sent to internal reviewers from the ERA-EDTA council and the ERBP advisory board. Internal reviewers were asked to com- ment on the statements and the rationale within free textfields. All these comments and suggestions were discussed during an ERBP advisory board meeting, during a meeting of the ERBP methods support team, and during an additional teleconfer- ence meeting of the guideline development group. For each comment or suggestion, the guideline development group Table 4. Implications of strong and weak recommendations for stakeholders. Adapted from Guyatt et al. [224] Grade Implications Patients Clinicians Policy 1: Strong, ‘We recommend’ Most people in your situation would want the recommended course of action, only a small proportion would not. Most patients should receive the recommended course of action. The recommendation can be adopted a as policy in most situations. 2: Weak, ‘We suggest’ Most people in your situation would want the recommended course of action, but many would not. You should recognize that different choices will be appropriate for different patients. You must help each patient to arrive at a management decision consistent with her or his values and preferences. Policy-making will require substantial debate and involvement of many stakeholders. The additional category ‘ungraded’ was used, typically, to provide guidance based on common sense rather than on a systematic literature search. Where applicable, these statements were provided as ‘advice for clinical practice’. Typical examples include recommendations regarding monitoring intervals, counselling and referral to other clinical specialists. The ungraded recommendations are generally written as simple declarative statements, but are not meant to be interpreted as being stronger recommendations than level 1 or 2 recommendations. F I G U R E 1 : Grade system for grading recommendations. Adapted from Guyatt et al. [9]. CLINICALPRACTICEGUIDELINE ii6 Clinical Practice Guideline
- 7. evaluated whether the statement needed to be adapted, again taking into account the balance between desirable and undesir- able consequences of the alternative management strategies, the quality of the evidence, and the variability in values and preferences. 6.10.2. External review. The guideline was sent to the Endo- crine Society of Australia (ESA), the European Society of Endo- crinology, Kidney Health Australia–Caring for Australasians with Renal Impairment (KHA-CARI) and the American Soci- ety of Nephrology (ASN), with the request to have the guideline evaluated by two of their members. In addition, all members of the ERA-EDTA received an on- line questionnaire in Survey Monkey format to evaluate the guideline using the AGREE-II framework. In addition, a free text field was provided to allow for additional comments (see Appendix 6). All comments and suggestions were discussed with the guideline development group by e-mail, as well as during a final meeting of the co-chairs of the guideline development group, the methods support team and the chair of ERBP. 6.11. Timeline and procedure for updating the guideline The guideline will be updated every 5 years or earlier follow- ing publication of new evidence that may require additional statements or changes to existing statements. At least every 5 years, the ERBP methods support team will update its literature searches. Relevant studies will be identified and their data extracted using the same procedure as for the ini- tial guideline. During a one-day meeting, the guideline develop- ment group will decide whether or not the original statements require updating. An updated version of the guideline will be published online describing the changes made. During the 5-year interval, the guideline development group co-chairs will notify the ERBP chair of new information that may justify changes to the existing guideline. If the chair decides an update is needed, an updated version of the guideline will be produced using the same procedures as for the initial guideline. 6.12. Funding ERBP sponsored the entire production of this guideline, according to the statutes of ERA-EDTA and the bylaws of ERBP [3]. Activities of ERBP and its methods support team are supervised by an advisory board [3] (see www.european- renal-best-practice.org for details and declaration of interests). ERBP is an independent part of ERA-EDTA. The council of ERA-EDTA approves and provides the annual budget based on a proposition made by the ERBP chair. ERA-EDTA receives money and is partly funded by industrial partners, but its coun- cil is not involved with and does not interfere with question de- velopment or any other part of the guideline development process. The guideline development group did not receive any funds directly from industry to produce this guideline. 7. CHAPTER 1: ISSUES RELATED TO RENAL REPLACEMENT MODALITY SELECTION IN PATIENTS WITH DIABETES AND END-STAGE RENAL DISEASE Chapter 1.1. Should patients with diabetes and CKD stage 5 start with peritoneal dialysis or haemodialysis as a first modality? Statements 1.1.1 We recommend giving priority to the patient’s gen- eral status and preference in selecting renal replace- ment therapy as there is an absence of evidence of superiorityof one modalityoveranother in patients with diabetes and CKD stage 5 (1C). 1.1.2 We recommend providing patients with unbiased information about the different available treat- ment options (1A). 1.1.3 In patients opting to start haemodialysis (HD), we suggest prefering high flux over low flux when this is available (2C). 1.1.4 We suggest diabetes has no influence on the choice between HD or haemodiafiltration (HDF) (2B). Advice for clinical practice Make sure that all the different renal replacement therapy modalities (peritoneal dialysis (PD), in-centre HD, satellite HD, home HD, nocturnal dialysis, different modalities of trans- plantation) can be made equally available for all patients is in- dispensable to allow free modality choice. Rationale • Why this question? It is unclear whether, in patients with diabetes and CKD stage 3b or higher (eGFR <45 mL/min), the modality of renal replacement therapy (different modalities of HD or PD, or transplantation etc.) that is selected as first-choice treatment may have an impact on major outcomes, metabol- ic profile, diabetes complications and technique survival of the replacement therapy. • What did we find? To answer this question, we refer to the systematic litera- ture review specifically performed for this guideline [12]. This systematic review included 25 from the initial 426 re- cords retrieved through database searching. All studies but one [13] were observational. None included only patients with diabetes; the percentage of patients with diabetes ran- ged from 9% to 61%. The total number of patients with dia- betes included was 828 573, of which 721 783 were on HD and 106 790 on PD. Not enough treatment details were available to allow reliable analysis of the benefit of subcat- egories of HD or PD (e.g. HD versus HDF or manual versus automated PD). The overall study quality assessed by the Newcastle-Ottawa Scale was moderate to high. Because of their observational design, none of the in- cluded studies was free from selection bias. There was CLINICALPRACTICEGUIDELINE C l i n i c a l P r a c t i c e G u i d e l i n e ii7
- 8. significant heterogeneity in the length of follow-up among studies (from 1 to 8 years) which may hamper the general- izability of results. None of the reviewed studies provided data on quality of life (QoL), patient satisfaction, major and minor morbid events, hospital admissions, deterioration of residual renal function, functional status, glycaemic control, access to trans- plantation or survival of the technique. Twenty-four cohort studies analysed the risk of death. Only one cohort study con- sidered the risk of infectious complications. In intention-to-treat analyses (i.e. patients are assigned to their initial treatment and not to the treatment eventually re- ceived), most studies found a survival benefit for PD over HD in the beginning of treatment, that disappeared with length of time on treatment (Supplemantary data extraction tables). The duration of this advantage varied from 6 months to 3 years after the start of dialysis, depending on the underlying co- morbidities (congestive heart failure, coronary heart disease), gender and age of the observed cohort, region and time-period. In ‘as treated’ analyses (i.e. patients are considered at risk as long they are treated in the modality), heterogeneity was even more expressed, with some studies reporting PD was asso- ciated with improved survival in all patients [14], or only in patients under 60 years of age during the first 2 years [15], pa- tients under 65 years [16] or during the first year [17]. In pa- tients aged over 44, Yeates et al. showed a higher risk of death in patients with diabetes on PD [18]. Stack et al. [19] reported the adjusted mortality to be higher for PD patients with con- gestive heart failure who remained on this therapy during the follow-up and for patients who switched compared with those who remained on HD. In the subgroup without congestive heart failure, the mortality was similar for patients who re- mained either on HD or PD but was higher for those who switched. This study is, however, biased by the exclusion of pa- tients who died in the first 90 days. Only one small cohort study reported on infectious com- plications, with higher infection rates (hospitalization or access-related infections) being observed in PD patients with diabetes (1.28 versus 0.84/year, P <0.004) but this difference lost its statistical significance after adjustment for albumin, age, race and gender (RR 1.13; 95% CI 0.76–1.67) [20]. A systematic review (26 studies) on the impact of dialysis modality (centre HD and PD) on QoL [21] was retrieved. The authors concluded that there was no significant difference in QoL between HD and PD patients. PD patients tend to rate their QoL higher than HD patients. Worsening of physical component of QoL was more marked in PD patients. Another systematic review (52 articles) on the impact of RRT modality (HD, PD and TX) on QoL as assessed by the SF-36 score [22] concluded that scores of HD compared with PD patients were not statistically different. Results are similar when restricting the analyses to articles that reported the per cent of patients with diabetes. A third systematic review (27 articles) based on utility measures to assess preference- based QoL (HD, PD and TX) [23] concluded that there was no statistically significant difference in utilities between HD and PD patients. Mean QoL tended to be higher among PD patients. A fourth systematic review (190 articles) based on utility -based QoL (HD, PD,TX, CKD, conservative treatment) [24] concluded that there was no statistically sig- nificant difference in utilities between HD and PD patients. Mean utility estimate tended to be higher among PD patients. We found one meta-analysis on the impact of haemodai- lysis versus HDF, showing no interaction for presence of dia- betes [25]. • How did we translate the evidence into the statement? Which considerations were taken into account (GRADE)? We recommend giving priority to the patient’s condition and preference in selecting renal replacement therapy as there is an absence of evidence of superiority of one modality over another in patients with diabetes and CKD stage 5 (1C). We recommend providing patients with unbiased infor- mation about the different available treatment options (1A). In view of the numerous methodological pitfalls in the various observational studies, no firm conclusion can be drawn. If anything, the observed differences in survival be- tween the different modalities seem to be small, suggesting that they all can be considered ‘equally adequate treatments’ in general terms, when applied in the current indications and with the current technology. In view of this, the guideline development group judges that patient preference should be the driving factor for renal replace- ment modality choice. Therefore, the guideline group judges that availability of all of the different renal replacement therapy options and good, well-balanced education on the different modalities, for example the Yorkshire Dialysis Decision Aid (YODDA) (see link on website www.european-renal-best- practice.org) are essential first steps. In patients opting to start HD, we suggest prefering high flux over low flux when this is available (2C). We suggest diabetes has no influence on the choice be- tween HD or HDF (2B). In patients opting for HD, it is suggested that high-flux dia- lysis is preferred when this is available and affordable, consistent with the ERBP recommendation on the use of high-flux versus low-fluxmembranes[26].Inarecentmeta-analysisofHDFver- sus HD, no interaction for diabetes and HDF versus HD was observed [25]. Consequently, the choice for HD versus HDF should not be influenced by the diabetes status of the patient. What do the other guidelines say? We did not find other guidelines providing guidance on this area. Suggestions for future research 1. Establish and validate patient decision aids on modality se- lection; test whether use of these decision aids results in im- proved outcomes, QoL and patient satisfaction. CLINICALPRACTICEGUIDELINE ii8 Clinical Practice Guideline
- 9. 2. Analyse outcomes on PD versus HD in different sub- groups, such as elderly patients with diabetes, while taking into account differences in practices in different centres and countries (e.g. impact of assisted care). 3. Development and validation of decision-making tools for the timely transfer to HD/PD after PD/HD start. 4. Develop and validate statistical models that can take into account modality transfers and thus allow the exploration of different patient trajectories rather than HD versus PD. Chapter 1.2. Should patients with diabetes and CKD stage 5 start dialysis earlier, i.e. before becoming symptomatic, than patients without diabetes? Statements 1.2.1 We recommend initiating dialysis in patients with diabetes on the same criteria as in patients with- out diabetes (1A). Advice for clinical practice 1. Distinguish complaints due to long-standing diabetes (polyneuropathy, gastroparesis versus nausea on uraemia etc.) from uraemic complaints might be cumbersome in clinical practice. 2. In patients opting for HD, take into account and discuss with the patient the following factors to determine the de- cision on and optimal timing of vascular access creation: (a) speed of deterioration of renal function (b) pojected probability that a functioning vascular access will be achieved (c) projected life expectancy. Rationale • Why this question? We aimed to clarify whether the starting of dialysis with- out clinical symptoms of uraemia at a predefined fixed point of clearance may produce favourable outcomes in patients with diabetes when compared with waiting to start renal re- placement until patients do have uraemic complaints (as is recommended for patients without diabetes [27, 28]). • What did we find? We found 12 papers reporting 11 studies on the association between some form of early versus late start of dialysis and survival/mortality on dialysis. One study was an RCT, three studies were prospective cohorts and the remaining studies were retrospective cohorts. The RCT was the IDEAL study by Cooper et al. [29], which was performed in 828 patients in Australia and New Zealand. Although initially patients ran- domized to late start were to start dialysisbetween 5 and 7 mL/ min/1.73 m2 creatinine clearance as estimated by Cockcroft and Gault (eGFRCG), and the early start group was supposed to start between 10 and 14 mL/min/1.73 m2 ; in reality, eGFRCG at start of dialysis was 9.8 and 12.0 mL/min/1.73 m2 in the late and early start group, respectively. So, the differ- ence in eGFRCG at start of dialysis was only 2.2 mL/min/1.73 m2 . This difference did not appear to result in a change in sur- vival between early and late start. However, patients in the late start group started on average 6 months later than patients in the early start group. The IDEAL study provided a subgroup analysis for the 34% of patients with diabetes, and in those pa- tients there was also no difference in survival between early and late start of dialysis in patients with diabetes. There were three prospective studies. Contreras-Velazquez et al. [30] performed a study in 98 patients with the aim to identify peritonealanatomical changes in incident PDpatients, their role in peritoneal permeability, technique failure, and mortality on PD. There was no data on the subgroup of 24% PD patients with diabetes. Tang et al. [31] performed a pro- spective cohort study in 233 Asian patients. The comparison was between patients who accepted PD and were immediately started and patients who declined PD and were followed up on the low clearance clinic. Again, therewere no separate datapro- vided on the subgroup of patients with diabetes. The remaining studies were all retrospective cohort studies. Chandna et al. [32] compared survival in patients whose start of dialysis was planned (n = 163) versus survival in patients in whom start of dialysis was unplanned (n = 129). A comparison in survival between patients with (n = 59) versus without dia- betes (n = 229) was presented, showing no difference between the two groups, but separate results for patients with diabetes were not presented. In only 25% of the patients with diabetes was dialysis unplanned versus 49% in patients without dia- betes, indicating that the comparison of planned versus un- planned dialysis is perhaps different in patients with versus without diabetes. Finally, probably planned versus unplanned start of dialysis cannot be considered the same as early versus late start of dialysis. Coronel et al. [33] compared survival in 100 patients with diabetes that started PD either below or equal and higher to 7.7 mL/min/1.73 m2 , finding that starting early (i.e. ≥7.7 mL/min/1.73 m2 ) was significantly associated with better sur- vival at 3 years (61% versus 39%). However, this is an observa- tional retrospective study, and patients who started at an eGFR below 7.7 mL/min/1.73 m2 were not comparable with patients who start at higher levels. Kazmi et al. [34] studied the effect of comorbidity on the association between eGFR at start of dia- lysis and survival on dialysis in more than 300 000 people in the USA. They found that the higher levels of eGFR at the start of dialysis were associated with significantly worse survival on dialysis, even after adjustment for comorbidity. However, there was no formal subgroup analysis in patients with diabetes alone. Lassalle et al. [35] analysed more than 11 000 patients in the French REIN registry, looking at the association between eGFR at start of dialysis and survival on dialysis with extensive adjusting for confounders. Results showed that, even after ad- justment, higher eGFR levels at the start of dialysis were asso- ciated with poor survival on dialysis. Traynoret al. [36] studied the effect of lead-time bias in 235 European patients by calcu- lating when these patients reached eGFR = 20 mL/min/1.73 m2 and using this point as the start of follow-up. They CLINICALPRACTICEGUIDELINE C l i n i c a l P r a c t i c e G u i d e l i n e ii9
- 10. demonstrated that lead-time bias can partly explain the effect between eGFR at the start of dialysis and survival on dialysis. Higher levels of eGFR at the start of dialysis were associated with poor survival on dialysis, but there was no formal sub- group analysis in patients with diabetes. Wright et al. [37] also studied the effect of early and late start of dialysis on sur- vival on dialysis in almost 900 000 patients in the USA. They also showed that higher levels of eGFR at the start of dialysis are associated with poor survival on dialysis. In the subgroup ana- lysis in patients with diabetes, they showed a similar result. Beddhu et al. [38] also investigated timing of start of dialysis, modelled as renal function at the start of dialysis in a continu- ous fashion, in incident haemodialysis and PD patients. They found that every increase in eGFR (MDRD) at baseline with 5 mL/min led to a 14% increased risk of dying on dialysis [HR = 1.15 (1.06–1.14)]. Hwang et al. [39] demonstrated that there was a dose–response relationship between the level of eGFR at the start of dialysis and risk of mortality on dialysis, even after adjustment for potential confounders [Q1 as reference: Q2: HRAdj = 1.18 (95% CI 1.01–1.37)], Q3: HRAdj = 1.21 (95% CI 1.04–1.41), Q4: HRAdj = 1.66 (95% CI 1.43–1.93), and Q5: HRAdj = 2.44 (95% CI 2.11–2.81). Clark et al. [40] found that 8441 patients in the CORR cohort who started dialysis early [eGFR (MDRD) >10.5 mL/min] had 18% more risk of dying on dialysis [HR = 1.18 (95% CI 1.13–1.23)] compared with late start of dialysis [eGFR (MDRD) ≤10.5 mL/min] in 17 469 incident HD patients. Jain et al. [41] did not detect a survival difference between patients starting dialysis early (n = 2994) [eGFR (MDRD) >10.5 mL/min] [HR = 1.08 (95% CI 0.96–1.23)] mid-start of dialysis (n = 2670) [eGFR (MDRD) 7.5–10.5] [HR = 0.96 (95% CI 0.86–1.09)] versus late [eGFR (MDRD) <7.5 mL/min]. For all these studies, it is likely that the remaining con- founding induced by the use of estimated rather than mea- sured GFR explains the worse outcome of start at higher eGFR. Indeed, eGFR is based on creatinine, which itself is negatively impacted by malnutrition and poor food intake, and is diluted by fluid overload. Both of these conditions will result in an overestimation of true GFR by eGFR, and also result in worse outcomes. • How did we translate the evidence into the statement? Which considerations were taken into account (GRADE)? Based on one RCT, there appears to be no evidence to support the hypothesis that in patients with diabetes, start of dialysis based on pre-defined levels of eGFR before they become symptomatic versus when they become symptom- atic is of any benefit in terms of mortality or QoL. As such, the same recommendations as made previously by ERBP [27] for the general CKD 5 population can be maintained for CKD 5 patients with diabetes. In patients with diabetes, it might be cumbersome to dis- tinguish whether polyneuropathy, nausea, concentration disturbances or sleepiness are to be attributed as ‘uraemic’ or as ‘diabetes-related’ symptoms. To the knowledge of the guideline development group, there are no strict and clear criteria that can be forwarded to assist in making this distinction. Therefore, it can be that, in reality, patients with diabetes start at somewhat higher eGFR levels com- pared with patients without diabetes. Although this was al- ready mentioned in the original guidance published by ERBP [27] after publication of the IDEAL trial (Guideline 1.3: High-risk patients e.g. with diabetes and those whose renal function is deteriorating more rapidly than eGFR 4 mL/min/year require particularly close supervision. Where close supervision is not feasible and in patients whose uraem- ic symptoms may be difficult to detect, a planned start to dia- lysis while still asymptomatic may be preferred), the reassessment in the current guidance production process makes it clear that there is no reason to start patients with diabetes at higher levels of eGFR just because they have dia- betes, rather only (as for those without diabetes) because they are symptomatic. The new statement abolishes eventual ambiguity arising from the original statements, and should be seen as an addition to them. The guideline development group also wants to stress that in the IDEAL trial, all patients had been followed by a neph- rology centre for a substantial period of time, and most had a functioning access in place at start of renal replacement ther- apy. Therefore, discussion of the different renal replacement modalities and selection of a preferred dialysis modality in a shared decision-making process should be started timely. As creation of vascular access might be problematic, and as maturation failure might be prevalent in patients with dia- betes, the guideline group judges that it is advisable to discuss in a timely manner, in patients opting for HD, the creation of avascular access. In this discussion, the speed of deterioration of renal function should be taken into account, as not all pa- tients might be progressive. In addition, the general condition of the patient, and the likelihood of death before ESRD rather than evolution to ESRD should be evaluated. What do the other guidelines say? We did not find other guidelines providing guidance on this topic. Suggestions for future research 1. Develop and validate clinical/biochemical scores to distin- guish uraemic and diabetes related complaints. Chapter 1.3. In patients with diabetes and CKD stage 5, should a native fistula, graft or tunnelled catheter be preferred as initial access? Statements 1.3.1 We recommend that reasonable effort be made to avoid tunnelled catheters as primary access in pa- tients with diabetes starting HD as renal replace- ment therapy (1C). 1.3.2 We recommend that the advantages, disadvan- tages and risks of each type of access be discussed with the patient. CLINICALPRACTICEGUIDELINE ii10 Clinical Practice Guideline
- 11. Advice for clinical practice • When deciding whether or not to create a native vascular access, the following points should be considered: ○ expected life expectancy of the patient ○ expected QoL of the patient ○ probability of success of native access creation, as predicted based on ultrasound and Doppler results (Figure 2). Rationale • Why this question? From observational trials, it is clear that HD patients with a native vascular access have a better outcome when com- pared with those starting with a catheter. However, ‘not hav- ing a native fistula’ can be a marker of severity of disease, especially in patients who also have diabetes. In addition, in patients with diabetes, creation of a vascular access, and especially at the more distal parts of the arm, can be cumber- some in view of the presence of vascular disease. This might result in repetitive attempts to create native vascular access without clinical success. It is important to clarify the most advisable strategy of vascular access planning (type of vascular access, central venous catheter (CVC) or arteriovenous fistula (AVF) or graft (AVG) and position) in this patient group, and define whether, and to what extent, it should be different from pa- tients without diabetes. • What did we find? The full results of this systematic review are published in a separate document [42]. In this systematic review, we iden- tified 262 records, of which 213 were excluded based on title and abstract. As a result, 49 full-text articles were accessed and evaluated, resulting in the further exclusion of 36 arti- cles. Finally, 13 studies were included in the data extraction table: 2 prospective cohort studies, but which dated from an older era [43, 44], 10 retrospective cohort studies [45–53] and 1 case–control study [54]. We did not retrieve any ran- domized clinical trial. We also included one systematic review on the topic of vascular access in the general dialysis population [55], start- ing from the hypothesis that if any difference at all exists in the population without diabetes, it was most likely that suc- cess of vascular access will be worse in patients with dia- betes. This systematic review identified 3965 citations, of which 67 (62 cohort studies comprising 586 337 partici- pants) were data extracted. In a random-effects meta-analysis, compared with persons with fistulas, those individuals using catheters had higher risks for all-cause mortality (risk ratio = 1.53, 95% CI 1.41–1.67), fatal infec- tions (2.12, 1.79–2.52) and cardiovascular events (1.38, 1.24–1.54). Similarly, compared with persons with grafts, those individuals using catheters had higher odds of mortal- ity (1.38, 1.25–1.52), fatal infections (1.49, 1.15–1.93), and cardiovascular events (1.26, 1.11–1.43). Compared with per- sons with fistulas, those individuals with grafts had in- creased all-cause mortality (1.18, 1.09–1.27) and fatal infection (1.36, 1.17–1.58), but no higher risk for cardiovas- cular events (1.07, 0.95–1.21). The authors note that the risk for selection bias was high in all studies. Patient survival In a retrospective cohort study of incident, >65-year-old HD patients (total n = 764 200 patients with diabetes), Chan et al. [45] reported a similar mortality rate and vascular access pa- tency among patients with AVF versus AVG. Dhingra et al. F I G U R E 2 : Decision flow chart for vascular access in patients with diabetes. CLINICALPRACTICEGUIDELINE C l i n i c a l P r a c t i c e G u i d e l i n e ii11
- 12. [47] reported in a retrospective cohort study of incident and prevalent HD patients (total n = 5189 patients, 31% with dia- betes) that all-cause and CV mortality were higher in CVC ver- sus AVF, and all-cause and infection mortality were higher in AVG versus AVF. In a prospective single-centre cohort study in- cluding incident and prevalent HD patients (total n = 21863 with diabetes), Saxena et al. [44] reported a lower rate of vascu- lar access-related sepsis among patients with AVF compared with those with AVG or dialysis catheter; patients with femoral catheters presented a higher sepsis-related mortality in com- parison with those with AVF and AVG. Survival of the access In a retrospective single-centre cohort study including ESRD patients who underwent proximal AVF creation (total n = 29 368 with diabetes), Murphy et al. [51] reported appar- ently similar results for age and better results in males versus females, but no statistical significance was reported. Field et al. [48] reported a better survival of proximal versus distal AVF in patients with diabetes in a retrospective single-centre cohort study including 289 incident HD patients (103 with diabetes, 36%), but also here no statistical significance was reported. In a prospective single-centre cohort study including 197 incident HD patients (43 with diabetes, 22%) who underwent AVF cre- ation by nephrologists [43], similar cumulative patency rates between distal versus proximal AVF were observed. Konner et al. [50] reported in their retrospective single-centre cohort study [total n = 247 patients, 78 with diabetes (22.5%)] a higher mortality and lower primary patency rate in patients with dia- betes; no separate data were provided amongst patients with diabetes for distal versus proximal AVF. Also, a lower primary patency rate in non-perforating proximal AVF versus perforat- ing proximal AVF and distal AVF was reported; the cumulative patency rates among the three study groups was similar, but thrombosis rate was lower among those with a proximal per- forating AVF. This study has a high risk of selection bias, and all procedures were performed by one expert. Hammes et al. [49] reported in a retrospective single-centre cohort study (total n = 127, 52 with diabetes) that patients with versus with- out diabetes had a lower prevalence of cephalic arch stenosis, but the interpretation of these data is cumbersome, as there is a high risk of indication bias. Diehm et al. [53] found lower pa- tency rates in a retrospective single-centre cohort study (total n = 244, 62 with diabetes) in patients with diabetes, and this using a mixture of different AV fistula types. Yeager et al. [54] report the risk factors associated with finger gangrene after placement of an AV fistula in a case-control single-centre study [total n = 222 patients, 121 with diabetes (54%)]: dia- betes, peripheral and coronary artery disease (CAD) and age under 55 years at the start of dialysis. While awaiting a formal systematic literature review and guidance from the update of the EBPG guideline on vascular access from 2007, we used recent updates of the CARI guide- line [56] to support technical details of vascular access creation. • How did we translate the evidence into the statement? We recommend reasonable effort be made to avoid tun- nelled catheters as primary access in patients with diabetes starting HD as renal replacement therapy (1C). There has been a general awareness in the nephrology com- munity of the too high rates of prevalent dialysis patients on ca- theters. Over the last years, there has been a general consensus that efforts should be made to reduce these high rates as, ac- cording to various large observational studies [55], there is a clear link between catheter use and higher mortality and infec- tion rates. Based on this consensus, several initiatives, e.g. ‘the fistula first’ initiative, have been launched, and some countries even linked reimbursement to vascular access type. Whereas these initiatives were successful in increasing the percentage of prevalent patients dialysing with a native fistula, it became clear that this growth was lower than expected and came at the expense of enormous efforts and costs for the society and suffering for the patient [57–59]. The major underlying explanation appears to be that there is selection bias in the observational trials because of the association between (cardio- vascular) status and the propensity to having a functioning fistula. We recommend that the advantages, disadvantages and risks of each type of access be discussed with the patient. Although the evidence is scanty, creation of vascular access is more cumbersome and results more often in non- maturation in patients with versus without diabetes, and this particularly in women and the elderly. Factors predicting non- maturation in the general dialysis population, such as a diam- eter of the feeding artery <2 mm and/or of the draining vein <2.5 mm, or absence of flow increase with fist exercise, should certainly raise concern as to the probability that a functioning access can be created in such a patient [56]. In addition, life expectancy in some patients is low, and protracted and persist- ing efforts to create a vascular access might cause a substantial decrease in QoL, without adding any substantial benefit (Figure 2). What do the other guidelines say? No guideline provides specific recommendations for pa- tients with diabetes. KDOQI, CARI, CSN and UK-RA all rec- ommend using a native fistula as preferred access, when feasible. Three of them recommend trying to place a graft rather than a tunnelled catheter in case a native fistula is deemed im- possible. In their respective discussions, they all highlight that the creation of a native vascular access might be more problem- atic in patients with versus without diabetes. CLINICALPRACTICEGUIDELINE ii12 Clinical Practice Guideline
- 13. Suggestions for future research 1. Detailed observational studies to associate practices con- cerning vascular access creation with outcomes, and this using advanced statistical techniques to adjust for co- morbidities such as age, gender, diabetes status, cardiovas- cular disease and for surgical technique. 2. Based on the above, RCTs should be designed to explore potential hypotheses. Chapter 1.4 Is there a benefit to undergoing renal transplantation for patients with diabetes and CKD stage 5? 1.4.1 We recommend providing education on the dif- ferent options of transplantation and their expected outcomes for patients with diabetes and CKD stage 4 or 5 who are deemed suitable for transplantation (Table 5) (1D). Statements only for patients with type 1 diabetes and CKD stage 5 1.4.2 We suggest living donation kidney transplantation or simultaneous pancreas kidney transplantation to improve survival of suitable patients (2C). 1.4.3 We suggest against islet transplantation after kid- ney transplantation with the aim to improve sur- vival (2C). 1.4.4 We suggest pancreas grafting to improve survival after kidney transplantation (2C). Statements only for patients with type 2 diabetes and CKD stage 5 1.4.5 We recommend against pancreas or simultaneous kidney pancreas transplantation (1D). 1.4.6 We recommend diabetes in itself should not be considered a contraindication to kidney trans- plantation in patients who otherwise comply with inclusion and exclusion criteria for trans- plantation (1C). Advice for clinical practice • Successful simultaneous pancreas–kidney transplantation improves QoL, neuropathy, glycaemic control and diabetic retinopathy in type 1 diabetes. • Perioperative comorbidity of simultaneous pancreas kidney transplantation can be substantial. • We refer to the ERBP guideline [60] on kidney transplant donor and recipient evaluation and peri-operative manage- ment for assessing whether or not a patient is deemed suit- able for transplantation. Rationale • Why this question? The guideline development group wants to provide a rec- ommendation on whether transplantation is a viable option in patients with diabetes and whether some subgroups or some types of transplantation (cadaveric kidney, living donor kidney, simultaneous pancreas kidney, pancreas after kidney) might be preferred. The answer to this ques- tion is however hampered by the fact that only observational data are available, and that accordingly, selection bias might potentially blur the interpretation of what we find in the lit- erature. As such, having an idea as to what extent only the most optimal patients with diabetes are accepted for trans- plantation is important for correct interpretation of the observational data. This information, together with infor- mation on the outcome of transplantation, can help us to formulate advice on whether we should promote more transplantation in patients with diabetes, or rather refrain from doing so. Patients with diabetes and CKD stage 3b or higher (eGFR <45 mL/min) mostly have complex comorbidity. In the post-transplantation period, immunosuppressive medi- cation can deteriorate glycaemic control and worsen already existing vascular comorbidity. On the other hand, survival and QoL when remaining on dialysis might also be far from optimal. Therefore, we need to ascertain whether pa- tients with diabetes could benefit from kidney transplant- ation, in terms of major outcomes. It is also important to elucidate whether a specific type of transplantation has bet- ter outcomes over another. • What did we find? We retrieved 12 studies for evaluating the potential selec- tion bias for patients for transplantation (see Supplementary data extraction tables). Most studies were consistent with the hypothesis that compared with CKD patients without dia- betes, those with diabetes are less likely to be waitlisted. Most guidelines recommend more extensive screening in patients with diabetes [60–62]. No randomized controlled studies for any form of trans- plantation in patients with diabetes and CKD stage 5 were identified. We found 21 papers reporting observational data. Eight additional studies were identified by hand searching the ref- erence lists of previously identified papers. The majority of the studies suffered from methodological limitations and were at high risk of different forms of bias. The studies re- porting on hard endpoints such as mortality or graft out- come were mostly large registry-based patient populations. Some reported data from a single centre [63–69] with a high potential of centre bias, limiting generalizability. Also, not all studies distinguished type 1 from type 2 diabetes in their evaluation of outcome of transplantation versus re- maining on dialysis [70] or in the outcome of a pancreas graft [63]. Most importantly, most studies suffered from a high risk of selection bias as patients remaining on the wait- ing list might have different characteristics from those actu- ally transplanted (such as non-compliance, smoking, increased cardiovascular comorbidity or high immuniza- tion) which can affect their outcome and which mostly is not accounted for in the survival analysis. Some studies stratified their analysis according to diabetes status [71–73], whereby the adjusted mortality risk is higher CLINICALPRACTICEGUIDELINE C l i n i c a l P r a c t i c e G u i d e l i n e ii13
- 14. Table 5. Observational studies on outcome after different modalities of transplantation in patients with type 1 diabetes Time period Mean age Subjects 1-year patient survival 5-year patient survival 7-year patient survival 10-year patient survival 1-year kidney graft survival 5-year kidney graft survival 7-year kidney graft survival 10-year kidney graft survival Rayhill et al. [66] 2000 1986– 1996 39 805 99% haplo-identical LRDK, 96% SPK and 94% DKD 85% haplo-idential LRDK, 88% SPK and 72% DKD 94% haplo-idential LRD 87% SPK, 86% DKD 72% haplo-identical LRD 78% SPK 64% DKD Bunnapradist et al. [225] 2003 1994– 1997 41 6016 87% SPK and 76% DKD 73% SPK and 64% DKD Lindahl et al. [68] 2013 1983– 2010 47 630 94% for SPK versus 95% for LDK versus 89% for DKD 85% for SPK versus 79% for LDK versus 63% for DKD 67% for SPK versus 56% for LDK versus 36% for DKD 90% for SPK versus 92% for LDK versus 85% for DKD 75% for SPK versus 72% for LDK versus 60% for DKD 57% for SPK versus 45% for LDK versus 30% for DKD Mohan et al. [69] 2003 1992– 2002 47 101 96% for SPK versus 93% KTA 89% for SPK versus 57% KTA 93% for SPK versus 94% KTA 76% for SPK versus 58% KTAa La Rocca et al. [64] 2001 1984– 1998 46 ESRD type 1 DM (n = 351) 77.4% SPK versus 56.0% KTA versus 39.6% WL 85.2% SPK versus 70.0% KTA. Young et al. [78] 2009 2000– 2007 42 type 1 DM who received a kidney transplant (n = 11 362) 87% LDK and SPK versus 75% DDK 78% LDK versus 76% SPK versus 66% DDK Waki et al. [90] 2012 1995– 2002 44 type 1 DM who received a kidney transplant (n = 1088) 96.4% SPK versus 95.2% KTA 89.6% SPK versus 78.2% KTA 78.2% SPK versus 65.5% KTA Weiss et al. [81] 2009 1997– 2005 40 type 1 DM on SPK waiting list (n = 9630) 95.9% SPK versus 97.2% LDK versus 95.6% DDK 88.6% SPK versus 80.0% LDK versus 73.9% SPK with pancreas loss y1 versus 64.8% DDK 92.0% SPK versus 94.8% LDK versus 90.3% DDK 72% SPK (functioning pancreas y1) versus 63.6% LDK versus 59.8% SPK with pancreas loss y1 versus 49.7% DDK Ojo et al. [79] 2001 1988– 1998 34 ESRD type 1 DM on SPK waiting list (n = 13467) 67% SPK versus 65% LDK versus 46% DKD Poommipanit et al. [75] 2010 2000– 2007 28 type 1 DM on SPK waiting list (n = 11966) 99.2% PALK versus 95.6% SPK 91% PALK versus 87% SPK 86% PALK versus 77% SPK Kleinclauss et al. [63] 2009 1995– 2003 45 diabetes (type 1 or 2) LDK recipients (n = 250) 98% PAK versus 100% KTA-eligible PAK 89% PAK versus 88% KTA-eligible PAK 71% PAK versus 76% KTA-eligible PAK 82% PAK versus 84% KTA-eligible PAK 67% PAK versus 62% KTA-eligible PAK DKD, deceased kidney donor, KTA, kidney transplant alone; L(R)DK, living (related) kidney donor; SPK, simultaneous kidney pancreas transplant; WL, waitlisted patients; PA(L)K, pancreas after kidney (from living donor). a It is unclear whether this is perhaps a mistake in the original data, as 5-year graft KTA was reported to be 58%, whereas 5-year patient surival was reported to be 57%. ii14ClinicalPracticeGuideline
- 15. in patients with versus without diabetes [73, 74]. Patient sur- vival is better in CKD stage 5 patients with diabetes who actu- ally had a transplant versus those remaining on the waiting list [70, 73]. The studies dealing with the different options for type 1 dia- betes are summarized in Table 5. The table intends to help phy- sicians to discuss the different options and their pros/cons with the patient to support shared decision-making. Patients receiv- ing a pancreas after kidney transplantation had better graft sur- vival compared with those who were eligible but did not receive a pancreas graft or only after 5 years or more). Other analyses have demonstrated superior outcomes of pancreas transplant- ation after living donor kidney versus simultaneous pancreas and kidney [75]. The survival benefit of simultaneous pancreas–kidney compared with kidney transplantation alone in patients with type 1 diabetes appeared inconsistent and also depended on the modality of kidney transplantation (ca- daveric versus living donor kidney), the time point of assess- ment and the adjustment for confounders. Changes in patient selection criteria, donor criteria and surgical and immunosup- pressive treatment can also explain changes in outcome accord- ing to time period [68]. Early survival benefit in simultaneous pancreas kidney versus kidney transplant alone often is not observed with even increases in early post-transplantation mor- tality [76]. Long-term outcome is in most, but not all, studies better with simultaneous pancreas-kidney than with kidney trans- plantation alone [65, 67–69, 76]. In an older UNOS analysis, sim- ultaneous pancreas–kidney recipients had a higher mortality than living donor kidney recipients through the first 18 months post- transplantation, but they had a lower relative hazard thereafter [77]. In the univariate survival analysis, no difference in outcome for patient and graft [78] was observed between patients receiving a simultaneous pancreas–kidney versus a living donation kidney alone. In contrast, long-term patient and graft survival in the multivariate model was inferior in the simultaneous pancreas kid- ney versus the living donation kidney group. Longer term survival is reported to be superior with simultaneous pancreas– kidney versus solitary renal transplantation in other studies [79, 80]. Pancreas graft failure in the first year seems to attenuate or even abolish the beneficial long-term effects of SPK versus kidney transplantation alone [81] as it decreases both graft and patient survival [82], and also having preserved kidney graft function at year 1 seems to be an important modulating factor [77]. Analyses of QoL or intermediate endpoints such as neur- opathy [83], retinopathy [84] or cardiovascular surrogate mar- kers [85–87] without exception included small patient numbers and/or lacked adjustment for confounders. They compare different patient populations (for instance, simultaneous pancreas–kidney transplantation with failed versus functioning pancreas graft) [88, 89] with—in the QoL studies—numerous, and not always consistent, uses of valid assessments of physical state, cognitive functioning and mental health. Comparing QoL of patients receiving simultaneous pancreas–kidney transplant- ation with that of patients losing or refusing their pancreatic graft [89] might overestimate the differences in perceived QoL between the groups. • How did we translate this into the statement? We recommend education on the different options of transplantation and their expected outcomes for patients with diabetes and CKD stage 4 or 5 and who are deemed suit- able for transplantation (see Table 5) (1D). Only observational data are available to support guidance in this area. Statements only for patients with type 1 diabetes: We suggest living donation kidney transplantation or sim- ultaneous pancreas–kidney transplantation to improve sur- vival of suitable patients with type 1 diabetes and CKD Stage 5 (2C). We suggest against islet transplantation after kidney transplantation with the aim to improve survival (2C). We suggest pancreas grafting to improve survival after kidney transplantation (2C). The same risk of selection bias might be present in the stud- ies on simultaneous pancreas–kidney transplantation for pa- tients with type 1 diabetes. Simultaneous pancreas–kidney transplantation is mostly performed at high-volume centres, which most likely hampers generalizability of outcomes. The healthiest patients are also likely to be allocated to simultaneous pancreas–kidney transplantation, receive the highest quality or- gans [90] and more often receive a pre-emptive transplant [67]. Figure 3 provides a potential decision flow chart for trans- plantation modality selection in patients with type 1 diabetes. If a living donor is available, the guideline development group judges that (pre-emptive) living donation should be pre- ferred, as it increases the donor pool, and the results are not in- ferior to simultaneous pancreas–kidney transplantation. If no living donor is available, a simultaneous pancreas–kidney transplant should be preferred, provided the patient is consid- ered fit enough to survive the increased peri-operative risk. Statements only for patients with type 2 diabetes: We recommend against pancreas or simultaneous kidney- pancreas transplantation (1D). We recommend diabetes per se should not be considered a contraindication to kidney transplantation in patients who otherwise comply with inclusion and exclusion criteria for transplantation (1C). There is a high risk for selection bias in the observational data, as the access to the waiting list is hampered for patients with diabetes. This is consistent with the observation that most guidelines recommend more intense screening, especially CLINICALPRACTICEGUIDELINE C l i n i c a l P r a c t i c e G u i d e l i n e ii15
- 16. for cardiovascular disease [60], in patients with diabetes. As a result, it should be taken into account that, for patients with dia- betes, the outcomes observed after transplantation are only valid for those without substantial comorbidity, i.e who passed our current pre-transplant screening procedures [60]. For this group of patients with type 2 diabetes, the presence of diabetes does not appear to be an additional risk factor per se; as a con- sequence, the guideline development group judges that diabetes in itself should not be a contraindication for transplantation, provided that the patient complies with current pre-transplant screening recommendations. What do the other guidelines say? We did not find any guidelines providing guidance on this topic. Suggestions for future research 1. Prospective multicentre observational studies comparing hard endpoints between living donor kidney transplant- ation and simultaneous pancreas–kidney transplantation in patients with type 1 diabetes, appropriately adjusted for comorbidity. 2. Prospective, adequately powered multicentre studies to as- sess the effect of transplantation compared with remaining on the waiting list in patients with type 1 or 2 diabetes on prespecified (surrogate) endpoints, such as cardiovascular events, vascular stiffness, intima-media thickness and retinopathy. 8. CHAPTER 2. ISSUES RELATED TO GLYCAEMIC CONTROL IN PATIENTS WITH DIABETES AND CKD STAGE 3B OR HIGHER (eGFR <45 mL/min) Chapter 2.1 A. Should we aim to lower HbA1C by tighter glycaemic control in patients with diabetes and CKD stage 3b or higher (eGFR <45 mL/min)? B. Is an aggressive treatmentstrategy (in numberof injections and controls and follow-up) superior to a more relaxed treatment strategy in patients with diabetes and CKD stage 3b or higher (eGFR <45 mL/min) and using insulin? Statements 2.1.1 We recommend against tighter glycaemic control if this results in severe hypoglycaemic episodes (1B). 2.1.2 We recommend vigilant attempts to tighten gly- caemic control with the intention to lower HbA1C when values are >8.5% (69 mmol/mol) (1C). 2.1.3 We suggest vigilant attempts to tighten glycaemic control with the intention to lower HbA1C ac- cording to the flow chart in Figure 4 in all other conditions (2D). 2.1.4 We recommend intense self-monitoring only to avoid hypoglycaemia in patients at high risk for hypoglycaemia (2D). Advice for clinical practice • Severity of hypoglycaemic episodes are defined as ‘mild’ when it can be treated by the patient himself and as ‘severe’ when assistance is required. • The most important concern is to avoid episodes of hypoglycaemia. • Empower patients at moderate and high risk for hypogly- caemia to perform regular follow-up of blood glucose level by using validated point of care devices. • Patients and conditions at low, moderate and high risk for hypoglycaemic episodes are depicted in Figure 5. Rationale • Why this question? It is unclear whether in this specific patient cohort, aim- ing at a lower HbA1C value by tightening glycaemic control results in improved outcomes, in terms of mortality and morbidity. There is some concern that excess mortality F I G U R E 3 : Transplantation decision flow chart for patients with type 1 diabetes. CLINICALPRACTICEGUIDELINE ii16 Clinical Practice Guideline
- 17. and morbidity can be induced by increasing the risk for (se- vere) hypoglycaemia. It is unclear whether maintaining or promoting intensive glucose control by regular auto-control, more regular follow-up visits and educational or patient empowerment programmes helps to decrease diabetes-specific complica- tions in this specific patient population. These programmes are labour intensive and expensive and thus have an import- ant impact on health care resources. • What did we find? We found one recent systematic review in dialysis pa- tients [91] on the association between HbA1C and outcome that included 10 studies (83 684 participants) (9 observa- tional studies and 1 secondary analysis of a randomized trial). After adjustment for confounders, patients with base- line HbA1c levels >69 mmol/mol (8.5%) versus 48–57 mmol/mol (6.5–7.4%) had increased mortality (HR 1.14; 95% CI 1.09–1.19). Likewise, patients with a mean HbA1c value >69 mmol/L (8.5%) had a higher adjusted risk of mor- tality (HR 1.29; 95% CI 1.23–1.35). In incident patients, mean HbA1c levels <36 mmol/mol (5.4%) were also asso- ciated with increased mortality risk (HR 1.29; 95% CI 1.23–1.35). A recent randomized trial demonstrated that adding sax- agliptin to the existing treatment, resulted in a decrease of HbA1C and a higher percentage of patients reaching an HbA1C <7%, but not in an improvement in cardiovascular outcomes [92]. We did not retrieve any other data collected specifically in patients with diabetes and with CKD stage 3b or higher (eGFR <45 mL/min). Effort was made to extract data specif- ically on patients with diabetes and CKD stage 3b or higher (eGFR <45 mL/min) in general diabetes studies, but this was hampered by the fact that in most studies, presence of CKD 3B or higher (eGFR <45 mL/min) is an exclusion criterion, or data were not reported separately for patients with CKD F I G U R E 4 : Flowchart of management targets for HbA1C in patients with diabetes and CKD stage 3b or higher (eGFR <45 mL/min). F I G U R E 5 : Assessment of risk for hypoglycaemia. CLINICALPRACTICEGUIDELINE C l i n i c a l P r a c t i c e G u i d e l i n e ii17
- 18. stage 3b or higher (eGFR <45 mL/min). A high-quality systematic review demonstrated lack of benefit of tighter glycaemic control as assessed by an HbA1C <7 (53 mmol/mol) or 7.5% (59 mmol/mol) [93], whereas there was a clear risk for enhanced hypoglycaemia episodes when glycaemic control is tightened [93]. We found one high-quality systematic review assessing the effectiveness of self-monitoring blood glucose levels in people with non-insulin-treated type 2 diabetes compared with clinical management without self-monitoring [97]. Al- though there was an improvement in HbA1C levels in the self-monitoring group (−2.7 mmol/mol), there was no con- vincing clinically meaningful effect. • How did we translate the evidence into the statement? Which considerations were taken into account (GRADE)? As data in our target population (patients with diabetes and CKD stage 3b or higher) are scant, the guideline group considered a two-tiered approach: (i) evaluate the available evidence in the general population with diabetes; (ii) evalu- ate which considerations made our target population special in this regard, and would have an impact on translation of the data from the general diabetes population. We recommend against tighter glycaemic control if this re- sults in or increases the risk for severe hypoglycaemic episodes (1B). We recommend vigilant attempts to tighten glycaemic control with the intention to lower HbA1C when values are >8.5% (69 mmol/mol) (1C). We suggest vigilant attempts to tighten glycaemic control with the intention to lower HbA1C according to the flow chart in Figure 4 in all other conditions (2D). In the general population, tight glycaemic control does not result in improvement of all-cause and cardiovascular mortal- ity, but results in an increased risk for hypoglycaemia. As in CKD stage 3b or higher (eGFR <45 mL/min), the risk of hypo- glycaemia is enhanced and the survival benefit is probably lower due to the general lower life expectancy, tight HbA1C control is probably even less relevant in this patient cohort. On the other hand, observational data show that lower HbA1C is associated with better outcome, so at least one should (cautiously) try to lower HbA1C, if this can be obtained without increasing the risk for hypoglycaemia. Therefore, the guideline development group judged that a balanced approach, taking into account the specific condition of the individual patient, should be recommended (see Figure 4). We recommend intense self-monitoring only to avoid hypoglycaemia in patients at high risk for hypoglycaemia (2D). Under these conditions, an intense self-monitoring with the sole aim to attain lower glycaemic values is difficult to defend, as it is linked with uncertain benefit. In addition, using intense self-monitoring did not result in an improvement of HbA1C values, and accordingly, self-monitoring can thus not be recom- mended if the only aim is to reduce HbA1C. However, in patients at risk for hypoglycaemia (Figure 5), i.e. mostly those taking active medication with a high risk of hypoglycaemia, e.g. insulin, regular monitoring should be performed to avoid over- shooting and hypoglycaemia. • What do other guidelines say? No guideline specifically targets patients with diabetes and CKD stage 3b or higher (eGFR <45 mL/min). In their 2012 position statement [94], the American Dia- betes Association (ADA) and the European Association for the Study of Diabetes (EASD) also promote taking into ac- count individual patient characteristics to determine the most optimal level of glycaemic control. In their 2012 update of their clinical practice guideline on diabetes and CKD, KDOQI [95] recommends a target HbA1c of around 7.0% to prevent or delay progression of the micro-vascular complications of diabetes, including diabetic kidney disease; they further recommend not aim- ing for an HbA1c target of <7.0% in patients at risk of hypoglycaemia, and suggest that the target of HbA1c can be extended above 7.0% in individuals with comorbidities or limited life expectancy and risk of hypoglycaemia. In their rationale, they explain that the risk for hypogly- caemia outweighs the potential benefits of reduced micro- vascular complications in patients with advanced stages of CKD. Suggestions for further research 1. Evaluate whether it is glycaemic variability and specifically hypoglycaemia that contributes to cardiovascular risk, ra- ther than average blood glucose level. 2. A study of intensive versus standard control (HbA1c <53 mmol/mol versus <69 mmol/mol), specifically in patients with diabetes and CKD stage 3b–5 using drugs with very low risk to induce hypoglycaemia, is warranted. Chapter 2.2. Are there better alternatives than HbA1c to estimate glycaemic control in patients with diabetes and CKD stage 3b or higher (eGFR <45 mL/min/ 1.73 m2 )? Statements 2.2.1 We recommend the use of HbA1C as a routine ref- erence to assess longer term glycaemic control in patients with CKD stage 3b or higher (eGFR <45 mL/min/1.73 m2 ) (1C). CLINICALPRACTICEGUIDELINE ii18 Clinical Practice Guideline
- 19. Advice for clinical practice • Continuous glucose measurement devices can be consid- ered in high-risk patients in whom a very tight control of glycaemia is deemed of benefit. • The association between HbA1C and longer term glycaemic control might be different in patients with versus without CKD stage 3b or higher (eGFR <45 mL/min), and this both for the absolute value as well as for the slope of the as- sociation curve. • The following factors are potentially associated with a lower than expected HbA1C: ▪ decreased red blood cell survival ▪ increased red blood cell formation (use of iron, RhuEpo). • The following factors are potentially associated with a higher than expected HbA1C: ▪ accumulation of uraemic toxins. Rationale • Why this question? Although in many countries measurement of HbA1c is the cornerstone for diagnosis and management of diabetes mellitus in routine clinical practice, the role of this biomark- er in reflecting long-term glycaemic control in patients with CKD stage 3b or higher (eGFR <45 mL/min) has been ques- tioned. As a different association between glycaemic control and morbidity/mortality might be observed in patients with and without CKD stage 3b or higher (eGFR <45 mL/min), we wanted to summarize the current knowledge and evidence of the use of HbA1C and of alternative glycaemic markers [glycated albumin, fructosamine, 1,5- anhydroglucitol (1,5-AG) and continuous glucose monitor- ing] in this specific patient population. • What did we find? The guideline development group conducted a narrative review [96] to explore different methods to assess longer term glycaemic control, and their accuracy in patients with CKD stage 3b or higher (eGFR <45 mL/min). The findings are summarized in Table 6. • How did we translate this into the statements? Due to the availability of relatively inexpensive and rou- tinely measured HbA1c assays and the inconsistent or lim- ited data to prove the superiority of other glycaemic markers (glycated albumin, fructosamine, 1,5-AG and continuous glucose monitoring) at this time, the guideline development group judges that HbA1c should remain the reference standard for glycaemic monitoring in patients with diabetes and CKD stage 3b or higher (eGFR <45 mL/min). In the future, continuous subcutaneous glucose moni- toring seems to be a promising method to correctly evalu- ate glycaemic control in patients with diabetes undergoing HD and in whom more intense glycaemic control is judged to be of relevance. • What do the other guidelines say? None of the other guidelines provides guidance in this area for this specific patient group of patients with diabetes and CKD stage 3b or higher. Suggestions for future research 1. Prospective studies testing pre-specified diabetes control targets based on glycated albumin and continuous glucose measurements in order to determine whether morbidity and mortality would be reduced with intensive glycaemic control using these measurements as reference target, and this specifically in patients with diabetes and CKD stage 3b or higher (eGFR <45 mL/min). 2. Evaluate the role, if any, of continuous glucose monitoring systems for determining therapeutic adjustments for pa- tients with diabetes treated with renal replacement therapy. Chapter 2.3 A. Is any oral drug superior to another in terms of mortality/ complications/glycaemic control in patients with diabetes type 2 and CKD stage 3b or higher (eGFR <45 mL/min/ 1.73 m2 )? B. In patients with diabetes type 2 and CKD stage 3b or high- er (eGFR <45 mL/min/1.73 m2 ), is maximal oral therapy better than starting/adding insulin at an earlier stage? Statements 2.3.1 We recommend metformin in a dose adapted to renal function as a first line agent when lifestyle measures alone are insufficient to get HbA1C in the desired range according to Figure 4 (1B). 2.3.2 We recommend adding on a drug with a low risk for hypoglycaemia (fig 5, 6 and 7) as additional agent when improvement of glycaemic control is deemed appropriate according to Figure 4 (1B). 2.3.3 We recommend instructing patients to temporar- ily withdraw metformin in conditions of pending dehydration, when undergoing contrast media investigations, or in situations with an increased risk for AKI (1C). Advice for clinical practice • Consider instructing patients by using credit-card type flyers on when to temporarily withdraw metformin. • Conditions considered as low, moderate or high risk for hypoglycaemia are depicted in Figure 5. • Hypoglycaemia risk for different drugs is presented in Figures 5 and 7. • In patients with diabetes type 2 and CKD stage 3b or higher (eGFR <45 mL/min/1.73 m2 ) who are on metformin, the CLINICALPRACTICEGUIDELINE C l i n i c a l P r a c t i c e G u i d e l i n e ii19
- 20. Table 6. Comparison of the different glycaemic markers in patients with diabetes and CKD stage 3b or higher Marker Advantages Disadvantages HbA1c • Marker of longer-term glycaemic concentrations • Excellent standardization of HbA1c assays • Universally available primary reference measurement system • Scientific evidence on association with outcomes from several trials • In comparison with blood glucose, less sensitivity to preanalytical variables, lower within subject biological variability, little/no diurnal variations, little/no influence from acute stress and little/no influence from common drugs which are known to influence glucose metabolism • Excellent separation of the HbA1c fraction from other haemoglobin adducts and with no interference from carbamylated haemoglobin due to technological advances in HbA1c measurement • Falsely increased values with iron deficiency, vitamin B12 deficiency, decreased erythropoiesis, alcoholism, chronic renal failure, decreased erythrocyte pH, increased erythrocyte lifespan, splenectomy, hyperbilirubinaemia, carbamylated haemoglobin, alcoholism, intake of large doses of aspirin, chronic opiate use • Falsely decreased values have been reported after administration of erythropoietin, iron or vitamin B12; with reticulocytosis, chronic liver disease, ingestion of aspirin, vitamin C, vitamin E, certain haemoglobinopathies, increased erythrocyte pH, a decreased erythrocyte lifespan, haemoglobinopathies, splenomegaly, rheumatoid arthritis, drugs such as antiretrovirals, ribavirin and dapsone, hypertriglyceridaemia • Variable changes have been seen in patients with HbF, haemoglobinopathies, methaemoglobin, genetic determinants Glycated albumin • Measure of shorter-term glycaemic control (2–3 weeks) • Not influenced by gender, erythrocyte lifespan, erythropoietin therapy or serum albumin concentration • Significant association with markers of vascular injury • Values can be influenced by lipaemia, hyperbilirubinaemia, haemolysis, increased uric acid, uraemia, intake of high doses of aspirin, low serum protein concentrations/nutritional status, age, albuminuria, cirrhosis, thyroid dysfunction and smoking • Concentration is inversely influenced by body mass index, body fat mass and visceral adipose tissue • Different reference ranges depending on the applied method • Limited data, especially on the impact of using it as a target • Expensive, time consuming, not widely available Fructosamine • Correlates with average glucose levels in the previous 10–14 days • Simple, automated analysis • Contradictory results concerning the correlation between fructosamine and mean glucose concentrations in patients with CKD stage 3b or higher • Values can be influenced by nephrotic syndrome, thyroid dysfunction, glucocorticoid administration, liver cirrhosis, icterus • Concentration in uraemic patients may be influenced by a number of variables other than glycaemia, including hypoalbuminaemia, hyperuricaemia • Within-subject variation is higher than that for HbA1c 1,5-anhydroglucitol • Reflects day-to-day changes in glucose levels. • Retained metabolic inertness, steady-state levels in all tissues and negligible influence of sampling conditions such as collection time, body weight, age, sex and food intake of the subjects • Poorer performance in identifying cases of undiagnosed diabetes in comparison with other glycaemic markers • Influenced by traditional Chinese herbal drugs • Limitations for use in subjects with renal tubular acidosis, or advanced renal disease • Not widely available, limited data on its clinical everyday value Continuous glucose measurement • Theoretically the most ideal marker for glycaemic control • Allows examination of short-term glycaemic changes around the time of dialysis • Exhaustion of the sensor, limited data ii20ClinicalPracticeGuideline
- 21. F I G U R E 6 : Dose recommendations in CKD. F I G U R E 7 : Impact of different classes of glycaemia-lowering drugs on different outcomes. (For full data extraction: see Supplementary tables) and Arnouts et al. [110]. Dark green denotes evidence for beneficial effect; red indicates evidence for negative effect; yellow represents not in- vestigated or insufficient data; salmon denotes evidence for weak negative effect; aquamarin represents evidence for neutral to weak positive effect; dark blue indicates evidence for lack of effect/neutral. CLINICALPRACTICEGUIDELINE C l i n i c a l P r a c t i c e G u i d e l i n e ii21