1) The document analyzes oil-water layer recognition and distribution of PI reservoirs in the G region based on core data, oil testing, and well logging.
2) An oil-water layer logging interpretation chart is established using resistivity logs to identify 5 types of vertical oil-water distributions in single wells and the overall horizontal zoning of distributions across the region.
3) The distributions are complex due to structural, sedimentary, and diagenetic factors but generally include pure oil, oil-water, and pure water layers that vary based on position within anticlines, synclines, and slopes.
The International Journal of Engineering & Science is aimed at providing a platform for researchers, engineers, scientists, or educators to publish their original research results, to exchange new ideas, to disseminate information in innovative designs, engineering experiences and technological skills. It is also the Journal's objective to promote engineering and technology education. All papers submitted to the Journal will be blind peer-reviewed. Only original articles will be published.
The papers for publication in The International Journal of Engineering& Science are selected through rigorous peer reviews to ensure originality, timeliness, relevance, and readability.
Middle stage production period in messla fieldShakier Khalifa
Compositional gradient is important factor to determined, many signs could lead you. The paper experience some factors in Messla and hence give recommendation.
Well log analysis for reservoir characterization aapg wikiBRIKAT Abdelghani
Well log is one of the most fundamental methods for reservoir characterization, in oil and gas industry, it is an essential method for geoscientist to acquire more knowledge about the condition below the surface by using physical properties of rocks.
New Study on Reservoir Characteristics of the Macroscopic Heterogeneity-Examp...iosrjce
The heterogeneity of the reservoir refers to the basic properties of the reservoir (lithology, physical
property, electric property and oiliness) in three dimensional space on the distribution of heterogeneity. Based
on statistics of core and well log data, paramenters of variation coefficient and differential are calculated to
carry out the study on heterogeneity of layer, interlayer and areal heterogeneity of Lower Member of
Minghuazhen Formation in BZ25-1S area. The sand sets of BZ25-1S reservoir are mainly of distributary
channel sand bodiesin delta plain, and the layer heterogeneity is medium. There are many barriers developed,
and layer heterogeneity is relatively strong. In the plane,the reservoir heterogeneity in the distributary channel
is strong, and it is weak in the overbank sand. It is considered that Lower Member of Minghuazhen Formation
in BZ25-1S area is of strong heterogeneity.
Reserve Estimation of Initial Oil and Gas by using Volumetric Method in Mann ...ijtsrd
This research paper is focused to estimate the current production rate of the wells and to predict field remaining reserves. The remaining reserve depends on the production points that selected to represent the real well behavior, the way of dealing with the production data, and the human errors that might happen during the life of the field. Reserves estimating methods are usually categorized into three families analogy, volumetric, and performance techniques. Reserve Estimators should utilize the particular methods, and the number of methods, which in their professional judgment are most appropriate given i the geographic location, formation characteristics and nature of the property or group of properties with respect to which reserves are being estimated ii the amount and quality of available data and iii the significance of such property or group of properties in relation to the oil and gas properties with respect to which reserves are being estimated. In this research paper, the calculation of collecting data and sample by volumetric method are suggested to estimate the oil and gas production rate with time by using the geological configuration and the historical production data from CD 3700 3800 sand in Mann Oil Field. San Win "Reserve Estimation of Initial Oil and Gas by using Volumetric Method in Mann Oil Field" Published in International Journal of Trend in Scientific Research and Development (ijtsrd), ISSN: 2456-6470, Volume-3 | Issue-5 , August 2019, URL: https://www.ijtsrd.com/papers/ijtsrd27945.pdfPaper URL: https://www.ijtsrd.com/engineering/petroleum-engineering/27945/reserve-estimation-of-initial-oil-and-gas-by-using-volumetric-method-in-mann-oil-field/san-win
First Development Plan for a Small Offshore Fieldijtsrd
This work describes the proposed development program for the accumulations in the virtual Beta field located in Libya offshore. In 2018, the contractor informed the Management Committee about the Commercial discovery of Beta field. This development plan has been prepared for submission to the Management for its consideration. After collecting all the available data including geological data, reservoir data, drilling data, production data, economical data, and environmental data. The suitable assumption has been made. All the modules were built with suitable sensitivities. The important results were laid out with some recommendations in each section. Due consideration is paid to the environmental impact and all the possible use is made of the existing infrastructure. Alfitouri Ibrahim Jellah "First Development Plan for a Small Offshore Field" Published in International Journal of Trend in Scientific Research and Development (ijtsrd), ISSN: 2456-6470, Volume-5 | Issue-1 , December 2020, URL: https://www.ijtsrd.com/papers/ijtsrd35908.pdf Paper URL : https://www.ijtsrd.com/engineering/petroleum-engineering/35908/first-development-plan-for-a-small-offshore-field/alfitouri-ibrahim-jellah
Macro heterogeneity of high porosity and permeability reservoirin Bozhong 25-...iosrjce
IOSR Journal of Applied Geology and Geophysics (IOSR-JAGG) is a double blind peer reviewed International Journal that provides rapid publication (within a month) of articles in all areas of Applied Geology and Geophysics. The journal welcomes publications of high quality papers on theoretical developments and practical applications in Applied Geology and Geophysics. Original research papers, state-of-the-art reviews, and high quality technical notes are invited for publications.
The SA0 Group Reservoir ’S Compositive Evaluation In The Central Developing P...QUESTJOURNAL
ABSTRACT: Using the data from logging in a net of high density, the sand core from a airtight well, and the testing data for oil and gas , and then according to the experiment of exploitation, we studied the deposit visage in macroscopical way, the physical characteristics of the reservoir, and the partition of the oil and gas’s border. It is clear that the zero group of Sa’s oil floor is mainly deposit in the foreside of a delta under the background of lake incursion, and the ventro-delta express a character that there were some sandstones which was transited for two times. Make a certain that the oil and gas’s border of zero group in Sa is maybe 600m underground, and demarcated the maximal square is 26.8km2 about this reservoir, and tell us that it lies in the top of the anticline. Of course, this production can be used in the designing of the zero group of Sa’s exploitation
Encryption in Microsoft 365 - ExpertsLive Netherlands 2024Albert Hoitingh
In this session I delve into the encryption technology used in Microsoft 365 and Microsoft Purview. Including the concepts of Customer Key and Double Key Encryption.
Essentials of Automations: Optimizing FME Workflows with ParametersSafe Software
Are you looking to streamline your workflows and boost your projects’ efficiency? Do you find yourself searching for ways to add flexibility and control over your FME workflows? If so, you’re in the right place.
Join us for an insightful dive into the world of FME parameters, a critical element in optimizing workflow efficiency. This webinar marks the beginning of our three-part “Essentials of Automation” series. This first webinar is designed to equip you with the knowledge and skills to utilize parameters effectively: enhancing the flexibility, maintainability, and user control of your FME projects.
Here’s what you’ll gain:
- Essentials of FME Parameters: Understand the pivotal role of parameters, including Reader/Writer, Transformer, User, and FME Flow categories. Discover how they are the key to unlocking automation and optimization within your workflows.
- Practical Applications in FME Form: Delve into key user parameter types including choice, connections, and file URLs. Allow users to control how a workflow runs, making your workflows more reusable. Learn to import values and deliver the best user experience for your workflows while enhancing accuracy.
- Optimization Strategies in FME Flow: Explore the creation and strategic deployment of parameters in FME Flow, including the use of deployment and geometry parameters, to maximize workflow efficiency.
- Pro Tips for Success: Gain insights on parameterizing connections and leveraging new features like Conditional Visibility for clarity and simplicity.
We’ll wrap up with a glimpse into future webinars, followed by a Q&A session to address your specific questions surrounding this topic.
Don’t miss this opportunity to elevate your FME expertise and drive your projects to new heights of efficiency.
Dev Dives: Train smarter, not harder – active learning and UiPath LLMs for do...UiPathCommunity
💥 Speed, accuracy, and scaling – discover the superpowers of GenAI in action with UiPath Document Understanding and Communications Mining™:
See how to accelerate model training and optimize model performance with active learning
Learn about the latest enhancements to out-of-the-box document processing – with little to no training required
Get an exclusive demo of the new family of UiPath LLMs – GenAI models specialized for processing different types of documents and messages
This is a hands-on session specifically designed for automation developers and AI enthusiasts seeking to enhance their knowledge in leveraging the latest intelligent document processing capabilities offered by UiPath.
Speakers:
👨🏫 Andras Palfi, Senior Product Manager, UiPath
👩🏫 Lenka Dulovicova, Product Program Manager, UiPath
Accelerate your Kubernetes clusters with Varnish CachingThijs Feryn
A presentation about the usage and availability of Varnish on Kubernetes. This talk explores the capabilities of Varnish caching and shows how to use the Varnish Helm chart to deploy it to Kubernetes.
This presentation was delivered at K8SUG Singapore. See https://feryn.eu/presentations/accelerate-your-kubernetes-clusters-with-varnish-caching-k8sug-singapore-28-2024 for more details.
Epistemic Interaction - tuning interfaces to provide information for AI supportAlan Dix
Paper presented at SYNERGY workshop at AVI 2024, Genoa, Italy. 3rd June 2024
https://alandix.com/academic/papers/synergy2024-epistemic/
As machine learning integrates deeper into human-computer interactions, the concept of epistemic interaction emerges, aiming to refine these interactions to enhance system adaptability. This approach encourages minor, intentional adjustments in user behaviour to enrich the data available for system learning. This paper introduces epistemic interaction within the context of human-system communication, illustrating how deliberate interaction design can improve system understanding and adaptation. Through concrete examples, we demonstrate the potential of epistemic interaction to significantly advance human-computer interaction by leveraging intuitive human communication strategies to inform system design and functionality, offering a novel pathway for enriching user-system engagements.
LF Energy Webinar: Electrical Grid Modelling and Simulation Through PowSyBl -...DanBrown980551
Do you want to learn how to model and simulate an electrical network from scratch in under an hour?
Then welcome to this PowSyBl workshop, hosted by Rte, the French Transmission System Operator (TSO)!
During the webinar, you will discover the PowSyBl ecosystem as well as handle and study an electrical network through an interactive Python notebook.
PowSyBl is an open source project hosted by LF Energy, which offers a comprehensive set of features for electrical grid modelling and simulation. Among other advanced features, PowSyBl provides:
- A fully editable and extendable library for grid component modelling;
- Visualization tools to display your network;
- Grid simulation tools, such as power flows, security analyses (with or without remedial actions) and sensitivity analyses;
The framework is mostly written in Java, with a Python binding so that Python developers can access PowSyBl functionalities as well.
What you will learn during the webinar:
- For beginners: discover PowSyBl's functionalities through a quick general presentation and the notebook, without needing any expert coding skills;
- For advanced developers: master the skills to efficiently apply PowSyBl functionalities to your real-world scenarios.
Key Trends Shaping the Future of Infrastructure.pdfCheryl Hung
Keynote at DIGIT West Expo, Glasgow on 29 May 2024.
Cheryl Hung, ochery.com
Sr Director, Infrastructure Ecosystem, Arm.
The key trends across hardware, cloud and open-source; exploring how these areas are likely to mature and develop over the short and long-term, and then considering how organisations can position themselves to adapt and thrive.
GDG Cloud Southlake #33: Boule & Rebala: Effective AppSec in SDLC using Deplo...James Anderson
Effective Application Security in Software Delivery lifecycle using Deployment Firewall and DBOM
The modern software delivery process (or the CI/CD process) includes many tools, distributed teams, open-source code, and cloud platforms. Constant focus on speed to release software to market, along with the traditional slow and manual security checks has caused gaps in continuous security as an important piece in the software supply chain. Today organizations feel more susceptible to external and internal cyber threats due to the vast attack surface in their applications supply chain and the lack of end-to-end governance and risk management.
The software team must secure its software delivery process to avoid vulnerability and security breaches. This needs to be achieved with existing tool chains and without extensive rework of the delivery processes. This talk will present strategies and techniques for providing visibility into the true risk of the existing vulnerabilities, preventing the introduction of security issues in the software, resolving vulnerabilities in production environments quickly, and capturing the deployment bill of materials (DBOM).
Speakers:
Bob Boule
Robert Boule is a technology enthusiast with PASSION for technology and making things work along with a knack for helping others understand how things work. He comes with around 20 years of solution engineering experience in application security, software continuous delivery, and SaaS platforms. He is known for his dynamic presentations in CI/CD and application security integrated in software delivery lifecycle.
Gopinath Rebala
Gopinath Rebala is the CTO of OpsMx, where he has overall responsibility for the machine learning and data processing architectures for Secure Software Delivery. Gopi also has a strong connection with our customers, leading design and architecture for strategic implementations. Gopi is a frequent speaker and well-known leader in continuous delivery and integrating security into software delivery.
GDG Cloud Southlake #33: Boule & Rebala: Effective AppSec in SDLC using Deplo...
C05740912
1. IOSR Journal of Engineering (IOSRJEN) www.iosrjen.org
ISSN (e): 2250-3021, ISSN (p): 2278-8719
Vol. 05, Issue 07 (July. 2015), ||V4|| PP 09-12
International organization of Scientific Research 9 | P a g e
Oil-Water Layer Recognition and Distribution of PI Reservoir in
G Region
Yang Xiaoyu1
; Li Huanxiang2
; Liu Xiaowen3
1
College of earth science of Northeast Petroleum University, Daqing, Heilongjiang, China.
2
College of earth science of Northeast Petroleum University, Daqing, Heilongjiang, China.
3
College of earth science of Northeast Petroleum University, Daqing, Heilongjiang, China.
Abstract:Based on the comprehensive analysis of core、oil testing and logging data, this paper searched the
cause of low-resistivity oil layer and high-resistivity water layer.Then oil-water layer logging interpretation
chart was established by using RLLD and corrected RILD to identify oil-water layers. The log interpretation
result shows there are 5 types of vertical oil-water distribution of single well in research area:pure oil layer type、
oil to water layer type、oil-water layer type、pure water layer type、messy type. The vertical and horizontal
oil-water distribution was finally concluded.
Key words:G region;PI reservoir; Oil-water layer recognition; Oil-water layer distribution
I. INTRODUCTION
Oil-water layers recognition and distribution are the important part of petroleum exploration and
development.People usually use conventional cross-plot methodbased on log curves 、reservoirs oil-water
recognition based on WT and LSSVM and other kinds of method to recognize oil and water layers.Then the
sand body distribution、tectonic evolution、seismic inversion、reservoir anatomy and other methods of
geological bodies were adopped to proceed the study on oil-water layer distribution from different angels and
levels.And years of exploration and development shows that the oil-water layer distribution in G region,under
the influence of structure、 sedimentary、 diagenetic and other factors,is very complex. In order to reveal the
oil-water layer distribution pattern within research area more precisely,on the basis of effective recognition
oflow-resistivity oil layer and high-resistivity water layer,this paper establish oil-water layers interpretive
standard by using core test and logging data. After the realization of quantitative interpretation of oil-water layer,
oil-water layer distribution within research area could be achieved to guide subsequent development of oil field.
G region, distributed as long ribbon from south to north, is constructionally located in the south of Q-G
depression of central down warping region in S basin. As a long-term inherited developed deep-water aphytal
depression, it is generally reflect the tectonic pattern of “three nose structure、two depression and one slope”,
including Xinzhao nose structure 、 Xinzhan nose structure 、 Aonan nose structure 、 Gulong syncline 、
Maoxing syncline and Yingtai slope. The mainly developed formations are Shahezi、Yingcheng、Denglouku、
Quantou、Qingshankou、Yaojia、Nenjiang、Sifangtai and Mingshui layers from Cretaceous ,Paleogene
and Neogene .After years of oil and gas exploration, a lot of important discoveries have been found. And the
advantage of shallow buried depth、better physical property and higher production has made PI reservoir of
Yaojia-one section one of the most important production zones.
II. OIL-WATER RECOGNITION
Under the sedimentary environment of delta front -lacustrine, PI reservoir in G region mainly deposited
mouth bar 、distal bar 、sheet sand and underwater distributary channel sand-four kinds of sedimentary
microfacies, which provided good storage space for forming reservoir. But the mutual effects of construction、
deposition、diagenetic process and other kinds of factors causing poor reservoir properties and complex oil-
water relationship within research area, thus uniform oil-water interface could not be found. As we can see from
electrical characteristics, the resistivity among oil、oil-water and water layers are quite similar.The appearance
of low-resistivity oil layer and high-resistivity water layer made it difficult for me to recognize oil-water
layers.Therefore,based on the analyzed causes of low-resistivity oil layer and high-resistivity water layer,using
abundant testing data,oil-water determination chart was established to increase the rate of logging interpretation
within research area.
2.1 low-resistivity oil layer and high-resistivity water layer
As we can see from formation water salinity data and conductive mineral content of oil layer of P I
reservoir in G region, it makes no differences between conventional reservoirs and low-resistivity oil layer、
2. Oil-Water Layer Recognition and Distribution of PI Reservoir in G Region
International organization of Scientific Research 10 | P a g e
high-resistivity water layer;the comparison of lithology data between low resistivity reservoir sample of 22
wells and conventional oil reservoir sample of 13 wells shows that low-resistivity oil layers have more
araliaceous siltstone samples while calcium siltstone and fine-grained sandstone samples are less than
conventional oil layer; X-diffraction analysis data shows that compared with conventional oil layers , low-
resistivity oil layers have more illite、emanon mixed layer 、chlorite and less kaolinite; besides, the percentage
of microspore volume in low-resistivity oil layer is significantly higher than conventional oil layers. In summary,
through the comparison of lithology、properties、pore structure、clay minerals、formation water salinity and
other factors between conventional reservoirs and low-resistivity oil layer、high-resistivity water layer,it turn
out that low-resistivity oil layer has the characteristic of fine lithology、high clay content、strong additional
electrical conductivity of clay 、developed microspore and high irreducible water saturation while high-
resistivity water layer were formed for the existence of residual oil and calcium.
2.2 Logging response of oil and water layers
Logging response characteristics of oil and water layers can provide preferred parameters when
establishing oil-water identification plate. The four - property relationship research of reservoirs within research
area shows that resistivity and three porosity logging curves can well reflect the properties and oil resistance of
reservoirs. Typical oil layer has a large porosity and high resistivity when typical water layer has low resistivity.
2.3 Interpretive criteria of oil and water layers
G region was located in the central of G source depression during the deposition of PI reservoir, where
has sufficient oil source. The relatively developed sandstone with poor horizontal connectivity was the favorable
zones to form lithological hydrocarbon reservoir. Therefore, lithological is the mainly controlling factor of
hydrocarbon accumulation when construction background controls differentiation of oil and water. The
complexity of the geological background of the reservoir determined the diversification of reservoir type. So it
is difficult for conventional GR-AC、LLD-GR、CNL-GR and LLD-AC cross plot to disguise oil layer, oil, oil-
water layer and an aqueous layer.
The comprehensive analysis of core、 oil testing and logging data reveals that induction logging is
more sensitive to low resistance component (water).But its vertical resolution is only 2m, while the layers which
thickness less than 2m take a certain proportion of reservoir, making it difficult for induction logging to reflect
actual reservoir value. So thickness and bed correction should be made with corresponding plate according to
the instrument type. Most introduction series of this area are CSU series, thus it is reasonable to correct
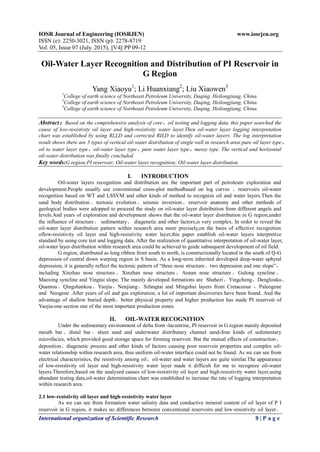
thickness and bed for induction logging by Schlumberger chart. Then oil-water layer logging interpretation chart
was established by using RLLD and corrected RILD(Fig 1):63 layers out of 69 data points fit the chart, reaching
the precision of 91.3% ; the two slashes divided the chart into three zones, the zone above line
1(RILD=0.9793RLLD-0.7704)is oil layer zone; the zone below line 2(RILD=0.6409RLLD-0.3296)is water
layer zone; the zone between 2 lines is oil-water layer zone, including、oil-water layer and oily water layer.
Finally, the logging data and test oil conclusions of 95 wells within this area shows the compliance rate of 85.4,
which well reflects the actual situation.
Fig 1Oil-water layer logging interpretation chart
3. Oil-Water Layer Recognition and Distribution of PI Reservoir in G Region
International organization of Scientific Research 11 | P a g e
III. OIL-WATER DISTRIBUTION
Based on the oil-water distribution characteristics of different kinds of hydrocarbon reservoir, this
paper concluded the vertical and horizontal oil-water distribution by using oil testing and logging data,
considering the sedimentary and structural characteristics of research area. The foundation of analyzing
hydrocarbon accumulation and oil-water distribution pattern was thus established, which also provide reliable
basis for the exploration and development of oil fields.
3.1 Vertical oil-water distribution
Vertical oil-water distribution of single well is the basic of oil-water distribution. The research was
carried out by using oil testing conclusion、electric log interpretation results of oil and water layer of each well.
There are 5 types of vertical oil-water distribution of single well in research area: pure oil layer type(the sand
bodies from top to bottom are mainly oil layer, barely have water layer or dry layer)、oil to water layer type(the
top of sand body is oil layer or oil-water layer when the bottle is water layer)、oil-water layer type(the sand
bodies are mainly oil-water layer, barely have water layer or oil layer)、pure water layer type(the sand bodies
from top to bottom are mainly water layer, barely have oil layer)、messy type(there is not clearly distribution
pattern of oil layer、water layer and dry layer, such as the top of sand body is water layer when the bottle is oil
layer or oil-water layer).
Generally speaking , PI reservoir in G region is extensively developed in each small layers:
Hydrocarbon bearing interval in uplifted area is quite long, usually from PI1 to PI6 small layers while oil layers
could only be seen in PI1 and PI4-PI6 small layers in syncline area; and the slope area has the longest
hydrocarbon bearing interval, which is from PI1 to PI8 small layers.
3.2 Horizontal oil-water distribution
The hydrocarbon is accumulated in the whole area under the control of four major geological factors-
construction、fracture、sand body and physical properties. Uniform oil-water distribution pattern could not be
found since oil-water distributions are quite different in each structural unit. The mainly well type in Gulling
syncline is oil-water well,and there are a few pure water wells in eastern part when Maoming syncline contains a
lot of pure oil wells. Xanthan nose structure mainly hold pure oil well of whole section and only a few water
wells appear in the edge area, showing good oiliness in structurally high area. Generally the oiliness of the south
wing is better than the north wing.Split by faults, there are not uniform oil-water interface among each block.
Xin Zhao nose structure shows large numbers of alternate layer phenomenon of oil and water layers; Oiliness
deteriorates from structural high to low area. Pure oil layer could only be seen in single small layer of each well
in Adnan nose structure. Besides, the large dip difference caused by the mutual effects on fault strike and
formation strike also has great influence on the oiliness of slope areas between Adnan nose structure and
Maoming syncline.
Overall, the oil-water distribution of PI reservoirs in G region has horizontal zoning characteristics:The
higher position of uplifted area develop placanticlinestructural reservoir of pure oil layer type and oil to water
layer type while lower position develop oil to water layer type 、pure water layer type and messy type;slope
area develop lithological reservoir of messy type、block reservoir and fault lithological reservoir of pure oil
layer type or oil to water layer type and structurally lithological reservoir of pure oil layer type;Syncline area
mainly develop lithological reservoir of pure oil type.
IV. CONCLUSIONS
The low-resistivity oil layer of PI oil group in G region is caused by fine lithology、high clay content、
strong additional electrical conductivity of clay、developed microspore and high irreducible water saturation
while high-resistivity water layer were formed for the existence of residual oil and calcium.
There are 5 types of vertical oil-water distribution of single well in research area: pure oil layer type、
oil to water layer type、oil-water layer type、pure water layer type、messy type. The oil-water distribution of
PI oil group in G region has horizontal zoning characteristics.
REFERENCES
[1]. Ming Yan, Yilin Li, Yumeng Wang. Oil-water distribution law and controlling factors of Putaohua
reservoir in the east of Pubei oilfield [J]. Journal of Northeast Petroleum University, 2014,38(6):54-60.
[2]. Xueqing Zhang, Jun Dong, Jianquan Dai. Oil and Water Distribution of Carboniferous Reservoir in Tahe
Oilfield [J]. Xinjiang Petroleum Geology,2002,22(4):306-308.
[3]. Heyi Li, Chengzhi Liu, Hui Li.Oil-water Distribution and Reservoirs Types of Fuyu Reservoir around
Sanzhao Area [J].Contemporary Chemical Industry,2014,43(10):2143-2146.
4. Oil-Water Layer Recognition and Distribution of PI Reservoir in G Region
International organization of Scientific Research 12 | P a g e
[4]. Wenli Yao, Quan Wang, Junlin Chen.Oil-water Distribution and Controlling Factors of Triassic in
Wellblock Xia 9[J].Journal of Yangtze University,2011,8(11):16-21.
[5]. Han Wang. A Study on Oil-water Distribution in the North of Jinglou Oilfield [J].Journal of Oil and Gas
Technology,2010,32(4):140-144.
[6]. Christian Charron. Taha B.M.J. Ouarda. Regional low-flow frequency analysis with a recession parameter
from a non-linear reservoir model[J]. Journal of Hydrology, 2015, 3:10-45.