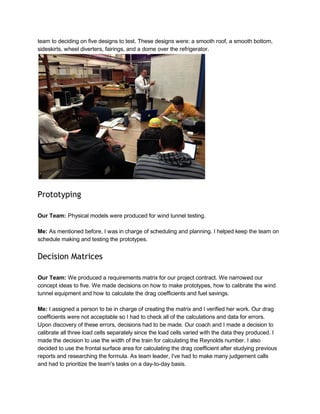
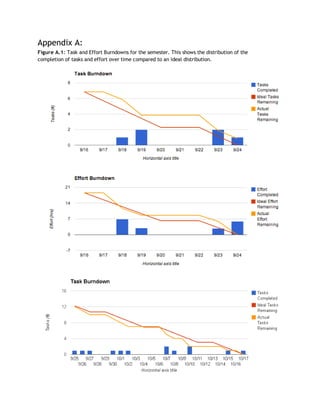
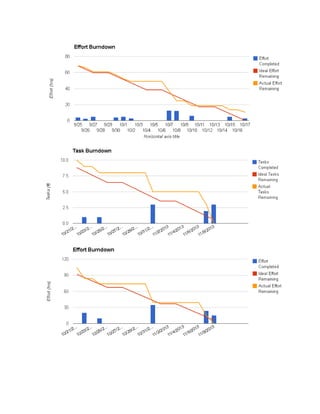
This document summarizes Jordan Rhoads' portfolio, including experience and specialties in mechanical engineering, CAD, programming, fluid dynamics, and machining. It describes a project to optimize refrigerated train cars for Union Pacific to improve fuel efficiency. As team leader, Jordan scheduled meetings, assigned tasks, tracked progress, programmed MATLAB codes, and made decisions throughout the project. Prototypes were tested, drag coefficients were calculated, and a report and presentation were produced.


![Figure A.2: MATLAB code for pressure transducer and load cell calibrations and the full analysis of
drag coefficient and reynolds number.
Pressure Calibration:
%Master script for calibrating Pressure
%Jordan Rhoads 2013‐12‐04
clc
clear all
%static directory input
dir_to_import = 'matlab';
[Voltage,Pressure,Vstd] = PCal_ProcessDir(dir_to_import);
%plot Pressure vs Voltages
jfiles = dir('*.csv');
jsize = size(jfiles,1);
p = polyfit(Voltage,Pressure,1); % p returns 2 coefficients fitting r = m_1 * x + b_2
r = p(1) .* Voltage + p(2);](https://image.slidesharecdn.com/31a58321-795a-4b1a-b706-aa4f988403da-150714053223-lva1-app6892/85/BYU-Capstone-Portfolio-6-320.jpg)
![m1 = p(1)
b1 = p(2)
R=corrcoef(Voltage,Pressure);
R2 = (R(1,2))^2
%plot both the points in y and the curve fit in r
plot(Voltage, Pressure, 'x')
hold on
plot(Voltage, r, '‐')
hold off
xlabel('Pressure')
ylabel('Voltages')
title('Pressure vs Voltages')
%Calculate Uncertainty
Vacc = .0025; %accuracy of pressure transducer
Uncertainty_4 = Vacc*Voltage + Vstd %Uncertainty of Pressure Transducer
%PCal_ProcessDir.m
%Inputs directory name and calls process file on each file that matches the
%pattern
function [Voltage,Pressure,Vstd] = PCal_ProcessDir(dirname)
%folder_name = uigetdir %lets you choose file for directory
jfiles = dir('*.csv');
jsize = size(jfiles,1);
Voltage = zeros(jsize,1);
Pressure = zeros(jsize,1);
Vstd = zeros(jsize,1);
for i=1:jsize
[Voltage(i),Pressure(i),Vstd(i)] = PCal_ProcessFile(jfiles(i).name);
end
end
%PCal_ProcessFile.m
%Inputs file name and calucates Cd and Re with uncertainties
function [Voltage,Pressure,Vstd] = PCal_ProcessFile(filename)
%read txt file
myfile = importdata(filename);
%Import Voltage data
V = myfile(:,1); %Voltage for test
Pressure = myfile(1,3)*249.174; %Pressure Converted to Pa
%Calculate mean and std of voltages
Voltage = mean(V(1:10000,1));
Vstd = std(V(1:10000,1));
end](https://image.slidesharecdn.com/31a58321-795a-4b1a-b706-aa4f988403da-150714053223-lva1-app6892/85/BYU-Capstone-Portfolio-7-320.jpg)
![Load Cell Calibration:
%Master script for calibrating Load Cell
%Jordan Rhoads 2013‐12‐04
clc
clear all
%static directory input
dir_to_import = 'matlab';
[Voltage1,Voltage2,Voltage3,Mass,Vstd1,Vstd2,Vstd3] = LCal_ProcessDir(dir_to_import);
%plot Pressure vs Voltages
jfiles = dir('*.csv');
jsize = size(jfiles,1);
%m and b for Voltage 1
p1 = polyfit(Voltage1,Mass,1); % p returns 2 coefficients fitting r = m_1 * x + b_2
r1 = p1(1) .* Voltage1 + p1(2);
m1 = p1(1)
b1 = p1(2)
R1=corrcoef(Mass,Voltage1);
R2_1 = (R1(1,2))^2
%m and b for Voltage 2
p2 = polyfit(Voltage2,Mass,1); % p2 returns 2 coefficients fitting r = m_1 * x + b_2
r2 = p2(1) .* Voltage2 + p2(2);
m2 = p2(1)
b2 = p2(2)
R2=corrcoef(Mass,Voltage2);
R2_2 = (R2(1,2))^2
%m and b for Voltage 3
p3 = polyfit(Voltage3,Mass,1); % p3 returns 2 coefficients fitting r = m_1 * x + b_2
r3 = p3(1) .* Voltage3 + p3(2);
m3 = p3(1)
b3 = p3(2)
R3=corrcoef(Mass,Voltage3);
R2_3 = (R3(1,2))^2
%Calculate Uncertainty
Vacc = 4.0801; %accuracy of Load Cell
Uncertainty_1 = Vacc + Vstd1
Uncertainty_2 = Vacc + Vstd2
Uncertainty_3 = Vacc + Vstd3
%LCal_ProcessDir.m
%Inputs directory name and calls process file on each file that matches the pattern
function [Voltage1,Voltage2,Voltage3,Mass,Vstd1,Vstd2,Vstd3] = LCal_ProcessDir(dirname)](https://image.slidesharecdn.com/31a58321-795a-4b1a-b706-aa4f988403da-150714053223-lva1-app6892/85/BYU-Capstone-Portfolio-8-320.jpg)
![jfiles = dir('*.csv');
jsize = size(jfiles,1);
Voltage1 = zeros(jsize,1);
Voltage2 = zeros(jsize,1);
Voltage3 = zeros(jsize,1);
Mass = zeros(jsize,1);
Vstd1 = zeros(jsize,1);
Vstd2 = zeros(jsize,1);
Vstd3 = zeros(jsize,1);
for i=1:jsize
[Voltage1(i),Voltage2(i),Voltage3(i),Mass(i),Vstd1(i),Vstd2(i),Vstd3(i)] =
LCal_ProcessFile(jfiles(i).name);
end
end
%LCal_ProcessFile.m
%Inputs file name and calucates Cd and Re with uncertainties
function [Voltage1,Voltage2,Voltage3,Mass,Vstd1,Vstd2,Vstd3] = LCal_ProcessFile(filename)
%read file
myfile = importdata(filename);
%Import Voltage data
V1 = myfile(:,1); %Voltage for test
V2 = myfile(:,2);
V3 = myfile(:,3);
Mass = myfile(1,4)*9.80665/1000; %Mass converted from g to kg
%Calculate absolute value of mean and Standard Deviation of voltages
Voltage1 = mean(V1(1:10000,1));
Voltage2 = mean(V2(1:10000,1));
Voltage3 = mean(V3(1:10000,1));
Vstd1 = std(V1(1:10000,1));
Vstd2 = std(V2(1:10000,1));
Vstd3 = std(V3(1:10000,1));
end
Full Analysis:
%Master script for running Aerodynasty code
%Jordan Rhoads 2013‐12‐04
clc
clear all
%static directory input
dir_to_import = 'matlab';
[Vdc1,Vdc2,Vdc3,Vdc4,T,speed] = ProcessDir(dir_to_import);
%conversions](https://image.slidesharecdn.com/31a58321-795a-4b1a-b706-aa4f988403da-150714053223-lva1-app6892/85/BYU-Capstone-Portfolio-9-320.jpg)
![ftm = 0.3048; %ft to meters
%from Pressure Calibration
m4 =62121; %characteristic slope for pressure
b4 =47.439; %characteristic bias for pressure
%from Load Cell Calibration
m1 = 4.4403e+03; %characteristic slope for 1st Load Cell
b1 = 38.7560; %characteristic bias for 1st Load Cell
m2 = 2.9372e+03; %characteristic slope for 2nd Load Cell
b2 = ‐33.0182; %characteristic bias for 2nd Load Cell
m3 = 4.4071e+03; %characteristic slope for 3rd Load Cell
b3 = 21.0659; %characteristic bias for 3rd Load Cell
%constants
rair = 286.9; %constant for air (J/kg*K)
mu = 1.836e‐5; %viscosity @ 750m above sea level (kg/m*s)
Vt = 3.2; %ave v of typical train (m/s)
Pb = (1814/144)*6894.75729; %Absolute Pressure of Wind Tunnel (Pa)
Pt = 92633.6; %Absolute Pressure of Train (Pa)
l = (4.08875/12)*ftm; %Width of Model Train (m)
A = .01444463; %surface area of front of train (m^2)
%calculate
Dm = m1.*Vdc1+b1+m2.*Vdc2+b2+m3.*Vdc3+b3; %Drag of model
dp = (m4.*Vdc4+b4); %pressure difference (Pa)
rho = rair.*T/Pb; %density of air (kg/m^3)
V = sqrt(2.*dp./rho); %calculated velocity (m/s)
Re = V*l.*rho/mu %Reynolds Number
Cd = Dm./(.5*rho.*(V.^2)*A) %Drag Coeff
%plot Cd vs Velocity
jfiles = dir('*.csv');
jsize = size(jfiles,1);
scatter(V,Cd)
xlabel('Velocity (m/s)')
ylabel('Cd')
title('Cd vs Velocity')
%ProcessDir.m
%Inputs directory name and calls process file on each file that matches the pattern
function [Vdc1,Vdc2,Vdc3,Vdc4,T,speed] = ProcessDir(dirname)
%dirname = uigetdir(dirname);
%dir(fullfile(dirname,'filename*.x*'))
%create empty matrices
jfiles = dir('*.csv');
jsize = size(jfiles,1);
Vdc1 = zeros(jsize,1);](https://image.slidesharecdn.com/31a58321-795a-4b1a-b706-aa4f988403da-150714053223-lva1-app6892/85/BYU-Capstone-Portfolio-10-320.jpg)
![Vdc2 = zeros(jsize,1);
Vdc3 = zeros(jsize,1);
Vdc4 = zeros(jsize,1);
T = zeros(jsize,1);
speed = zeros(jsize,1);
%for loop to fill empty matrices
for i=1:jsize
[Vdc1(i),Vdc2(i),Vdc3(i),Vdc4(i),T(i),speed(i)] = ProcessFile(jfiles(i).name);
end
end
%ProcessFile.m
%Inputs file name and calucates the mean voltages and temperature
function [Vdc1,Vdc2,Vdc3,Vdc4,T,speed] = ProcessFile(filename)
%read csv file
myfile = importdata(filename);
%Import Voltage data
V1 = myfile(:,2); %Voltage for Drag 1
V2 = myfile(:,3); %Voltage for Drag 2
V3 = myfile(:,4); %Voltage for Drag 3
V4 = myfile(:,5); %Voltage Pressure
temp = myfile(:,1); %Temperature
speed = myfile(1,7); %speed setting
%Calculate mean of voltages and Temperature
Vdc1 = mean(V1);
Vdc2 = mean(V2);
Vdc3 = mean(V3);
Vdc4 = mean(V4);
T = mean(temp);
end
Figure A.3: Team FMEA](https://image.slidesharecdn.com/31a58321-795a-4b1a-b706-aa4f988403da-150714053223-lva1-app6892/85/BYU-Capstone-Portfolio-11-320.jpg)