This document summarizes key points from Chapter 3 of a textbook on business intelligence, analytics, and data science. It discusses data warehousing concepts like architectures, data integration processes, dimensional modeling, and online analytical processing. It also covers business performance management, describing it as a real-time system that alerts managers to opportunities and problems and empowers them to react through models and collaboration. The chapter examines topics like data warehousing development approaches, administration, security, and emerging technologies in the field.


![Science
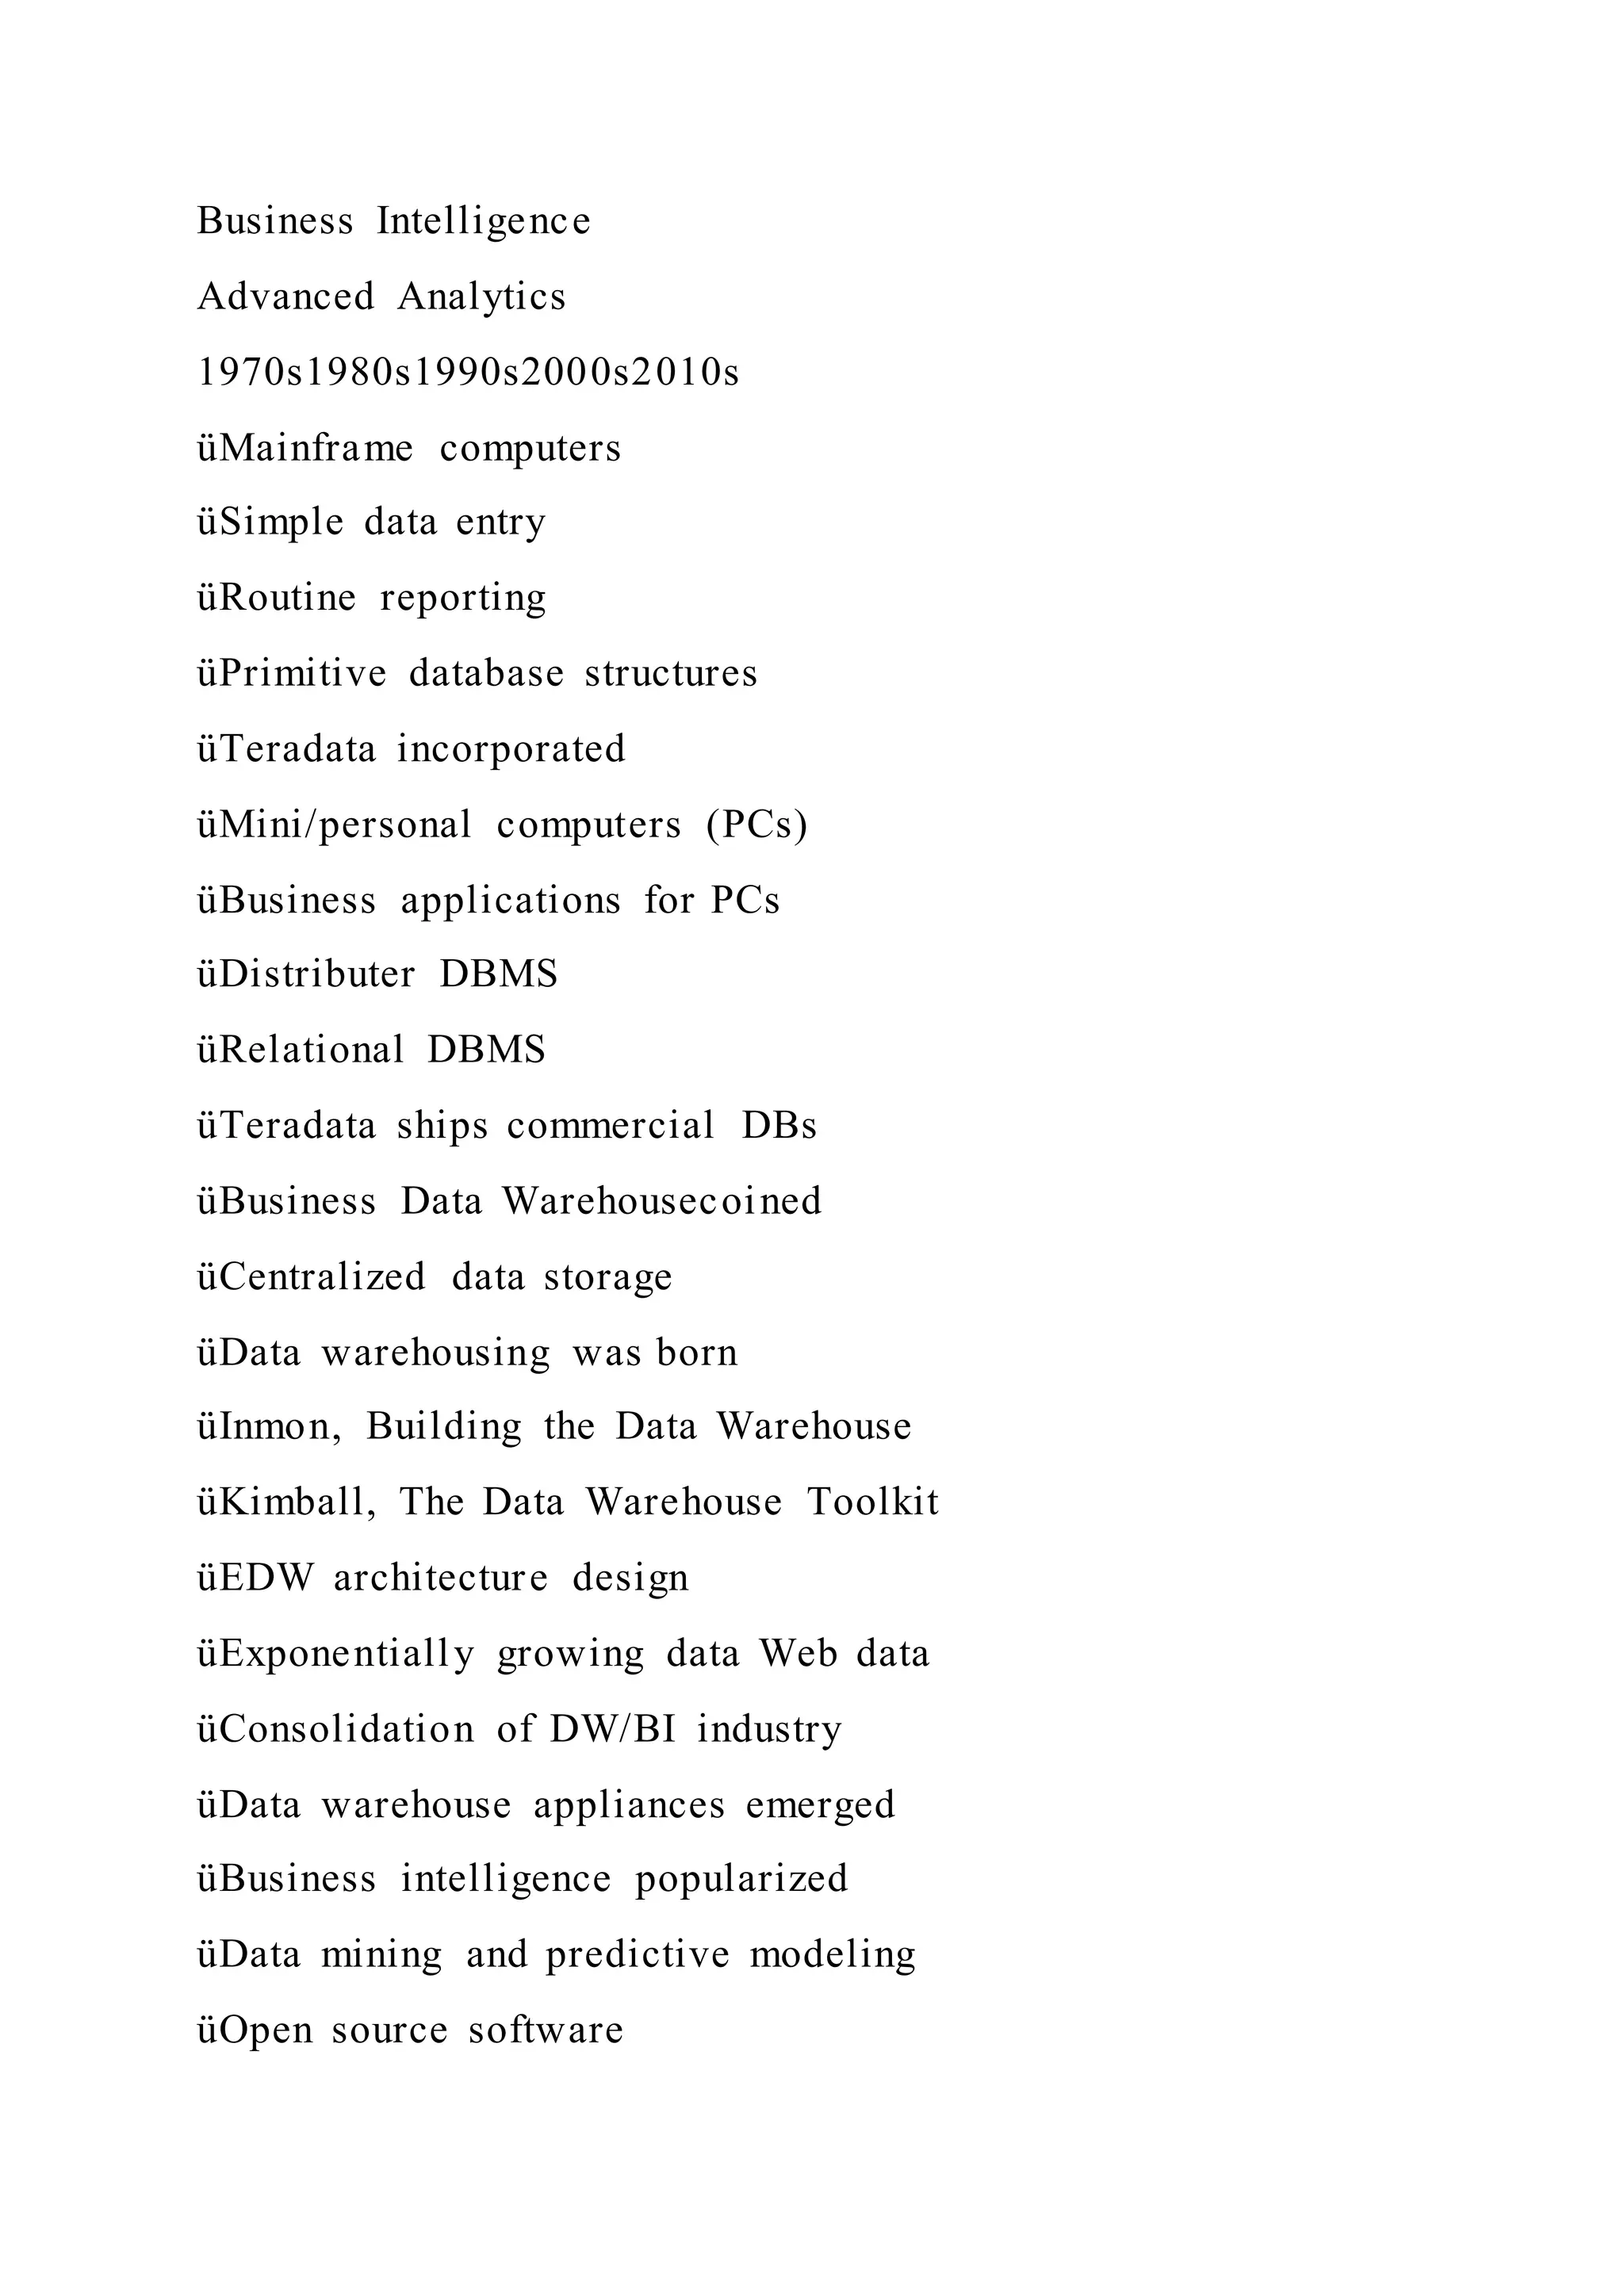
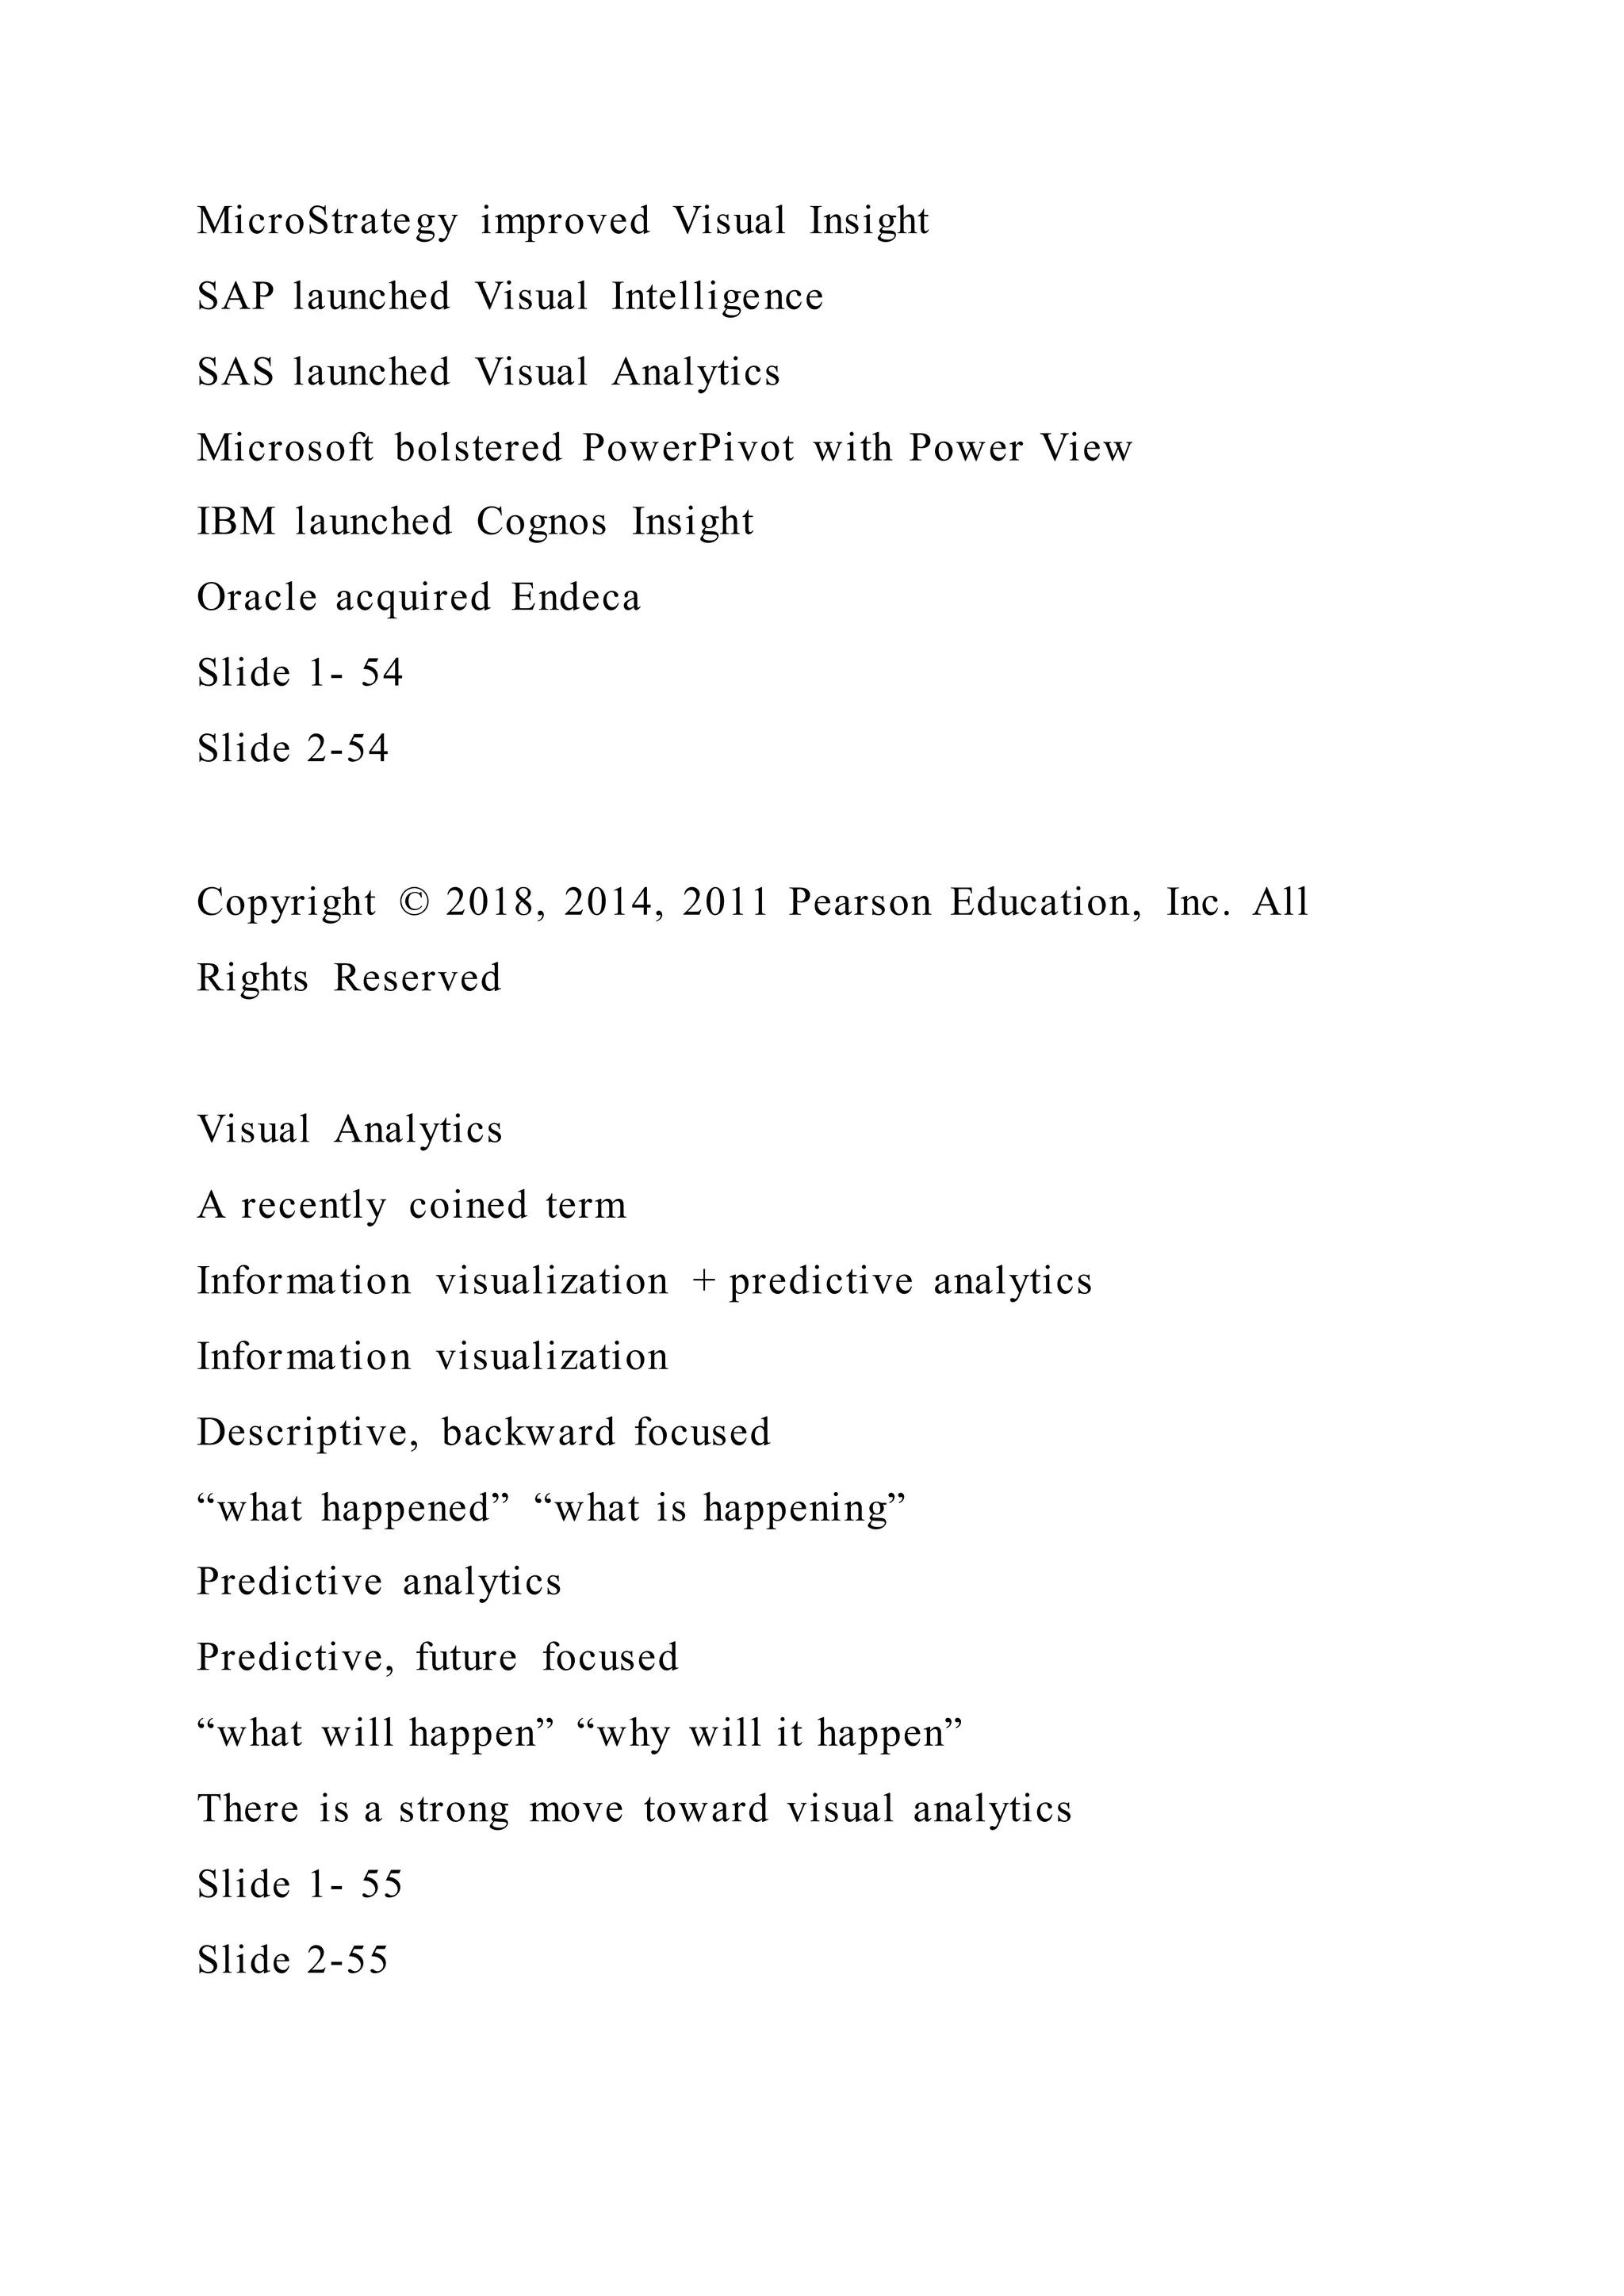
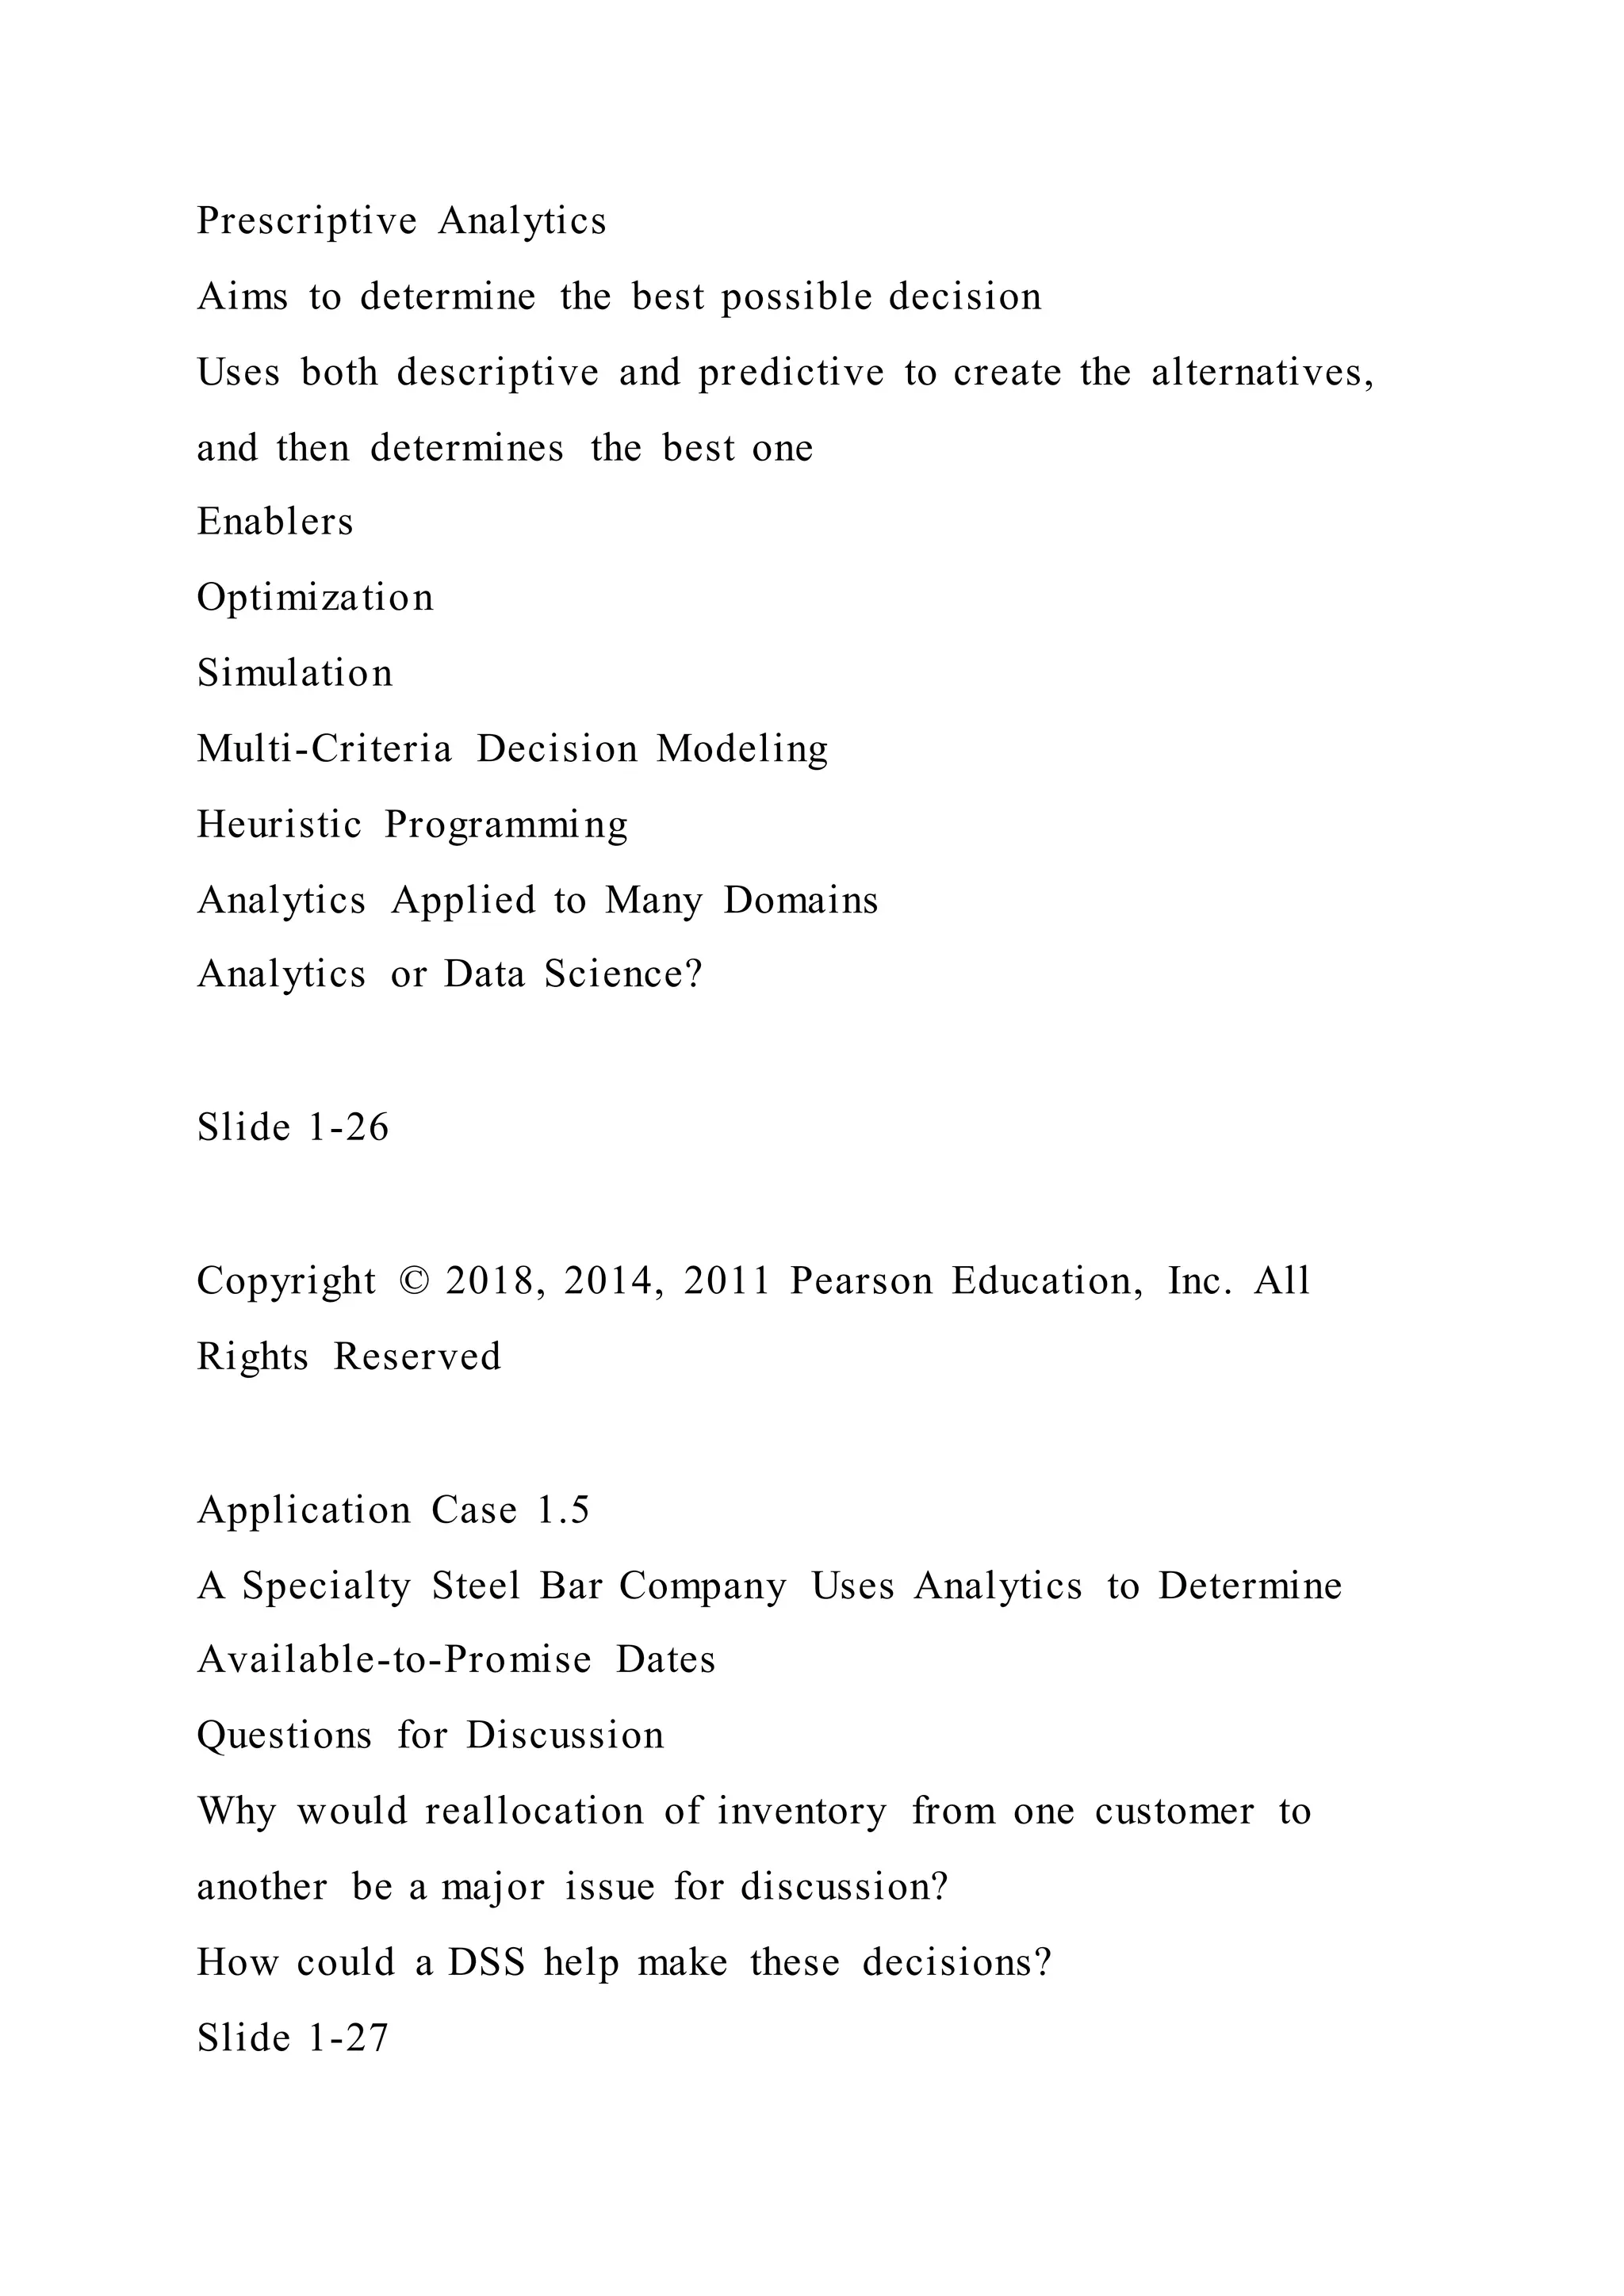
FIGURE 1.8 Evolution of Decision Support, Business
Intelligence, and Analytics
Slide 1-9
Copyright © 2018, 2014, 2011 Pearson Education, Inc. All
Rights Reserved
A Framework for Business Intelligence
Slide 1-10
Definition of Business Intelligence
[Broad Definition] An umbrella term that combines
architectures, tools, databases, analytical tools, applications,
and methodologies
[Narrow Definition] Descriptive analytics tools and techniques
(i.e., reporting tools)
A Brief History of BI –
The Origins and Drivers of BI (See Figure 1.9)
The Architecture of BI (See Figure 1.10)](https://image.slidesharecdn.com/businessintelligenceanalyticsanddatascienceamanagerial-220922030314-c40359ab/75/Business-Intelligence-Analytics-and-Data-Science-A-Managerial-85-2048.jpg)
![Serve as a repository and disseminator of best BI practices
between and among the different lines of business.
Standards of excellence in BI practices can be advocated and
encouraged throughout the company
…
Slide 1-16
Copyright © 2018, 2014, 2011 Pearson Education, Inc. All
Rights Reserved
Real-Time, On-Demand BI Is Attainable
Emergence of real-time BI applications
Justifying the need
Is there a need for real-time [is it worth the additional
expense]?
Leveraging the enablers
RFID
Web services
Intelligent agents
Slide 1-17
Copyright © 2018, 2014, 2011 Pearson Education, Inc. All
Rights Reserved
Critical BI System Considerations](https://image.slidesharecdn.com/businessintelligenceanalyticsanddatascienceamanagerial-220922030314-c40359ab/75/Business-Intelligence-Analytics-and-Data-Science-A-Managerial-89-2048.jpg)
![pleased to grant permission to make this content
available through such means. For rates and permission, contact
[email protected]](https://image.slidesharecdn.com/businessintelligenceanalyticsanddatascienceamanagerial-220922030314-c40359ab/75/Business-Intelligence-Analytics-and-Data-Science-A-Managerial-124-2048.jpg)