SURVEYS
✗In survey research, the
researcher selects a sample of
respondents from a population
and administers a
standardized questionnaire to
them.
1
Experiments
✗This is an experiment
where the researchers
manipulate one variable,
and control/randomizes
the rest of the variables.
2
Observational
research
✗Observational research (or
field research) is a type of
correlational (i.e., non-
experimental) research in
which a researcher observes
ongoing behavior.
3
Random
Sampling
Methods
The random sampling is also
called as a probability sampling
since the sample selection is
done randomly so the laws of
probability can be applied.
1
Non-Random
Sampling Methods
In the case of non-random
sampling, the selection is done
on the basis other than the
probability considerations, such
as judgment, convenience, etc.
2
Non-Random
Sampling Methods
The non-random sampling is
subject to sampling
variability, but however there
is no certain pattern of
variability in the process.
2.0
Determinin
g the
Demand
and Market
Acceptabilit
Entrepreneur Asia Pacific (n.d.)
states that market research
provides relevant data to help
solve marketing challenges that a
business will most likely face--an
integral part of the business
planning process.
8
primary sources
Gathering data from primary sources includes
observation networking, interviewing and
experimentation. It means that the person who
needs the data does the gathering himself or
herself while gathering data from secondary
sources means that somebody else has gathered
the data and you are a secondary user of said
data.
1
secondary
sources
Secondary sources of data are those that
have already been compiled and are
available like those from business
directories, demographic data from
government or private agencies, existing
market research, and those from the
internet.
2
Secondary data includes:
o public documents
o books
o journals and magazines
o internet
o internal data bases
11
SAM
PLIN
G
12
British Library (n.d.) cited
sampling as an effective way of
obtaining opinions from a wide
range of people, selected from a
specific group, in a bid to find out
more about a whole group in
general.
13
Simple Random
Sampling
— the most commonly used sampling
technique, and truly random, this
method randomly selects individuals
from a list of the population, with
every individual having an equal
chance at being selected.
14
Stratified
Sampling
— this method is a conflation of
Simple Random and Systematic
Sampling and is often used when
there are a multitude of unique
subgroups that require full,
randomized representation across
the sampling population.
15
Systematic
Sampling
— rather than randomly
selecting individuals from a
population, this method is
based on a system of selecting
participants.
16
Multistage
Sampling
– it is the probability sampling
technique wherein the sampling
is carried out in several stages
such that the sample size gets
reduced at each stage.
17
Judgement
Sampling
– it is the non-random sampling
technique wherein the choice of
sample items depends
exclusively on the investigator’s
knowledge and professional
judgment.
18
Convenience
Sampling
– it is the non-probability
sampling technique wherein a
proportion of the population is
selected on the basis of its
convenient availability.
19
Quota Sampling
– it is yet another non-probability
sampling method wherein the
population is divided into a
mutually exclusive, sub-groups
from which the sample items are
selected on the basis of a given
proportion.
20
Snowball
Sampling
– it is a non-random sampling
technique wherein the initial
informants are approached who
through their social network nominate
or refer the participants that meet the
eligibility criteria of the research under
study.
21
Snowball
Sampling
Thus, this method is also
called as the referral
sampling method or chain
sampling method.
22
DATA
PROCE
SSING
23
Lumen (n.d.) described analysis of
data as a process of inspecting,
cleaning, transforming, and
modelling data with the goal of
highlighting useful information,
suggesting conclusions, and
supporting decision making.
24
1. Input – The first part of the
data processing cycle involves
collecting data as well as
entering it and then preparing
it for the next part of the cycle.
Data Processing
Cycle
25
2. Processing – During the
second part of the cycle, data is
manipulated according to
instructions and parameters
programmed into the
processing application.
Data Processing
Cycle
26
3. Output – The form of
outputs includes common
variations such as results
that are printed or displayed
on a computer monitor.
Data Processing
Cycle
27
4. Interpretation –
Assessing and analyzing
results: What does the
data mean?
Data Processing
Cycle
28
5. Feedback –
Comparing output with
desired results: How can
data be processed better?
Data Processing
Cycle
29
6. Storage – Archiving
the data (either
physically or
electronically) for future
use.
Data Processing
Cycle
30
Thank
s!
Any question?
31
1. Editing – What data do
you really need? Extracting
and editing relevant data is
the critical first step on
your way to useful results.
Steps in Business
Data Processing
32
2. Coding – This step is also
known as bucketing or netting
and aligns the data in a
systematic arrangement that
can be understood by computer
systems.
Steps in Business
Data Processing
33
3. Data Entry – Entering the
data into software is a step
that can be performed
efficiently by data entry
professionals.
Steps in Business
Data Processing
34
4. Validation – After a
“cleansing” phase, validating
the data involves checking (and
preferably double-checking) for
desired quality levels.
Steps in Business
Data Processing
35
5. Tabulation –
Arranging data in a form
that facilitates further
use and analysis.
Steps in Business
Data Processing
36
Drawing Conclusions and
Formulating Recommendations
Thus, you have to generate your
conclusions and
recommendations based on the
data you have generated,
processed and analyzed.
37

Business Enterprise Simulation-Mod5 - Copy.pptx

  • 1.
    SURVEYS ✗In survey research,the researcher selects a sample of respondents from a population and administers a standardized questionnaire to them. 1
  • 2.
    Experiments ✗This is anexperiment where the researchers manipulate one variable, and control/randomizes the rest of the variables. 2
  • 3.
    Observational research ✗Observational research (or fieldresearch) is a type of correlational (i.e., non- experimental) research in which a researcher observes ongoing behavior. 3
  • 4.
    Random Sampling Methods The random samplingis also called as a probability sampling since the sample selection is done randomly so the laws of probability can be applied. 1
  • 5.
    Non-Random Sampling Methods In thecase of non-random sampling, the selection is done on the basis other than the probability considerations, such as judgment, convenience, etc. 2
  • 6.
    Non-Random Sampling Methods The non-randomsampling is subject to sampling variability, but however there is no certain pattern of variability in the process. 2.0
  • 7.
  • 8.
    Entrepreneur Asia Pacific(n.d.) states that market research provides relevant data to help solve marketing challenges that a business will most likely face--an integral part of the business planning process. 8
  • 9.
    primary sources Gathering datafrom primary sources includes observation networking, interviewing and experimentation. It means that the person who needs the data does the gathering himself or herself while gathering data from secondary sources means that somebody else has gathered the data and you are a secondary user of said data. 1
  • 10.
    secondary sources Secondary sources ofdata are those that have already been compiled and are available like those from business directories, demographic data from government or private agencies, existing market research, and those from the internet. 2
  • 11.
    Secondary data includes: opublic documents o books o journals and magazines o internet o internal data bases 11
  • 12.
  • 13.
    British Library (n.d.)cited sampling as an effective way of obtaining opinions from a wide range of people, selected from a specific group, in a bid to find out more about a whole group in general. 13
  • 14.
    Simple Random Sampling — themost commonly used sampling technique, and truly random, this method randomly selects individuals from a list of the population, with every individual having an equal chance at being selected. 14
  • 15.
    Stratified Sampling — this methodis a conflation of Simple Random and Systematic Sampling and is often used when there are a multitude of unique subgroups that require full, randomized representation across the sampling population. 15
  • 16.
    Systematic Sampling — rather thanrandomly selecting individuals from a population, this method is based on a system of selecting participants. 16
  • 17.
    Multistage Sampling – it isthe probability sampling technique wherein the sampling is carried out in several stages such that the sample size gets reduced at each stage. 17
  • 18.
    Judgement Sampling – it isthe non-random sampling technique wherein the choice of sample items depends exclusively on the investigator’s knowledge and professional judgment. 18
  • 19.
    Convenience Sampling – it isthe non-probability sampling technique wherein a proportion of the population is selected on the basis of its convenient availability. 19
  • 20.
    Quota Sampling – itis yet another non-probability sampling method wherein the population is divided into a mutually exclusive, sub-groups from which the sample items are selected on the basis of a given proportion. 20
  • 21.
    Snowball Sampling – it isa non-random sampling technique wherein the initial informants are approached who through their social network nominate or refer the participants that meet the eligibility criteria of the research under study. 21
  • 22.
    Snowball Sampling Thus, this methodis also called as the referral sampling method or chain sampling method. 22
  • 23.
  • 24.
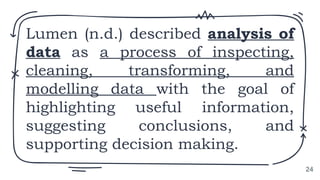
    Lumen (n.d.) describedanalysis of data as a process of inspecting, cleaning, transforming, and modelling data with the goal of highlighting useful information, suggesting conclusions, and supporting decision making. 24
  • 25.
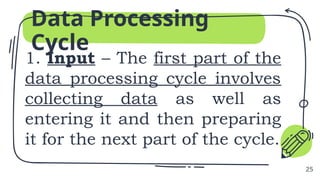
    1. Input –The first part of the data processing cycle involves collecting data as well as entering it and then preparing it for the next part of the cycle. Data Processing Cycle 25
  • 26.
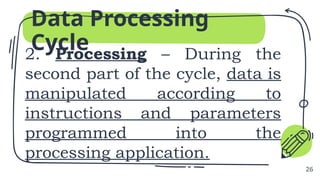
    2. Processing –During the second part of the cycle, data is manipulated according to instructions and parameters programmed into the processing application. Data Processing Cycle 26
  • 27.
    3. Output –The form of outputs includes common variations such as results that are printed or displayed on a computer monitor. Data Processing Cycle 27
  • 28.
    4. Interpretation – Assessingand analyzing results: What does the data mean? Data Processing Cycle 28
  • 29.
    5. Feedback – Comparingoutput with desired results: How can data be processed better? Data Processing Cycle 29
  • 30.
    6. Storage –Archiving the data (either physically or electronically) for future use. Data Processing Cycle 30
  • 31.
  • 32.
    1. Editing –What data do you really need? Extracting and editing relevant data is the critical first step on your way to useful results. Steps in Business Data Processing 32
  • 33.
    2. Coding –This step is also known as bucketing or netting and aligns the data in a systematic arrangement that can be understood by computer systems. Steps in Business Data Processing 33
  • 34.
    3. Data Entry– Entering the data into software is a step that can be performed efficiently by data entry professionals. Steps in Business Data Processing 34
  • 35.
    4. Validation –After a “cleansing” phase, validating the data involves checking (and preferably double-checking) for desired quality levels. Steps in Business Data Processing 35
  • 36.
    5. Tabulation – Arrangingdata in a form that facilitates further use and analysis. Steps in Business Data Processing 36
  • 37.
    Drawing Conclusions and FormulatingRecommendations Thus, you have to generate your conclusions and recommendations based on the data you have generated, processed and analyzed. 37

Editor's Notes

  • #16 For example, a market researcher may select from a list of the population every 20th person. While this allows for a controlled way to select from a target population, it may be skewed depending on how the original list is structured or organized.
  • #17 For example, a market researcher may select from a list of the population every 20th person. While this allows for a controlled way to select from a target population, it may be skewed depending on how the original list is structured or organized.
  • #18 For example, a market researcher may select from a list of the population every 20th person. While this allows for a controlled way to select from a target population, it may be skewed depending on how the original list is structured or organized.
  • #19 For example, a market researcher may select from a list of the population every 20th person. While this allows for a controlled way to select from a target population, it may be skewed depending on how the original list is structured or organized.
  • #20 For example, a market researcher may select from a list of the population every 20th person. While this allows for a controlled way to select from a target population, it may be skewed depending on how the original list is structured or organized.
  • #21 For example, a market researcher may select from a list of the population every 20th person. While this allows for a controlled way to select from a target population, it may be skewed depending on how the original list is structured or organized.
  • #22 For example, a market researcher may select from a list of the population every 20th person. While this allows for a controlled way to select from a target population, it may be skewed depending on how the original list is structured or organized.
  • #24 Data analysis has multiple facets and approaches, encompassing diverse techniques under a variety of names in different business, science, and social science domains (Lumen, n.d.).