Business... at a glance February 2019
•
0 likes•130 views

This document contains summaries of economic trends in Spain and other parts of Europe: - Registered unemployment in Spain decreased by 5.5% year-over-year in January, the largest drop since 2014, though social security affiliates declined by 1.08% from December. - Spanish manufacturing industry gross added value fell for the second consecutive quarter in Q4 2018 due to global trade tensions and slowing growth. - Private equity investment in Spain reached a record €5.84 billion in 2018, a 17.9% increase from 2017, with international funds contributing 77% of the total volume.

Recommended
Recommended
More Related Content
What's hot
What's hot (20)
Similar to Business... at a glance February 2019
Similar to Business... at a glance February 2019 (20)
More from Círculo de Empresarios
More from Círculo de Empresarios (20)
Recently uploaded
Recently uploaded (20)
Business... at a glance February 2019
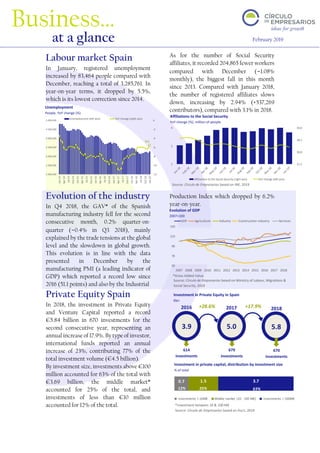
- 1. 50 70 90 110 130 2007 2008 2009 2010 2011 2012 2013 2014 2015 2016 2017 2018 GDP Agriculture Industry Construction industry Services 0.7 1.5 3.7 Investments < 10M€ Middle market (10 - 100 M€) Investments > 100M€ 12% 25% 63% -5.5 -12 -10 -8 -6 -4 -2 0 2.000.000 2.500.000 3.000.000 3.500.000 4.000.000 4.500.000 5.000.000 Jan-14 Apr-14 Jul-14 Oct-14 Jan-15 Apr-15 Jul-15 Oct-15 Jan-16 Apr-16 Jul-16 Oct-16 Jan-17 Apr-17 Jul-17 Oct-17 Jan-18 Apr-18 Jul-18 Oct-18 Jan-19 Unemployment (left axis) YoY change (right axis) 17,5 18,0 18,5 19,0 2 3 4 Affiliations to the Social Security (right axis) YoY change (left axis) Labour market Spain In January, registered unemployment increased by 83,464 people compared with December, reaching a total of 3,285,761. In year-on-year terms, it dropped by 5.5%, which is its lowest correction since 2014. As for the number of Social Security affiliates, it recorded 204,865 fewer workers compared with December (-1.08% monthly), the biggest fall in this month since 2013. Compared with January 2018, the number of registered affiliates slows down, increasing by 2.94% (+537,269 contributors), compared with 3.1% in 2018. Evolution of the industry In Q4 2018, the GAV* of the Spanish manufacturing industry fell for the second consecutive month, 0.2% quarter-on- quarter (-0.4% in Q3 2018), mainly explained by the trade tensions at the global level and the slowdown in global growth. This evolution is in line with the data presented in December by the manufacturing PMI (a leading indicator of GDP) which reported a record low since 2016 (51.1 points) and also by the Industrial Production Index which dropped by 6.2% year-on-year. Private Equity Spain In 2018, the investment in Private Equity and Venture Capital reported a record €5.84 billion in 670 investments for the second consecutive year, representing an annual increase of 17.9%. By type of investor, international funds reported an annual increase of 23%, contributing 77% of the total investment volume (€4.5 billion). By investment size, investments above €100 million accounted for 63% of the total with €3.69 billion, the middle market* accounted for 25% of the total, and investments of less than €10 million accounted for 12% of the total. Business… at a glance February 2019 Source: Círculo de Empresarios based on Ministry of Labour, Migrations & Social Security, 2019 Source: Círculo de Empresarios based on Ascri, 2019 Evolution of GDP 2007=100 v Source: Círculo de Empresarios based on INE, 2019 Affiliations to the Social Security YoY change (%), million of people Investment in Private Equity in Spain €bn v 2016 2018+28.6% 2017 3.9 5.0 +17.9% 5.8 614 investments 679 investments 670 investments Investment in private capital, distribution by investment size % of total *Investment between 10 & 100 M€ *Gross Added Value Unemployment People, YoY change (%) v
- 2. ‘Business at a glance’, a publication of the Círculo de Empresarios produced by its Department of the Economy, contains information and opinion from reliable sources. However, the Círculo de Empresarios does not guarantee its accuracy and does not take responsibility for any errors or omissions. This document is merely informative. As a result, the Círculo de Empresarios is not responsible for any uses that may be made of the publication. The opinions and estimates of the Department can be modified without prior warning. www.circulodeempresarios.org -15 -10 -5 0 5 10 15 Mining Computers Textile Machinery and equipament Automobile Chermicals Energy 2000-07 2007-17 Italy debt (% of GDP) • Governtment debt: 144.0% • Debt private non-financial sector: 112.1% European banks’ credit exposure: 425 €bn (25% of GDP) UK US Sweden Canada Germany France Spain Netherlands FDI 2018 4.9 4.8 4.1 2.7 2.5 1.8 1.2 0.9 Annual change (%) -75.7 -83.6 187.2 134.8 33.3 86.7 160 -75.7 France 285 Cyprus 0.7Malta 0.2 Other banks 17.4 Ireland 0.3 UK 17.4 Portugal 1.9 Germany 58.7 Belgium 25.2 Spain 21.4 80 23 31 8 0 10 20 30 40 50 60 70 80 90 2012 2013 2014 2015 2016 2017 2018 Investment in Europe Investment in North America -73% Italian debt According to Bloomberg, based on the data from the European Banking Authority (EBA), European banks* currently hold 10% of Italy's total sovereign and private debt, equivalent to 25% of its GDP (€425 billion). By country, banks from France have the highest exposure with 67.2% of the total, followed by Germany (13.8%), Belgium (5.9%), and Spain (5%). Brexit The uncertainty generated by the possibility of a ‘no-deal’ Brexit has caused British companies to activate their contingency plans. In January, according to the Institute of Directors, 13% of large companies were considering leaving the United Kingdom, and 11% had already moved part of their business areas, mostly to EU countries. FDI China In 2018, China's foreign direct investment (FDI) into North America and Europe plummeted by 73%, standing at $29.7 billion. This evolution is mainly explained by the restrictions imposed by the Chinese authorities on capital outflows and greater control of Chinese investment by supervisory authorities in advanced economies. By recipient countries, Chinese FDI is concentrated mainly in the United Kingdom (15.9% of the total) and the US (15.5%), although it declined by 76% and 84% annually, respectively. Globalisation In recent years, globalisation has entered a new phase of development. The increase in Chinese domestic demand, the growth of more comprehensive value chains that favour intraregional activity and the emergence of new technologies are generating various structural changes in the composition of world trade in goods. The lower trade intensity* in almost all value chains of goods explains that, currently, the correlation between world trade and global GDP growth is around 1.1 compared to 2.1 in the period 1990-2007. Source: Círculo de Empresarios based on Baker Mckenzie & Rhodium Group, 2019 Foreign Direct Investment $bn v Total of European banks* credit exposure to Italy €bn v Source: Círculo de Empresarios based on Bloomberg, 2019 * Ratio of gross exports to gross production Trade intensity* by sectors % annual change v Source: Círculo de Empresarios based on Baker McKinsey & Company, 2019 *Excluding Italian Banks