Downloaded 50 times
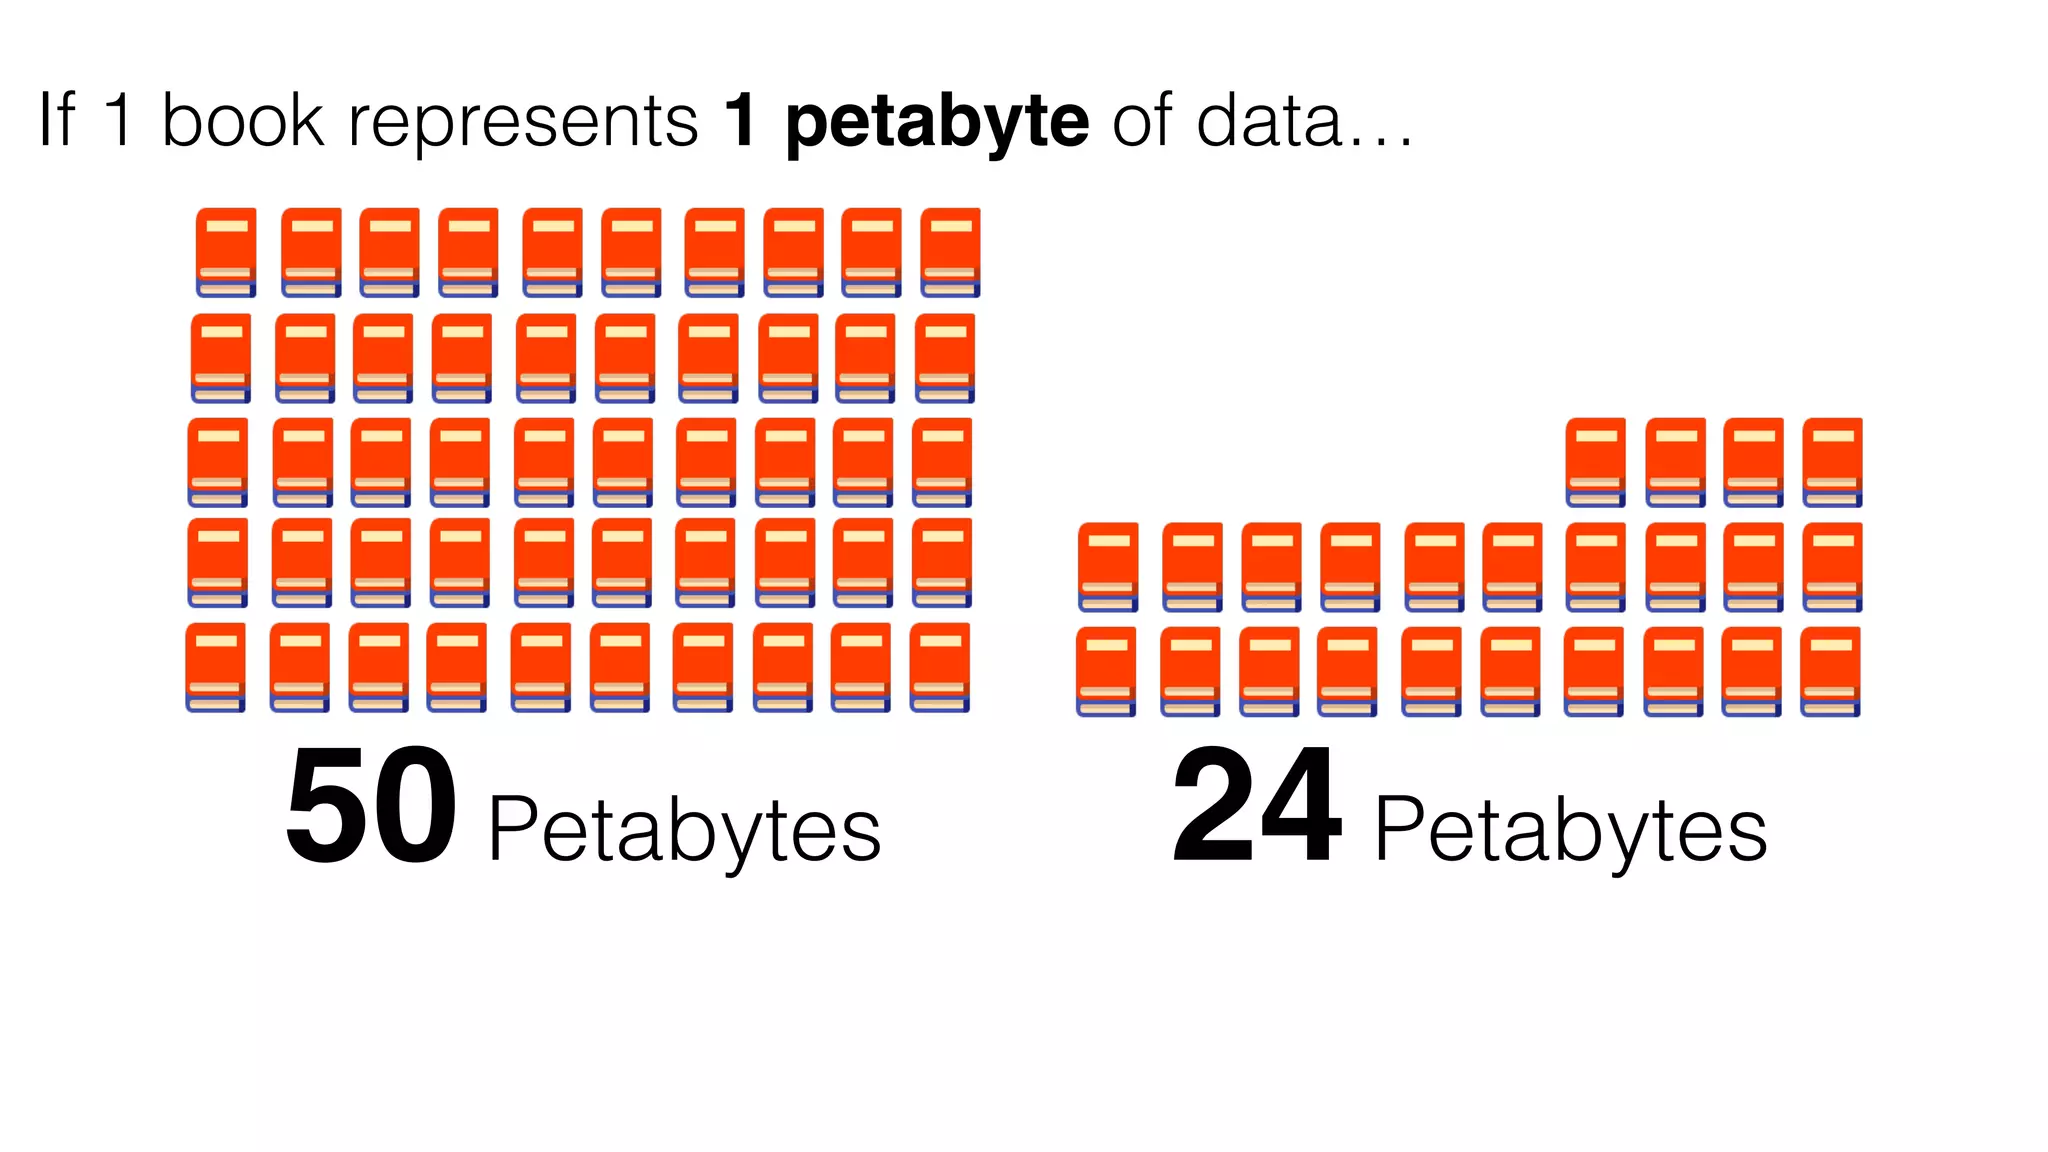
![If 1 book represents 1 petabyte of data…
50 Petabytes
All the worlds data (books, webpages,
videos, songs, etc.) between 4000BC
and 2006AD.
24 Petabytes
Amount of data processed daily by
Google alone in 2008.
[1]
[2]](https://image.slidesharecdn.com/data-drivenculturev2-160412112118/75/Building-a-Data-Driven-Culture-3-2048.jpg)
![“We are drowning in data but
starved for information”
~ Gary Cokins [3]](https://image.slidesharecdn.com/data-drivenculturev2-160412112118/75/Building-a-Data-Driven-Culture-4-2048.jpg)
![Starting a Growth Team
SystemiseBrainstorm Prioritise Testing AnalyseImplement [4]](https://image.slidesharecdn.com/data-drivenculturev2-160412112118/75/Building-a-Data-Driven-Culture-6-2048.jpg)
![Building a Growth Team
SystemiseBrainstorm Prioritise Testing AnalyseImplement
Key Learning #1:
Have an executive champion
[4]
[5]](https://image.slidesharecdn.com/data-drivenculturev2-160412112118/75/Building-a-Data-Driven-Culture-7-2048.jpg)
![Sources
[0] Icons from the Noun Project
Title slide: Data Planning and Data Network by Ivan Colic
Slide 6: Advocate by Lorie Shaull
Slide 7 & 8: Database by Shmidt Sergey, Group by Alexandr Cherkinsky, Graph by Vicons Design
Slide 9 & 10: App analytics by Sergey Novosyolov
Slide 11 & 12: Reporting by Alfredo Hernandez, Repeat by Pantelis Gkavos
[1] Kelly Kevin, 2006. http://www.nytimes.com/2006/05/14/magazine/14publishing.html?pagewanted=all&_r=0
[2] Dean and Ghemawat, 2008. http://dl.acm.org/citation.cfm?doid=1327452.1327492
[3] Gary Cokins, 2013. http://www.forbes.com/sites/jeffthomson/2013/10/30/why-cfos-are-drowning-in-data-but-
starving-for-information/#29968dd52623
[4] Brian Balfour, 2014. http://www.coelevate.com/essays/growth-process-first-tactics-second
[5] Josh Schwarzapel https://medium.com/android-news/how-to-start-a-growth-team-ff70cd29c0f2#.uls9ubea6](https://image.slidesharecdn.com/data-drivenculturev2-160412112118/75/Building-a-Data-Driven-Culture-16-2048.jpg)


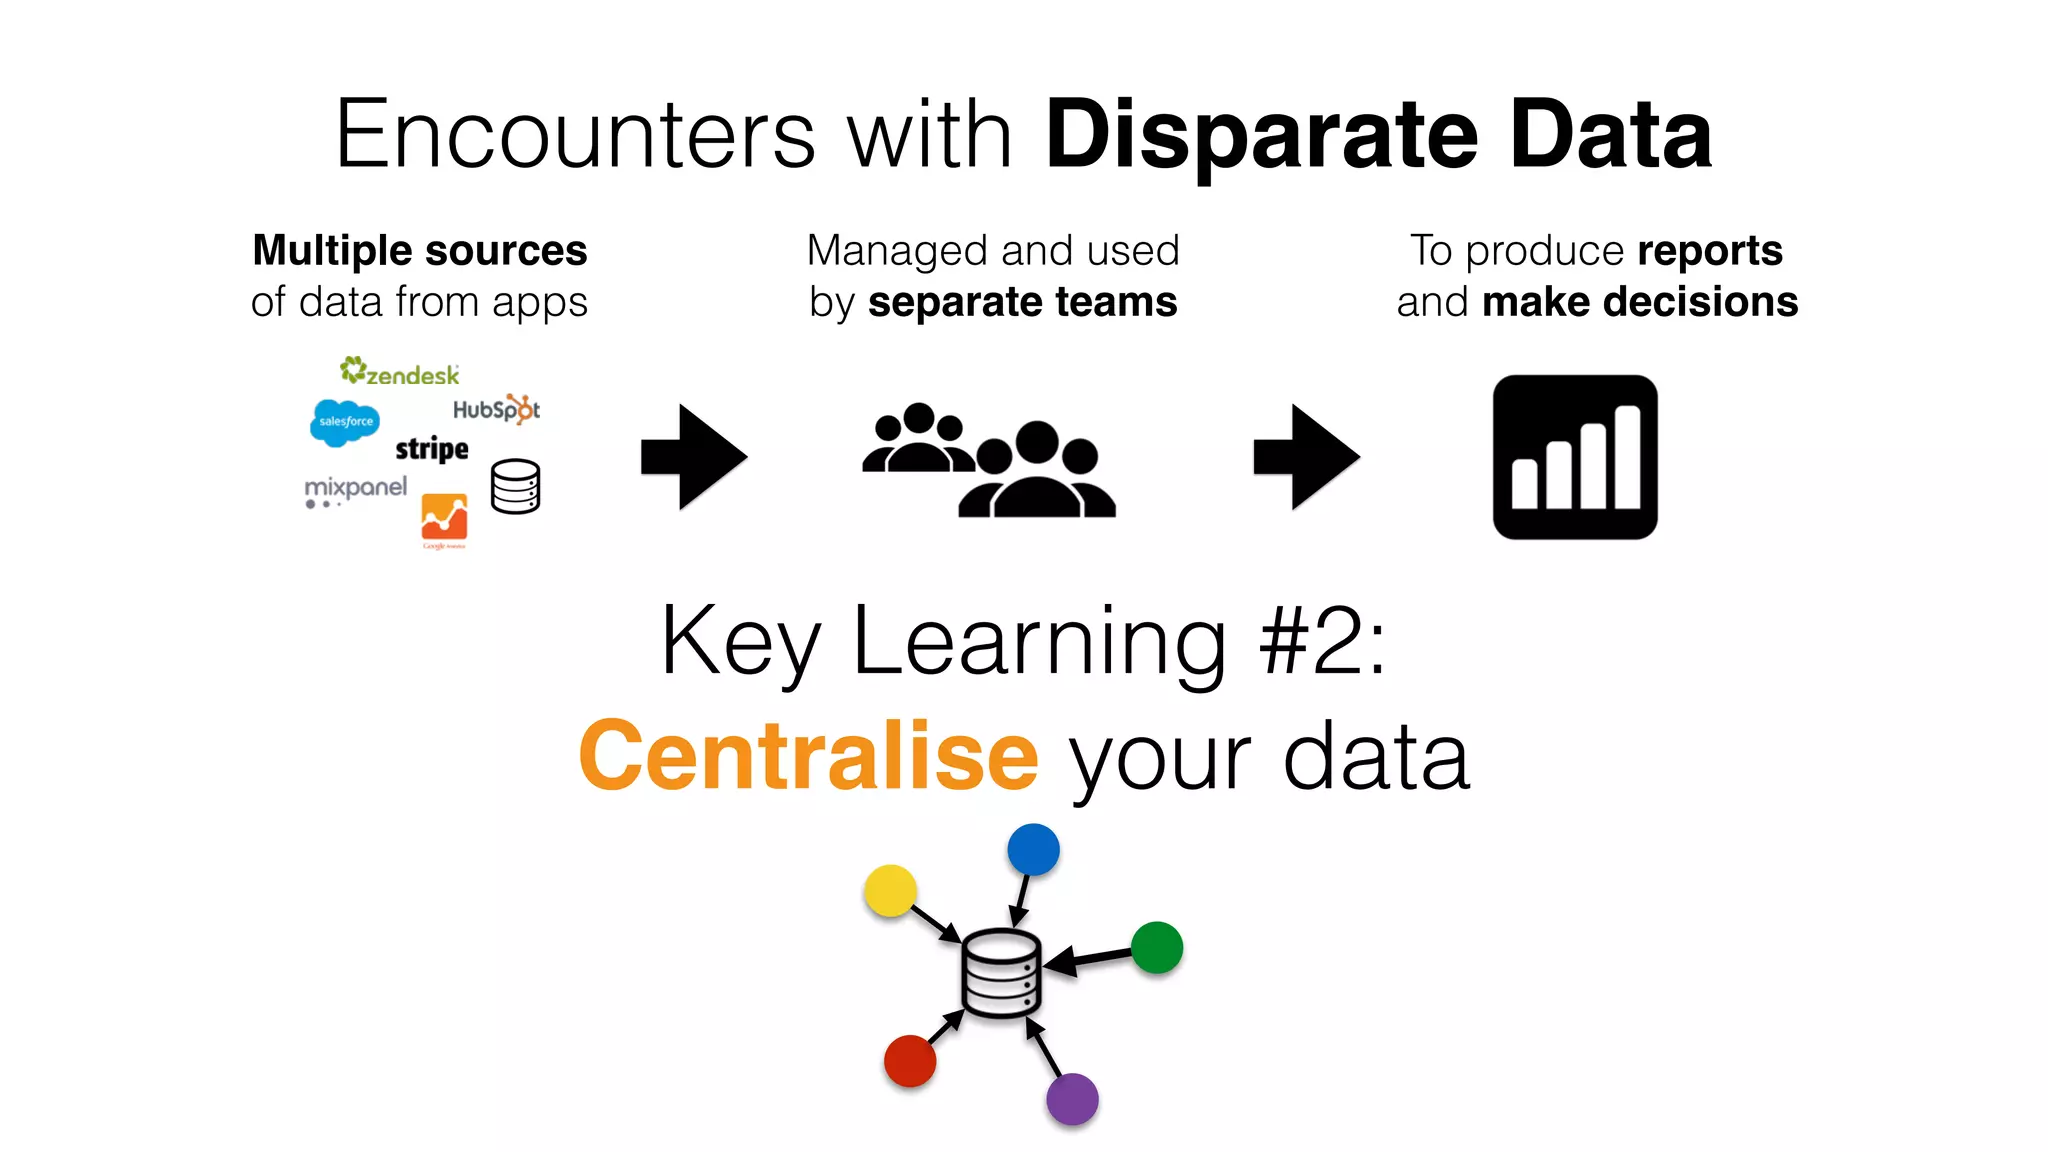
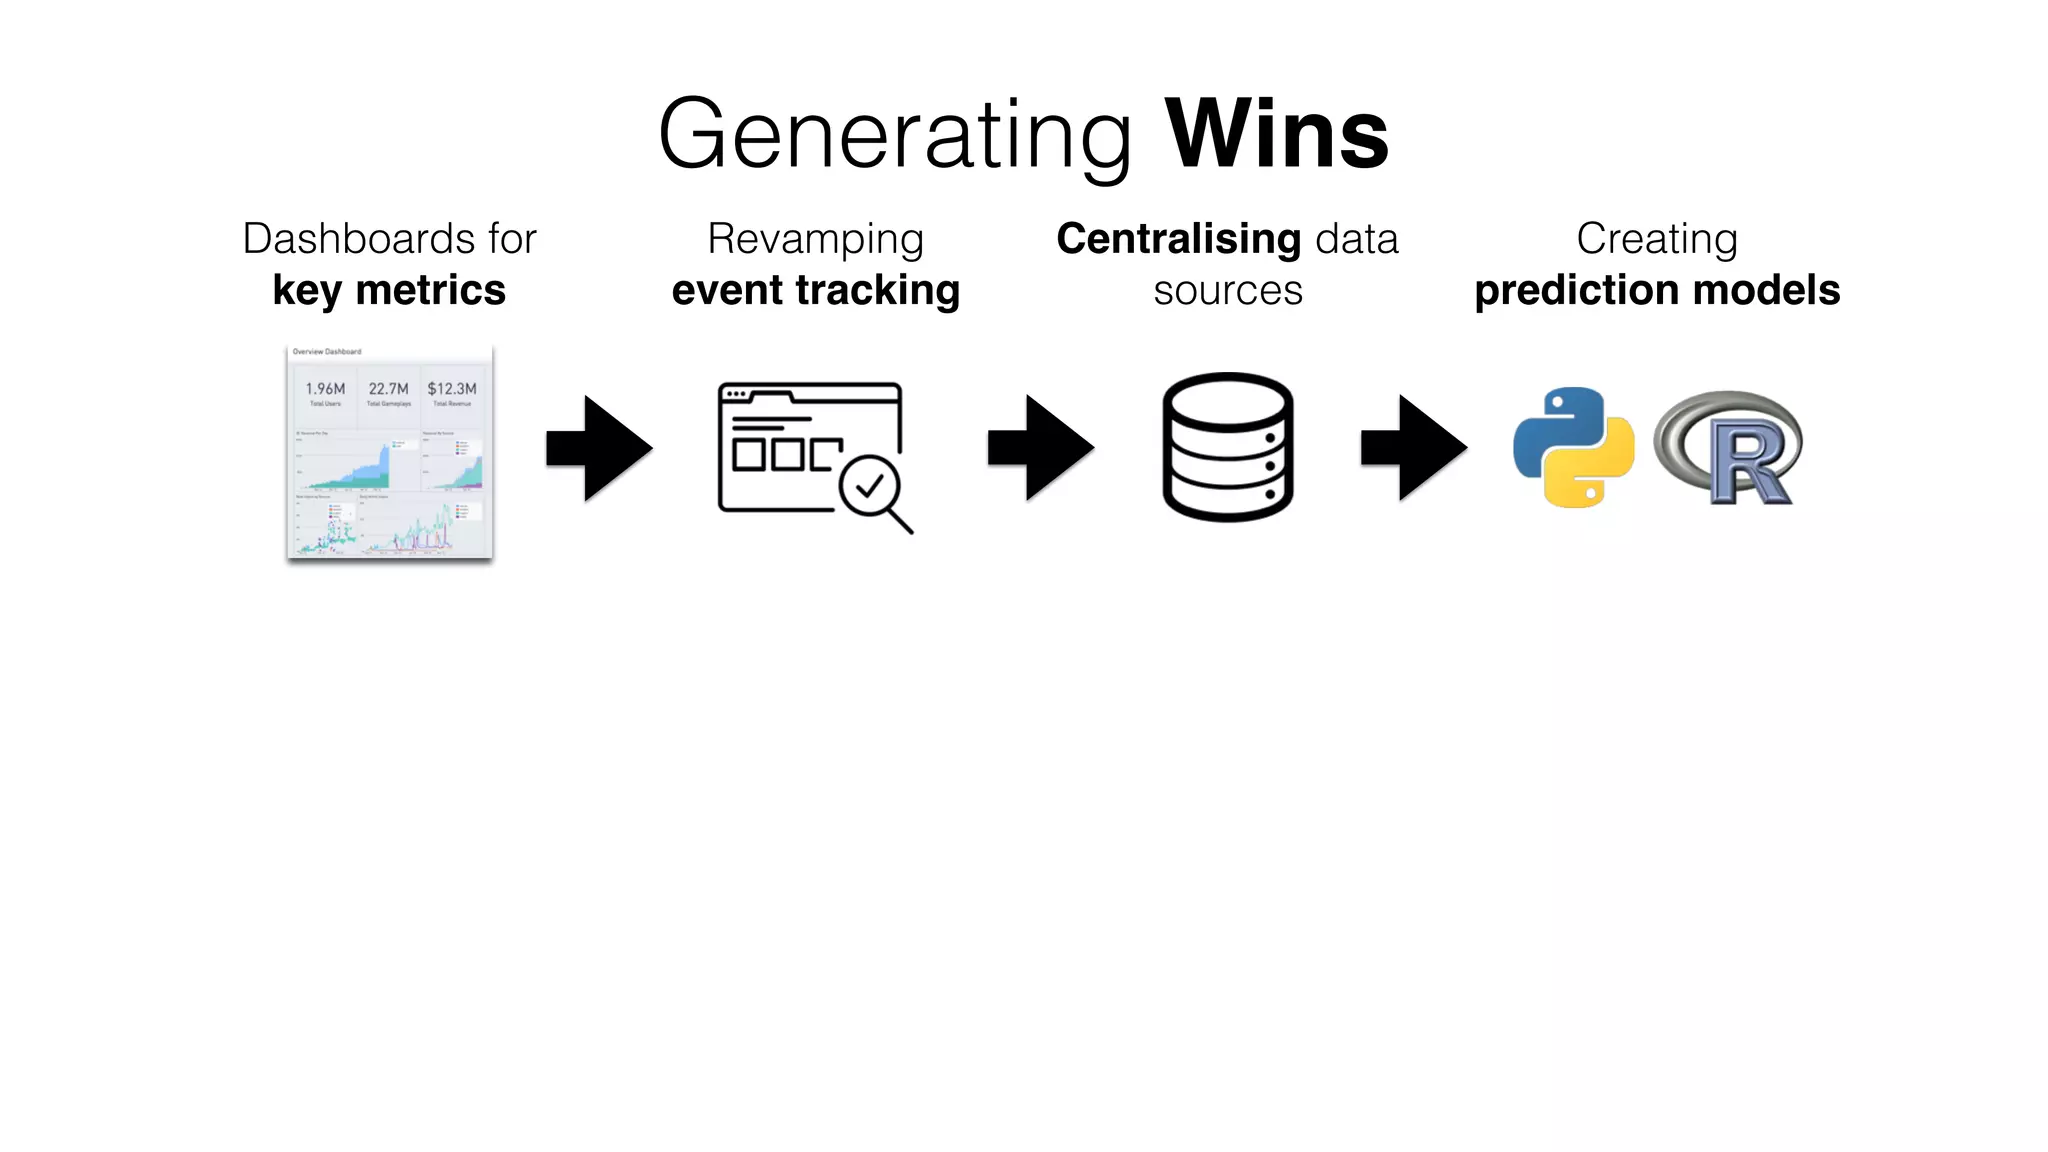
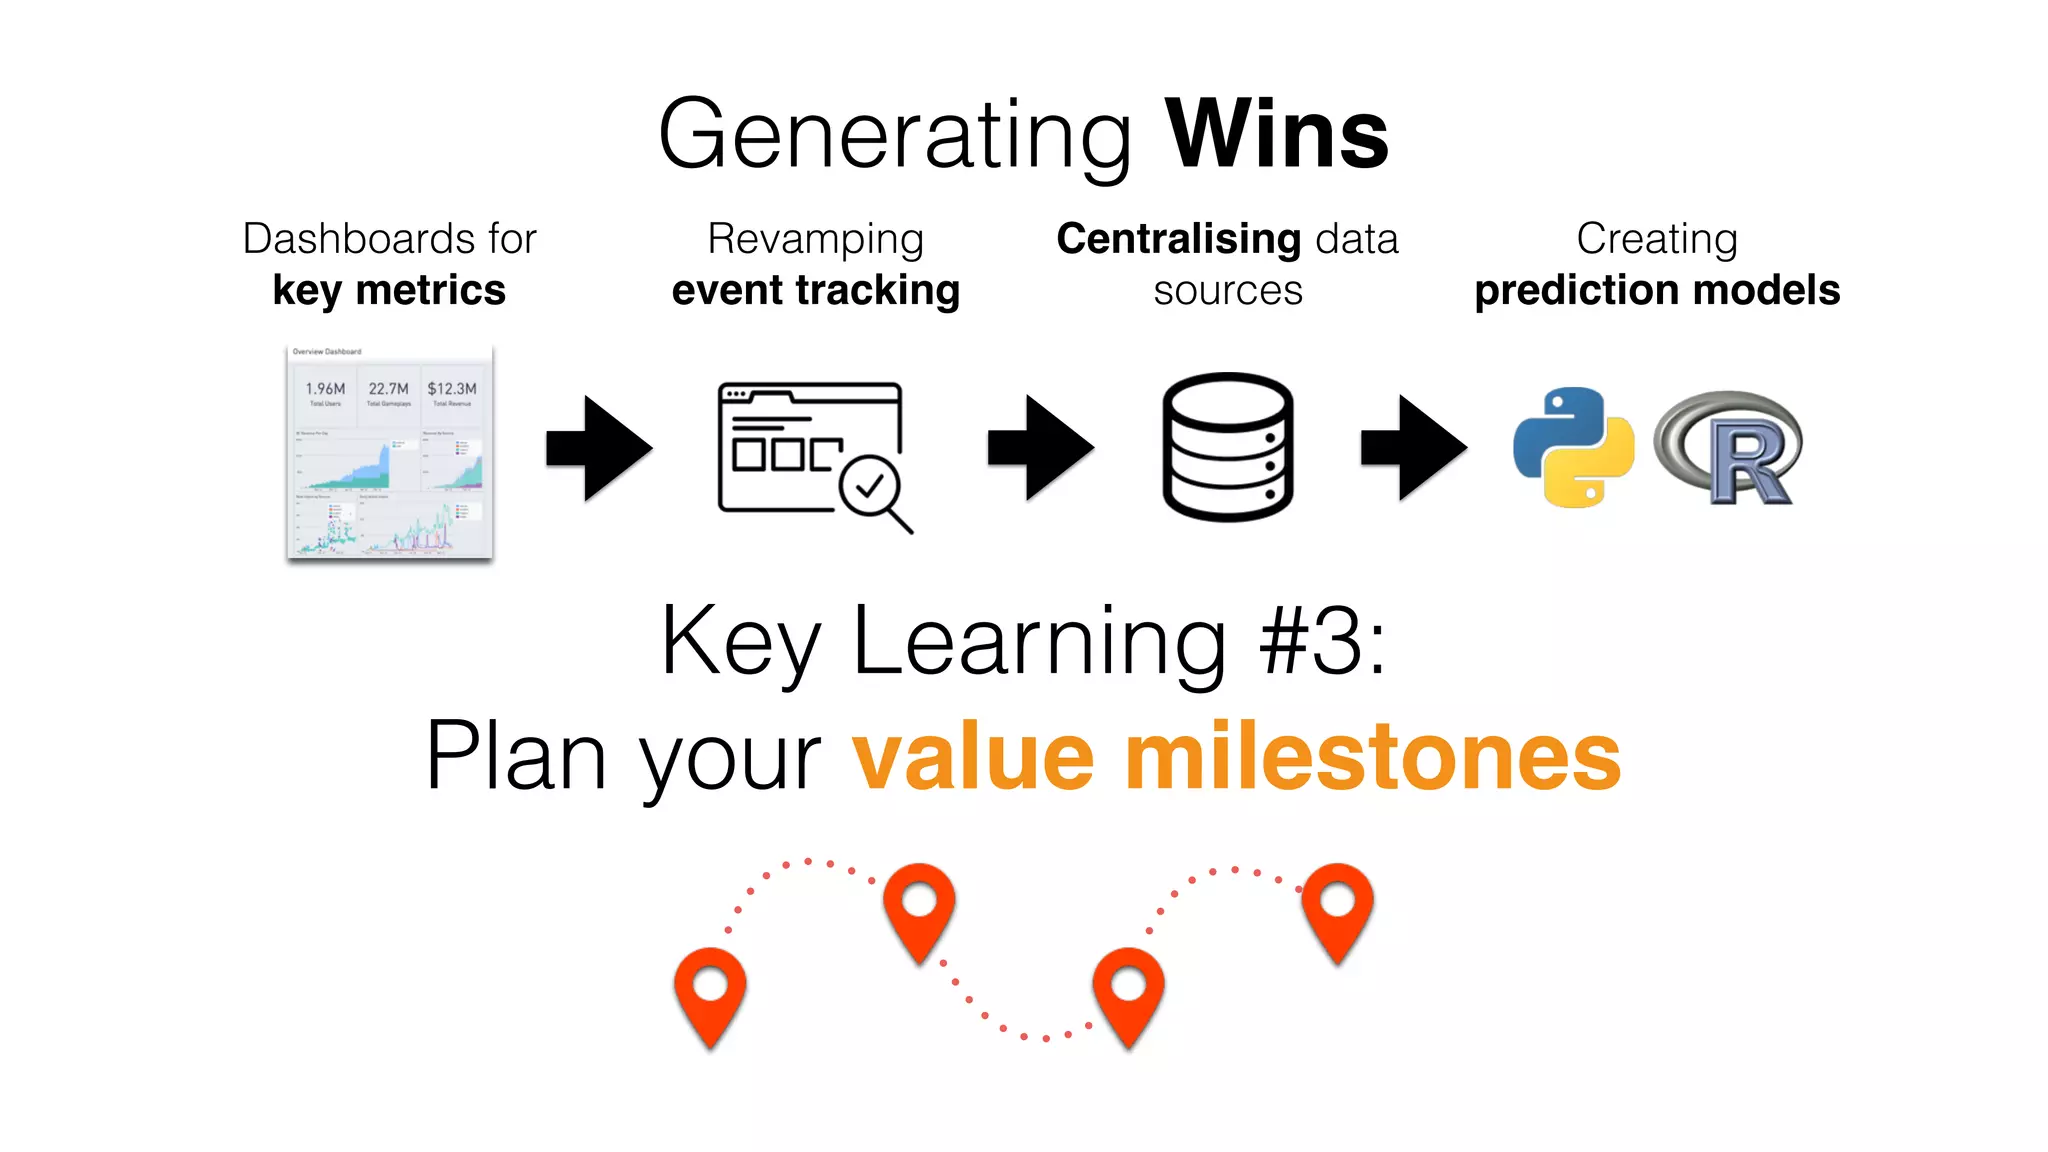
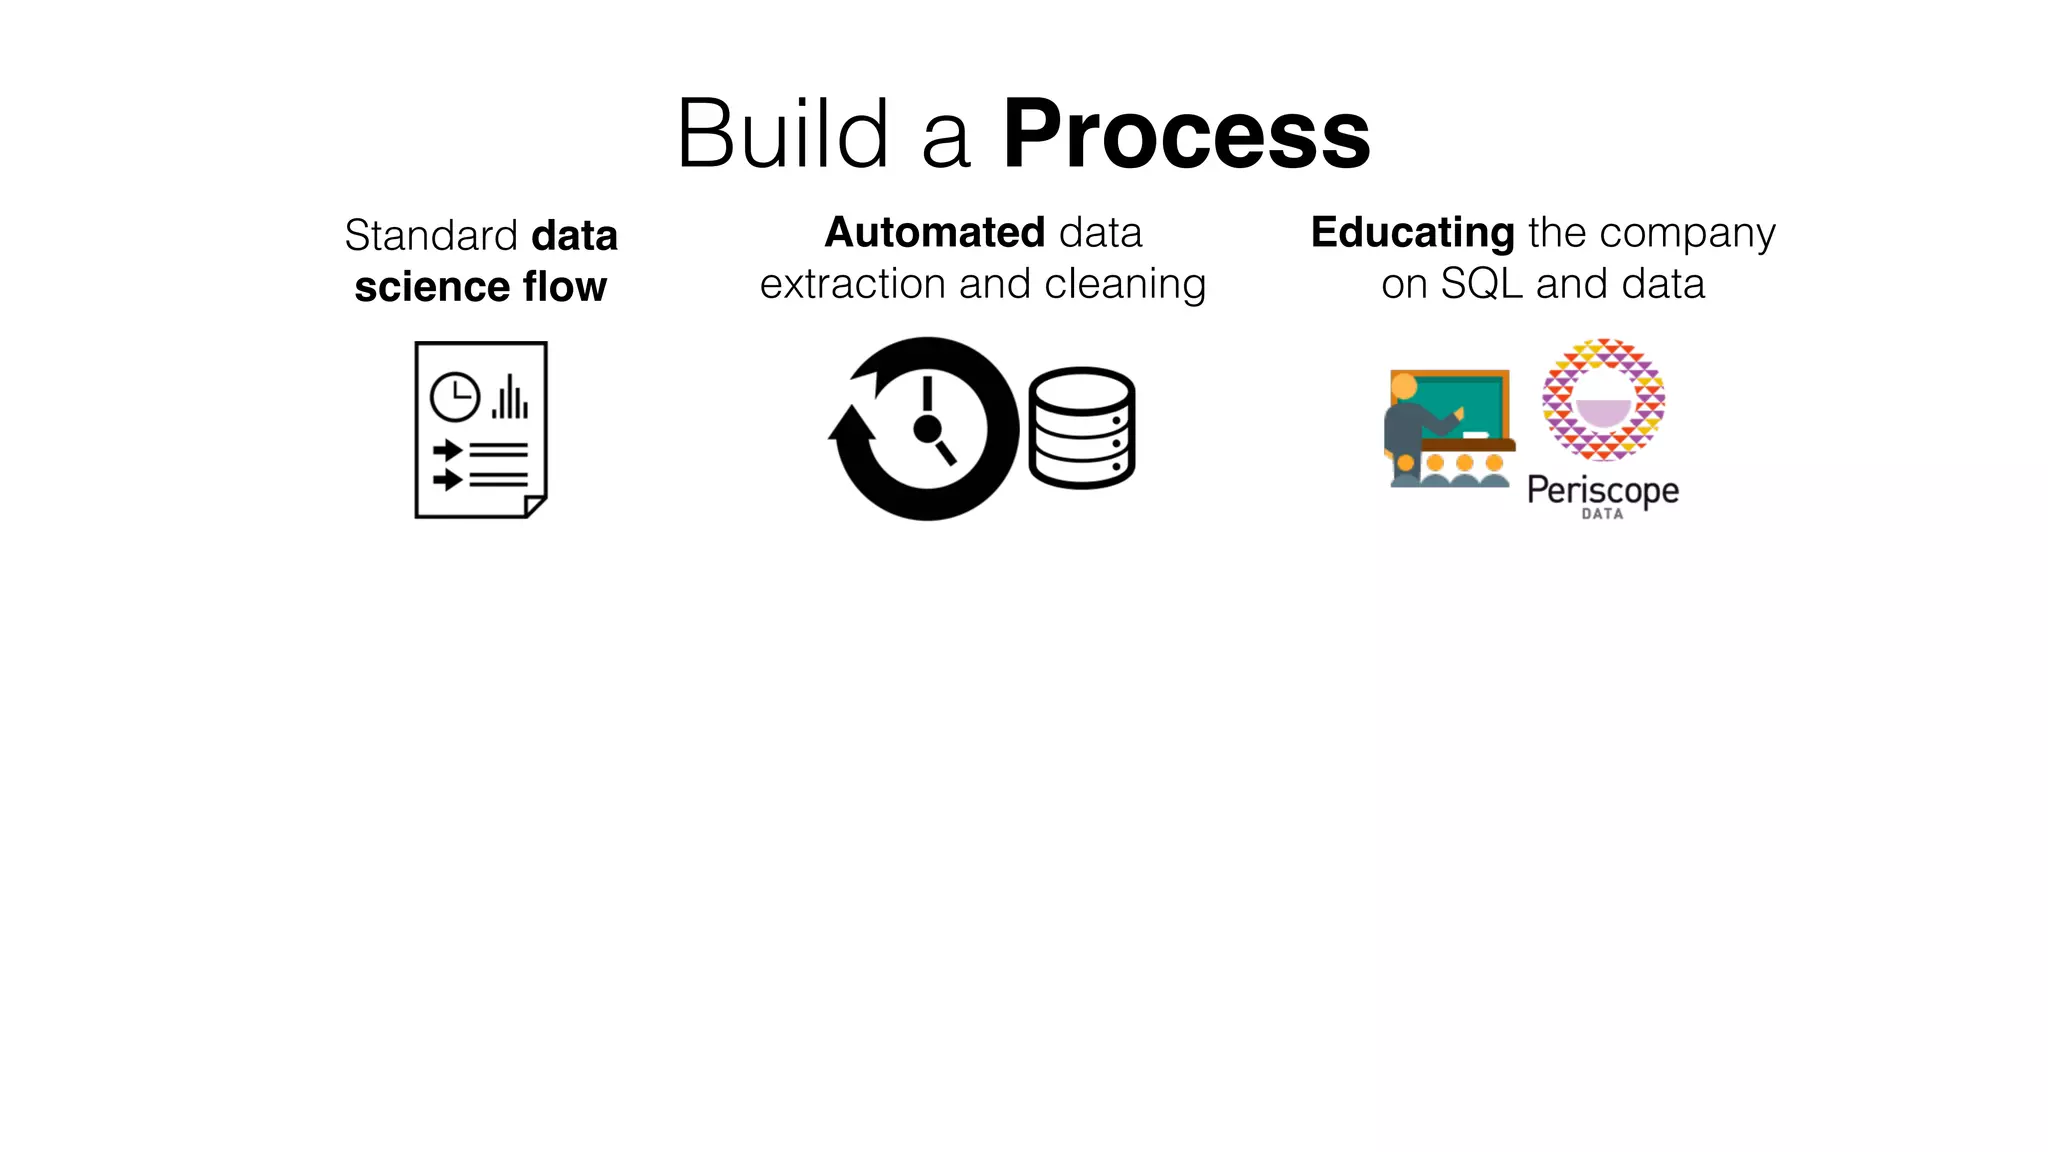
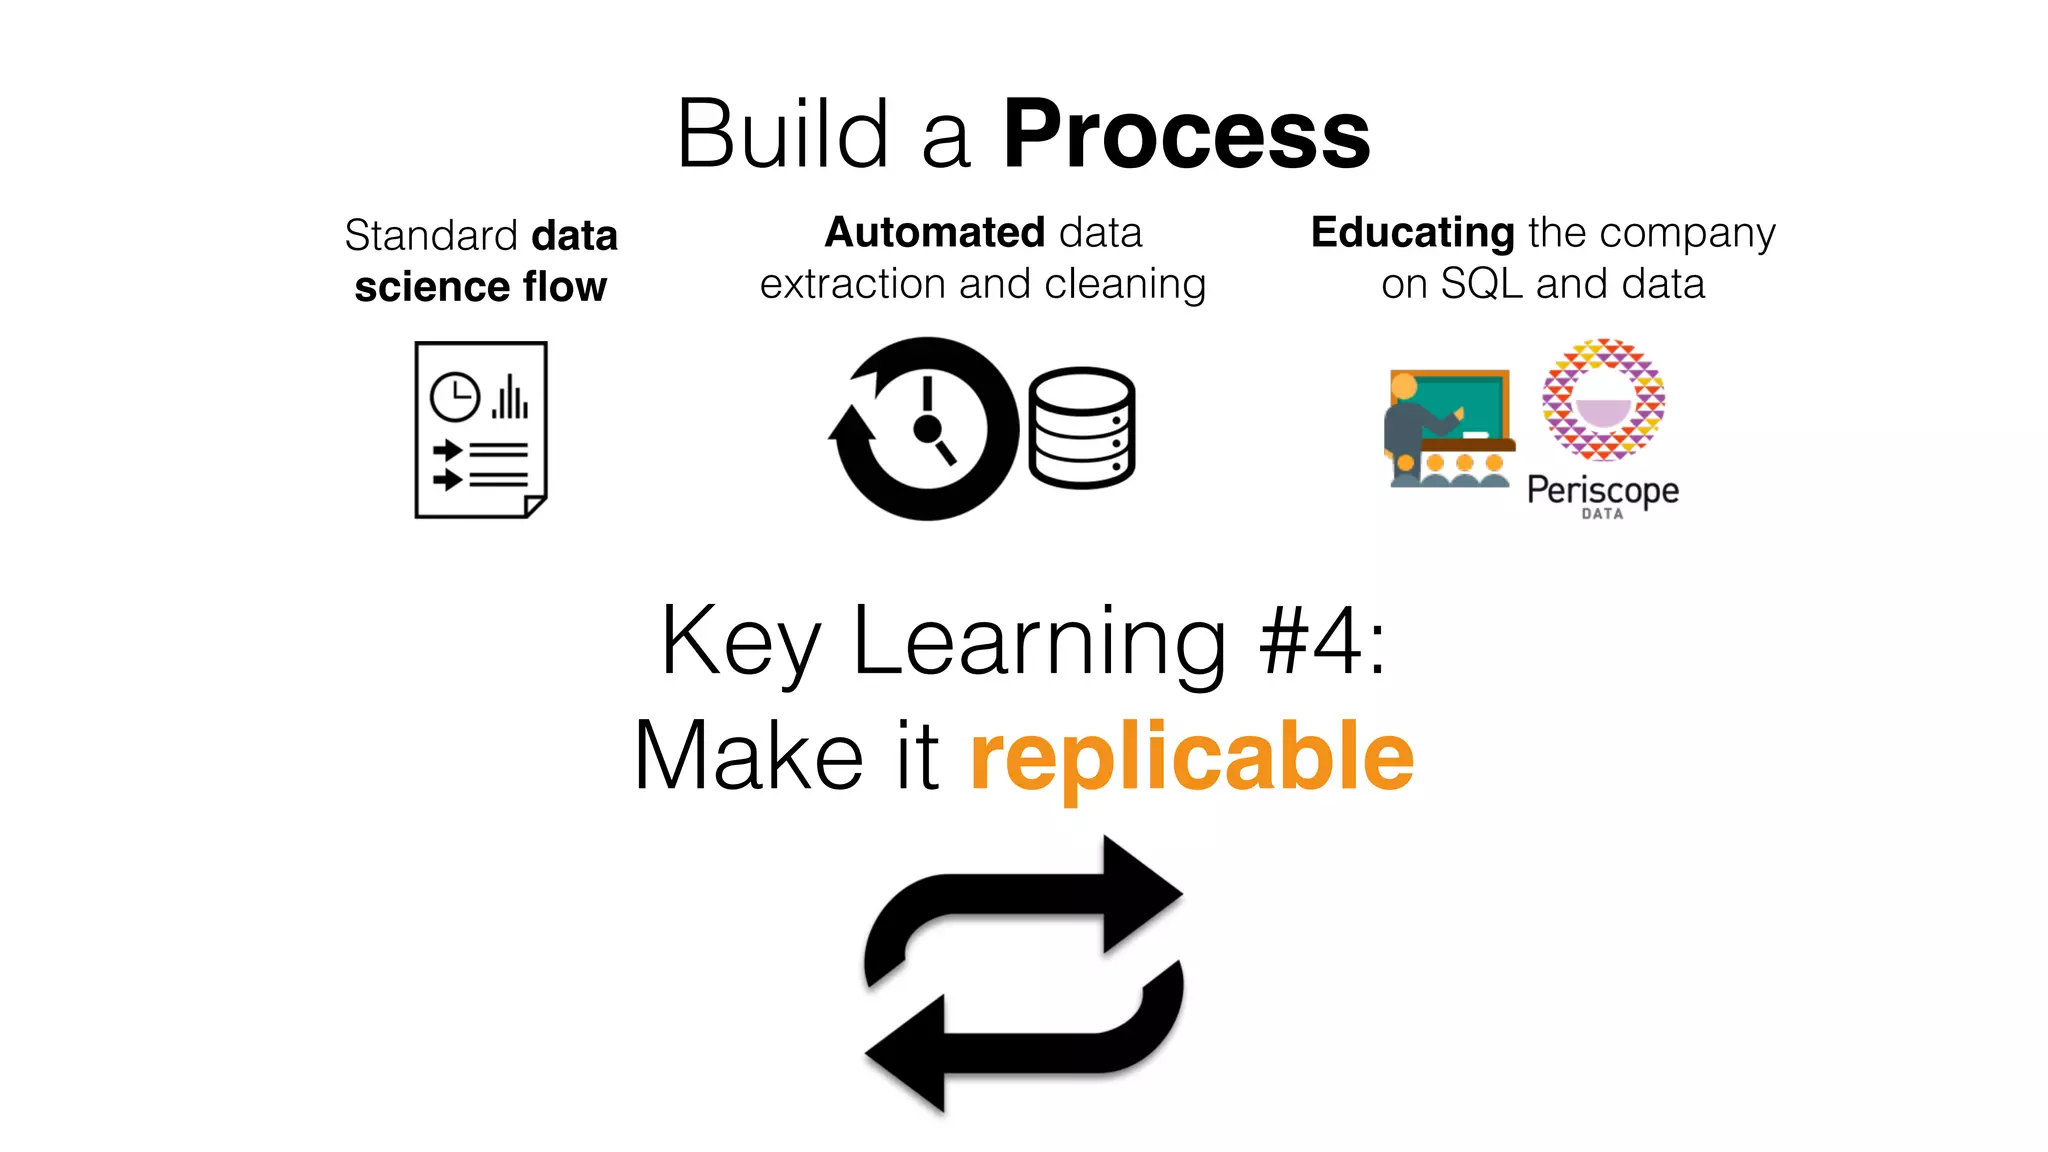
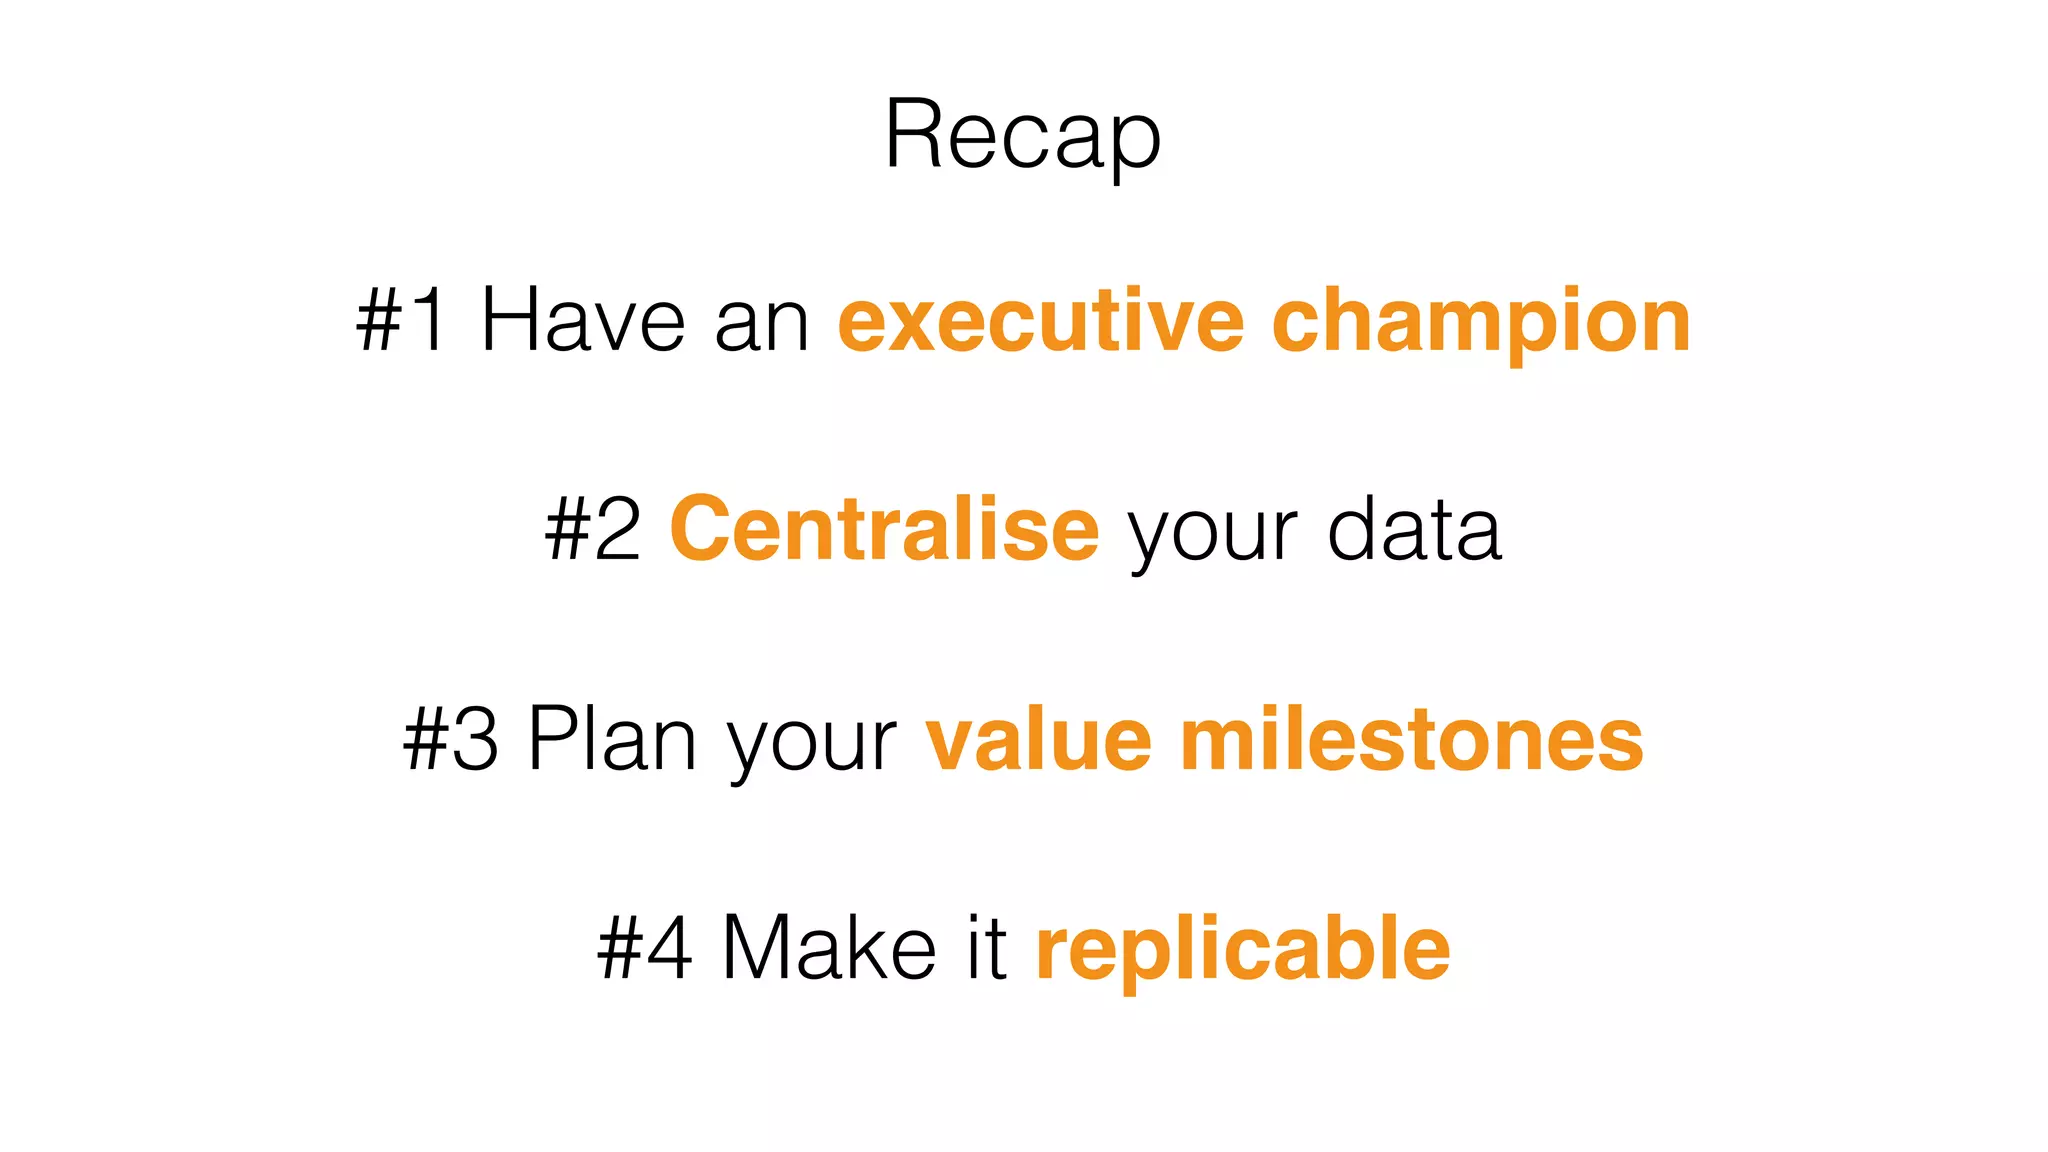
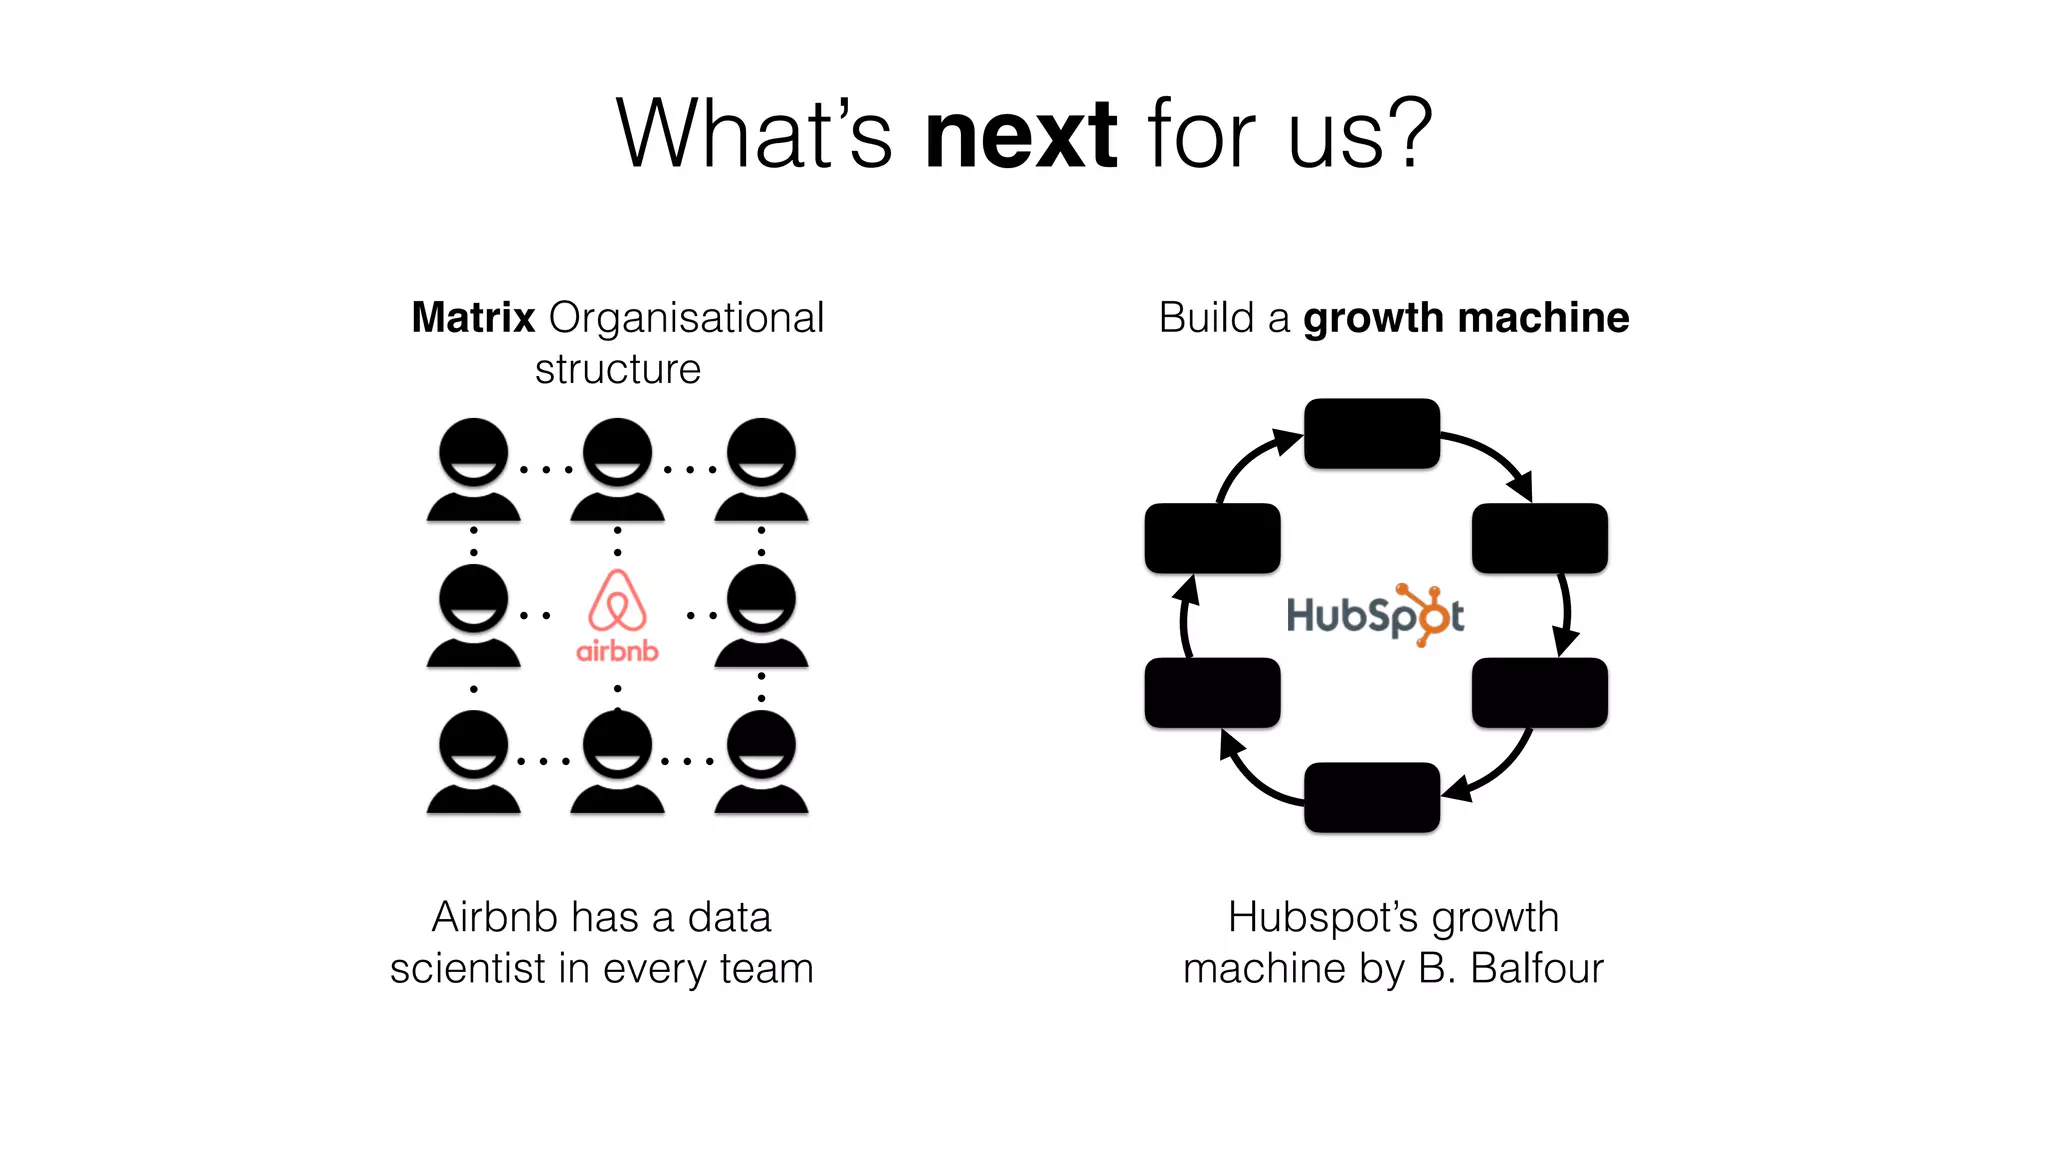
The document discusses building a data-driven culture, emphasizing the need for centralized data and a systematic growth team approach. Key learnings include having an executive champion, centralizing data sources, planning value milestones, and ensuring processes are replicable. It highlights the importance of data in decision-making and mentions examples from companies like HubSpot and Airbnb.


![[DSC Europe 25] Vladimir Jelic - The AI-Driven Security Shift From Reactive D...](https://cdn.slidesharecdn.com/ss_thumbnails/6g5gj25mtjwayniqem1t-6-251209104645-7a5a5fc6-thumbnail.jpg?width=640&height=640&fit=bounds)

![[DSC Europe 25] Hans Kleinsman - The Compliance Gearbox: How Tax Tech Mediate...](https://cdn.slidesharecdn.com/ss_thumbnails/dxdytie1toel0hr90bjs-2-251212103250-174fdbe7-thumbnail.jpg?width=640&height=640&fit=bounds)


![[DSC Europe 25] Behzad Hosseini - AI Agents in the Wild: Deploying Models tha...](https://cdn.slidesharecdn.com/ss_thumbnails/3qtejajvsjqrzwfept2c-10-251212103250-7f2b1068-thumbnail.jpg?width=640&height=640&fit=bounds)
![[DSC Europe 25] Dragana Ilic - AI for Big Data in Astronomy.pptx](https://cdn.slidesharecdn.com/ss_thumbnails/8palya86qaatvjhva1ms-2-dragana-ilic-ai-ilic-251208151906-652b819c-thumbnail.jpg?width=640&height=640&fit=bounds)


![[DSC Europe 25] Branko Dzakula - From Defense to Attack: How AI Redefines Cyb...](https://cdn.slidesharecdn.com/ss_thumbnails/80bdzdxpr3ky2g0qvyk9-8-251211083048-ce5fc1ee-thumbnail.jpg?width=640&height=640&fit=bounds)


![[DSC Europe 25] Milan Sekuloski - Data, Defence, and Development: Cybersecuri...](https://cdn.slidesharecdn.com/ss_thumbnails/dfrkwwx4qly6atqpbl4z-4-251209104645-c3d4b0ca-thumbnail.jpg?width=640&height=640&fit=bounds)
![[DSC Europe 25] Dunja Adzic Jovanovic - AI and Cybersecurity: Defending Data ...](https://cdn.slidesharecdn.com/ss_thumbnails/o1zylpbhrtwnixxq2xj8-7-251211083048-185086f6-thumbnail.jpg?width=640&height=640&fit=bounds)
![[DSC Europe 25] Katherine Forrest - AI NOW: Understanding the Velocity of Cha...](https://cdn.slidesharecdn.com/ss_thumbnails/wvvbruqfrci0sfq9xwgb-4-251212104007-e5ad1987-thumbnail.jpg?width=640&height=640&fit=bounds)

![[DSC Europe 25] Dobrica Cosic - Savings by the Second: How Dynamic Pricing an...](https://cdn.slidesharecdn.com/ss_thumbnails/znp09f3smtqz3w2sq6wn-1-dobrica-cosic-savings-by-the-second-how-dynamic-pricing-and-smart-data-are-bu-251208151905-26e6f41e-thumbnail.jpg?width=640&height=640&fit=bounds)