The document summarizes the High-Altitude MMIC Sounding Radiometer (HAMSR) instrument. HAMSR is a 25 channel microwave sounder developed by JPL to measure atmospheric temperature and water vapor from high-altitude aircraft. It was upgraded under the NASA AITT program in 2008 to deploy on the Global Hawk aircraft and provide real-time data and imagery. The upgrades improved HAMSR's radiometric performance, enabling it to observe smaller-scale water vapor features and process data onboard to display brightness temperature imagery within 5 minutes of acquisition. During field campaigns, HAMSR data was used by scientists to track hurricanes and adjust flight paths in real-time.
![High-Altitude MMIC Sounding Radiometer - From the IIP to the Global
Hawk
Shannon Brown, Richard Denning, Bjorn Lambrigtsen, Boon Lim, Jordan Tanabe, Alan Tanner, Pekka
Kangaslahti, Todd Gaier
Jet Propulsion Laboratory, California Institute of Technology, Pasadena, CA
ABSTRACT
The HAMSR instrument is a 25 channel cross-track
microwave sounder developed by the Jet Propulsion
Laboratory under the IIP-98 program. The instrument was
recently upgraded under the NASA AITT program in 2008
to deploy on the Global Hawk UAV. The instrument now
has state-of-the-art radiometric performance and the
capability to process and display both brightness
temperature imagery and derived products in real time. The
improved performance of the instrument is demonstrated
through retrievals of temperature and water vapor.
1. INTRODUCTION
This paper describes the JPL High Altitude MMIC
Sounding Radiometer (HAMSR) and presents the instrument
performance through two recent field campaigns on the
Global Hawk UAV. HAMSR is a 25 channel cross-track
scanning microwave sounder with channels near the 60 and
118 GHz oxygen lines and the 183 GHz water vapor line.
HAMSR owes its current state-of-the art performance to
three ESTO programs, the IIP, ACT and AITT. HAMSR
was originally designed and built at the Jet Propulsion
Laboratory through the first NASA Instrument Incubator call
in 1998 [1]. Subsequent to this, HAMSR participated in
three NASA hurricane field campaigns, CAMEX-4, TCSP
and NAMMA. Beginning in 2008, HAMSR was extensively
upgraded under the first NASA Airborne Instrument
Technology Transfer (AITT) program to deploy on the
NASA Global Hawk (GH) platform and serve as an asset to
the NASA sub-orbital program. One of the major upgrades
was the addition of a front-end LNA, developed by JPL
through the MIMRAM Advanced Component Technology
(ACT) project, to the 183 GHz channel which reduces the
noise in this channel to less than 0.1K at the sensor
resolution (~2km) and enabling HAMSR to observe much
smaller scale water vapor features. The 118 GHz receiver
was also upgraded using the state-of-the-art ACT developed
LNA, lowering the noise figure of this receiver significantly.
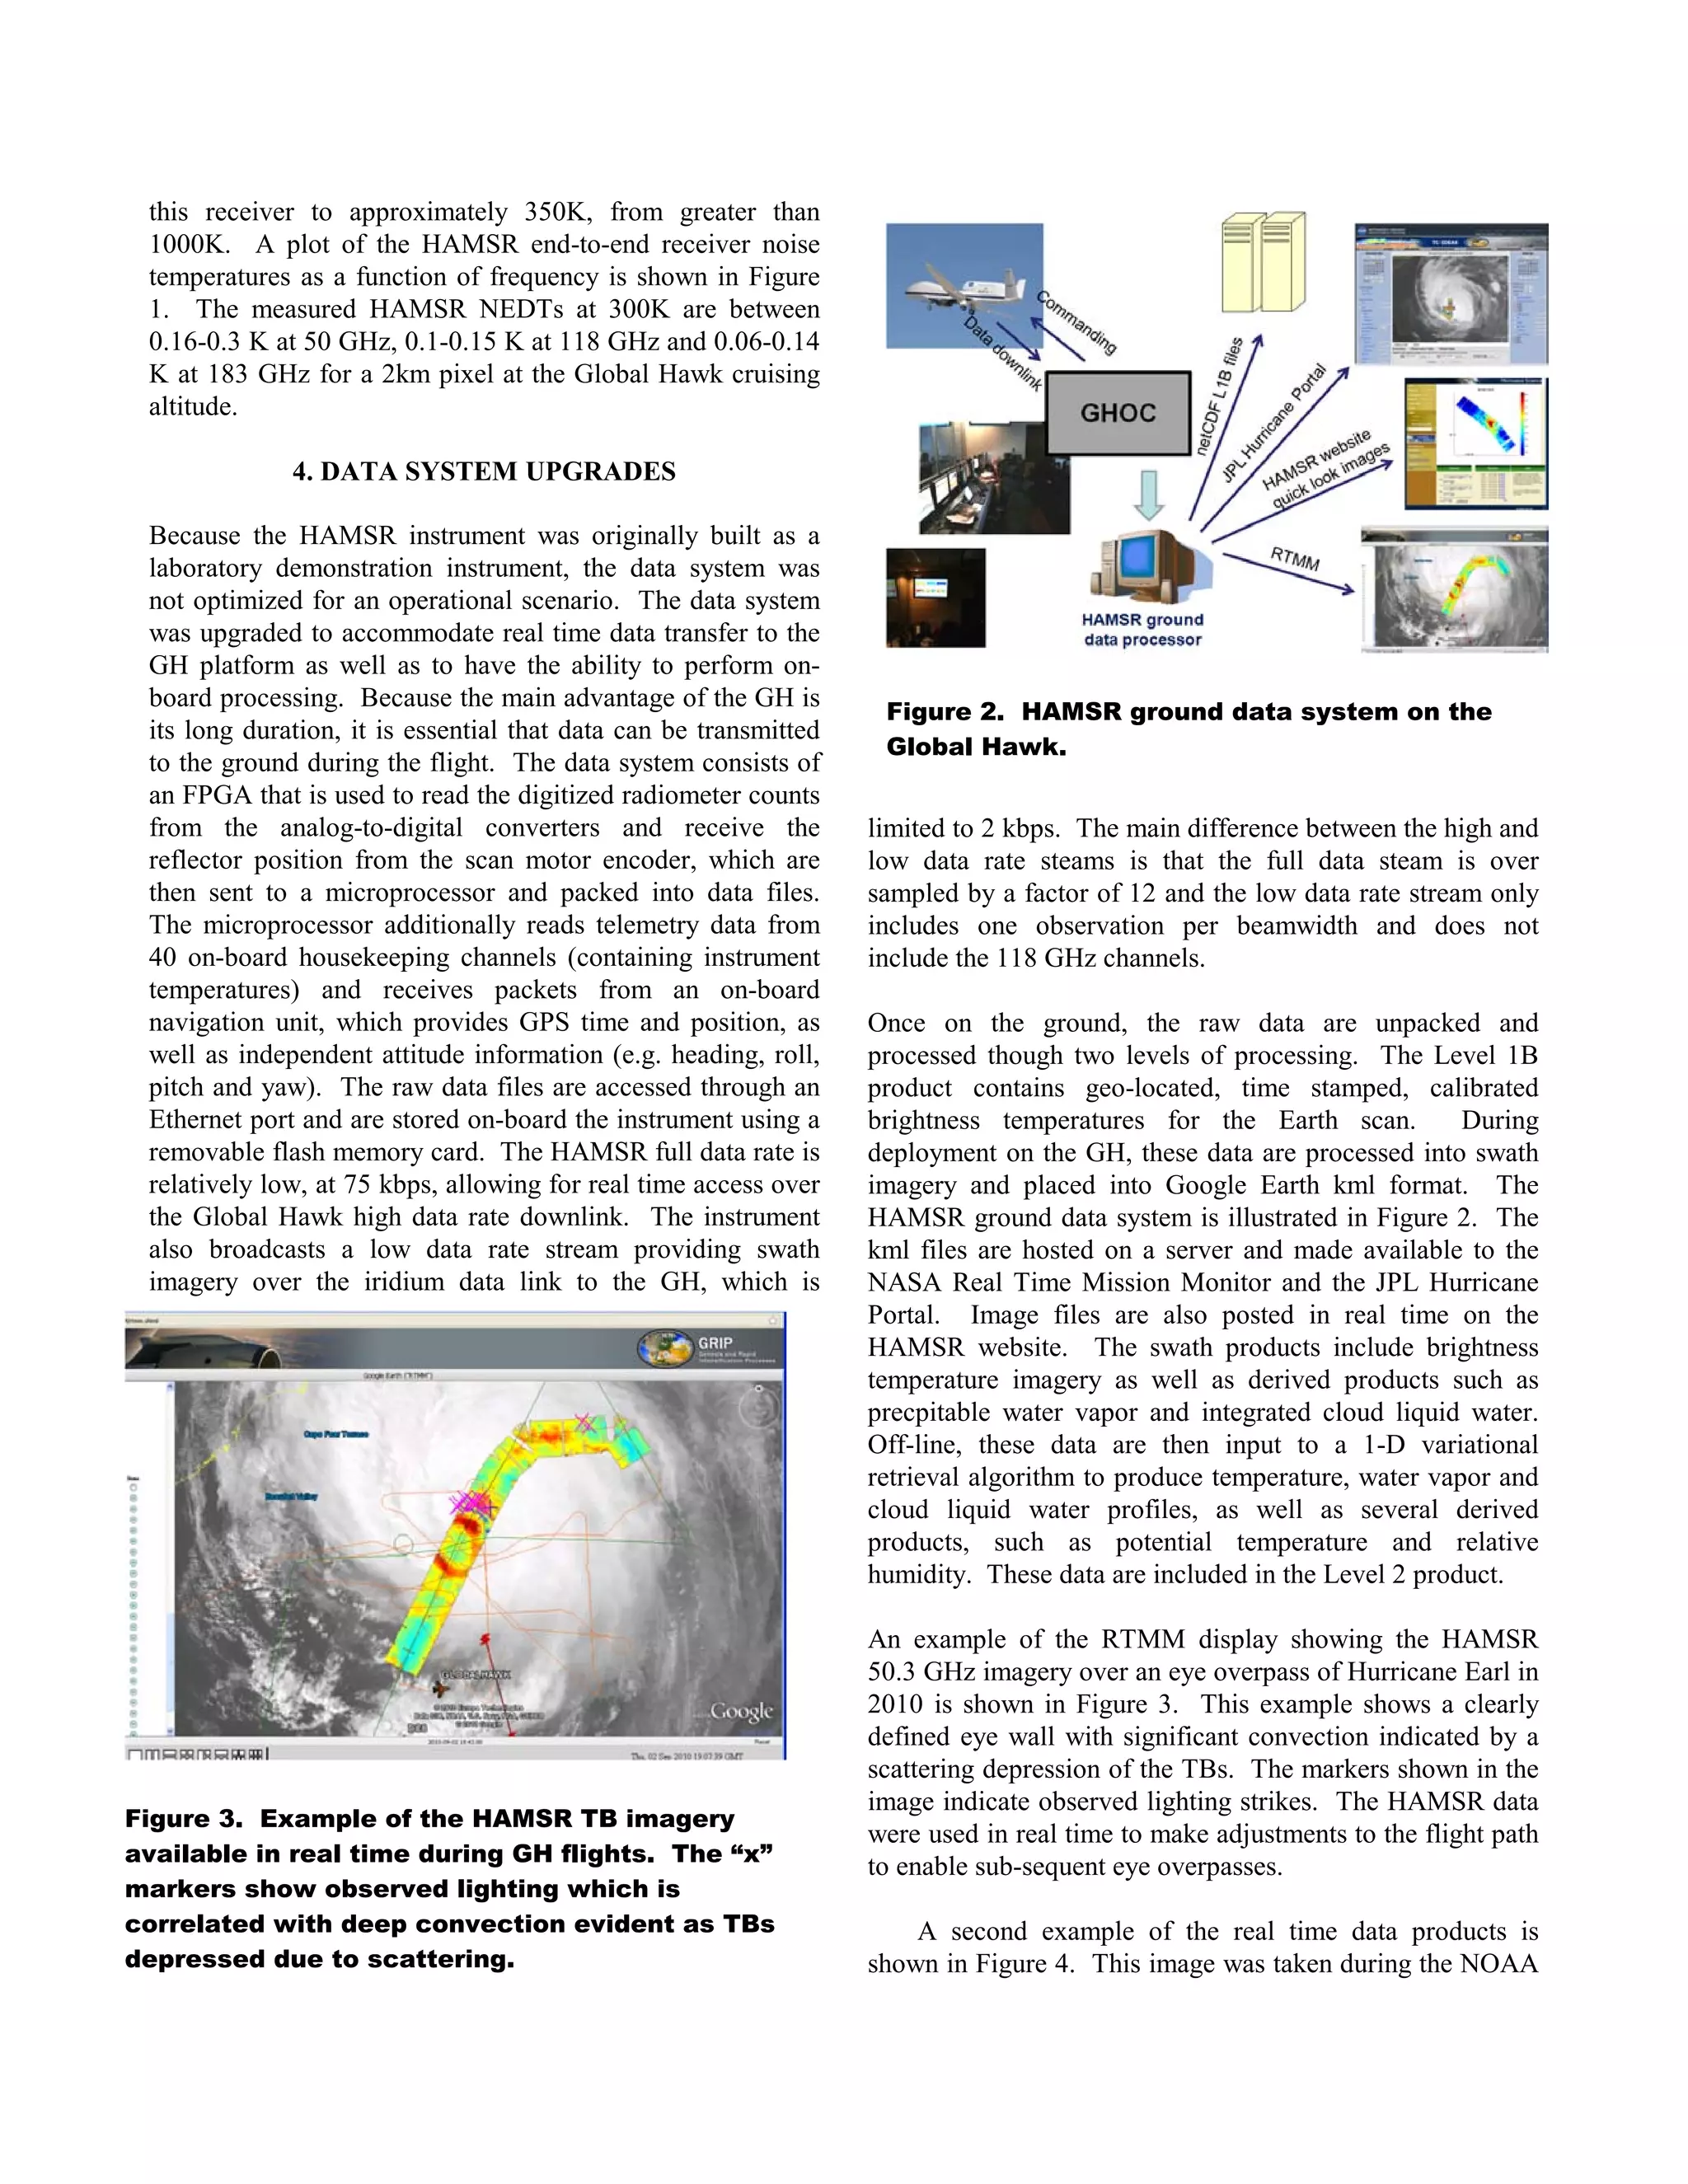
Another major upgrade was an enhanced data system that
provides on-board science processing capability and real-
time data access. During the 2010 GRIP hurricane field
campaign, this capability was exploited with HAMSR image
products displayed within 5 minutes of acquisition in the
Google Earth based Real Time Mission Monitor (RTMM)
system operated by NASA Marshall. HAMSR data were
used in real time by the Global Hawk platform scientists to
identify the tropical cyclone circulation center and made
adjustments the flight path in real time. Because of this, the
Global Hawk was able to pass directly over the eye of
Hurricane Karl an unprecedented 20 times as it transitioned
from a tropical cyclone to a strong category 3 hurricane.
2. INSTRUMENT DESCRIPTION
A complete description of the HAMSR instrument is found
in [2] and is summarized here. HAMSR scans cross track
below the airplane and has a + 60o
field of view. The scan
system consists of two reflectors mechanically connected to
a common scanning mechanism with both beams pointing
along the same boresight direction. One reflector is a flat
mirror for 118 and 183 GHz and the other is a parabolic
mirror for 55 GHz. The size of the beam at each band is 5.7°
(HPFW), and the sidelobes for all beams are well below 30
dB with a beam efficiency of >95%, providing minimal
footprint contamination. The polarization of the beams
rotates as the reflectors scan, with pure V-pol at nadir. A
table of the HAMSR passband characteristics including
center frequency, bandwidth and side-band weighting ratios
are shown in Table 1.
Each reflector scans across two calibration targets
during each scan. One target is at the ambient air
temperature (about -10C at altitude) and the other is heated
to about 70o
C. The reflectivity of the targets has been
designed to be less than -50 dB. The temperature of each
target is measured with four temperature sensors. The
targets are constructed of heavy aluminum and are insulated
to keep gradients across them to less that 0.25 K. The
integration time on each target is about 10 times the
integration time for the atmospheric measurements. The](https://image.slidesharecdn.com/b4000c20-ec64-4024-8306-2cbb8a7e1520-150617051826-lva1-app6892/75/Brown_ESTF2011-1-2048.jpg)
![absolute accuracy of the HAMSR TBs has been
demonstrated in flight to be better than 1.5 K using
dropsonde and radiosonde comparisons.
The HAMSR instrument was originally developed
through the first IIP in 1998. Subsequent to the completion
of the instrument under the IIP, HAMSR was prepared to
participate in the CAMEX-4 field campaign in 2001 on the
ER-2. It was then later flown in the TCSP campaign in 2005
again on the ER-2 and in the NAMMA campaign in 2006 on
the DC-8. Because the instrument was originally developed
as a technology demonstration instrument, it lacked the
robustness that is needed for an operational airborne
instrument. Starting in 2008, HAMSR was extensively
upgraded under the ESTO AITT program with the
objectives to bring the instrument to the current state-of-the-
art and improve the reliability of the system so that it may
serve as an operational asset to the NASA sub-orbital
science program.
The major upgrades under the AITT program include the
addition of a state-of-the-art low noise amplifier (LNA) to
the 183 GHz receiver, an upgrade to the 118 GHz LNA, an
upgraded data system capable of on-board science
processing and a re-designed instrument packaging concept
to consolidate the power, data, thermal and receiver sub-
systems into one compact housing for deployment on the
NASA Global Hawk Unmanned Aerial System (UAS).
3. RECIEVER SYSTEM UPGRADES
The HAMSR 183 GHz receiver sub-system takes
advantage of the state-of-the-art high frequency LNA
development projects at JPL. The 130-220 GHz LNAs
developed under the NASA ESTO MIMRAM program have
demonstrated excellent performance both in terms of low
noise figure and high gain [3]. The old HAMSR 183 GHz
channel had a mixer front end and a very high receiver noise
temperature, on the order of 6000K. The MIMRAM LNA
was added to the system just after the feed horn. A side
band reject filter was added between the LNA and the mixer
to reject the upper-side band. Adequately rejecting the
upper sideband image is most important for the 166 GHz
window channel and matters less for the channels closer to
the line center. The upper sideband rejection ratio is greater
than 20dB for the image of the 166 GHz channel.
The 118 GHz receiver system was also upgraded with a
current generation LNA developed under the same
MIMRAM program, reducing the LNA noise temperature in
Figure 1. Measured receiver noise temperature
as a function of frequency for the HAMSR
channels.
Channel
fc – LSB
[GHz]
BW –
LSB
[MHz]
W1
fc – USB
[GHz]
BW –
USB
[MHz]
W2
1 50.30 185.34 - - - -
2 51.81 456.26 - - - -
3 52.82 444.60 - - - -
4 53.46 151.29 0.58 53.69 155.73 0.42
5 54.41 446.50 - - - -
6 54.94 442.91 - - - -
7 55.46 374.80 - - - -
8 55.99 279.05 0.90 56.61 235.84 0.10
9 113.27 1062.11 - - - -
10 115.19 1060.03 - - - -
11 116.18 506.09 - - - -
12 116.70 504.33 - - - -
13 117.13 432.13 - - - -
14 117.54 418.95 - - - -
15 117.93 459.60 0.54 119.56 424.56 0.46
16 118.30 319.84 0.54 119.19 302.38 0.46
17 118.50 117.19 0.47 118.98 140.74 0.53
18 118.61 100.86 0.42 118.86 105.95 0.58
19 166.95 3812.82 - - - -
20 173.22 3298.97 0.54 192.88 2926.96 0.46
21 176.26 2409.16 0.34 190.23 2472.45 0.66
22 178.74 2133.24 0.23 187.95 2162.90 0.77
23 180.39 1093.10 0.29 186.32 1119.17 0.71
24 181.44 1157.75 0.36 185.09 1109.80 0.64
25 182.30 536.28 0.27 184.31 539.22 0.73
Table 1. HAMSR passband characteristics.](https://image.slidesharecdn.com/b4000c20-ec64-4024-8306-2cbb8a7e1520-150617051826-lva1-app6892/75/Brown_ESTF2011-2-2048.jpg)
![Figure 4. Image of the Real Time Mission Monitor
display showing an atmospheric river transect
during WISPAR. The image on the right shows
HAMSR derived PWV over the transect. The strip
chart in the upper right shows the nadir trace of
PWV and CLW. The bottom right image shows the
aircraft track and AMSU PWV imagery. These
data were transmitted over the low-bandwidth
iridium link.
Winter Storms and Atmospheric Rivers Campaign
(WISPAR). An objective of this campaign was to study
atmospheric water vapor rivers. HAMSR precipitable water
vapor data were used in real time during this campaign to
locate the boundaries of the atmospheric river to time the
release of dropsondes, which were the main payload on this
mission.
5. HAMSR OBSERVATIONS ENABLED BY THE
NEW TECHNOLOGY
5.1. Upward looking water vapor retrievals
Several observations were conducted to demonstrate the
measurements enabled by the new receiver technology. The
first was a roof-top upward looking sky scan measurement.
A simple statistical linear regression algorithm was used to
derive precipitable water vapor from the HAMSR TBs.
Windowing this data in time reveal very small scale water
vapor structures passing over the instrument field of view.
Figure 5 shows an image of 15 minutes of sky scans
revealing PWV structures on the order of a few tenths of a
mm over spatial scales of less than 1km. A power spectrum
of the PWV time series is shown in Figure 6, demonstrating
that the new system is able to resolve water vapor variability
on time scales of seconds. The equivalent noise for the old
system was added to the data to illustrate the improvement
offered by the new LNAs. This is also shown in Figure 6,
showing that the old system was not capable of resolving
variability on time scales less than about 5 minutes.
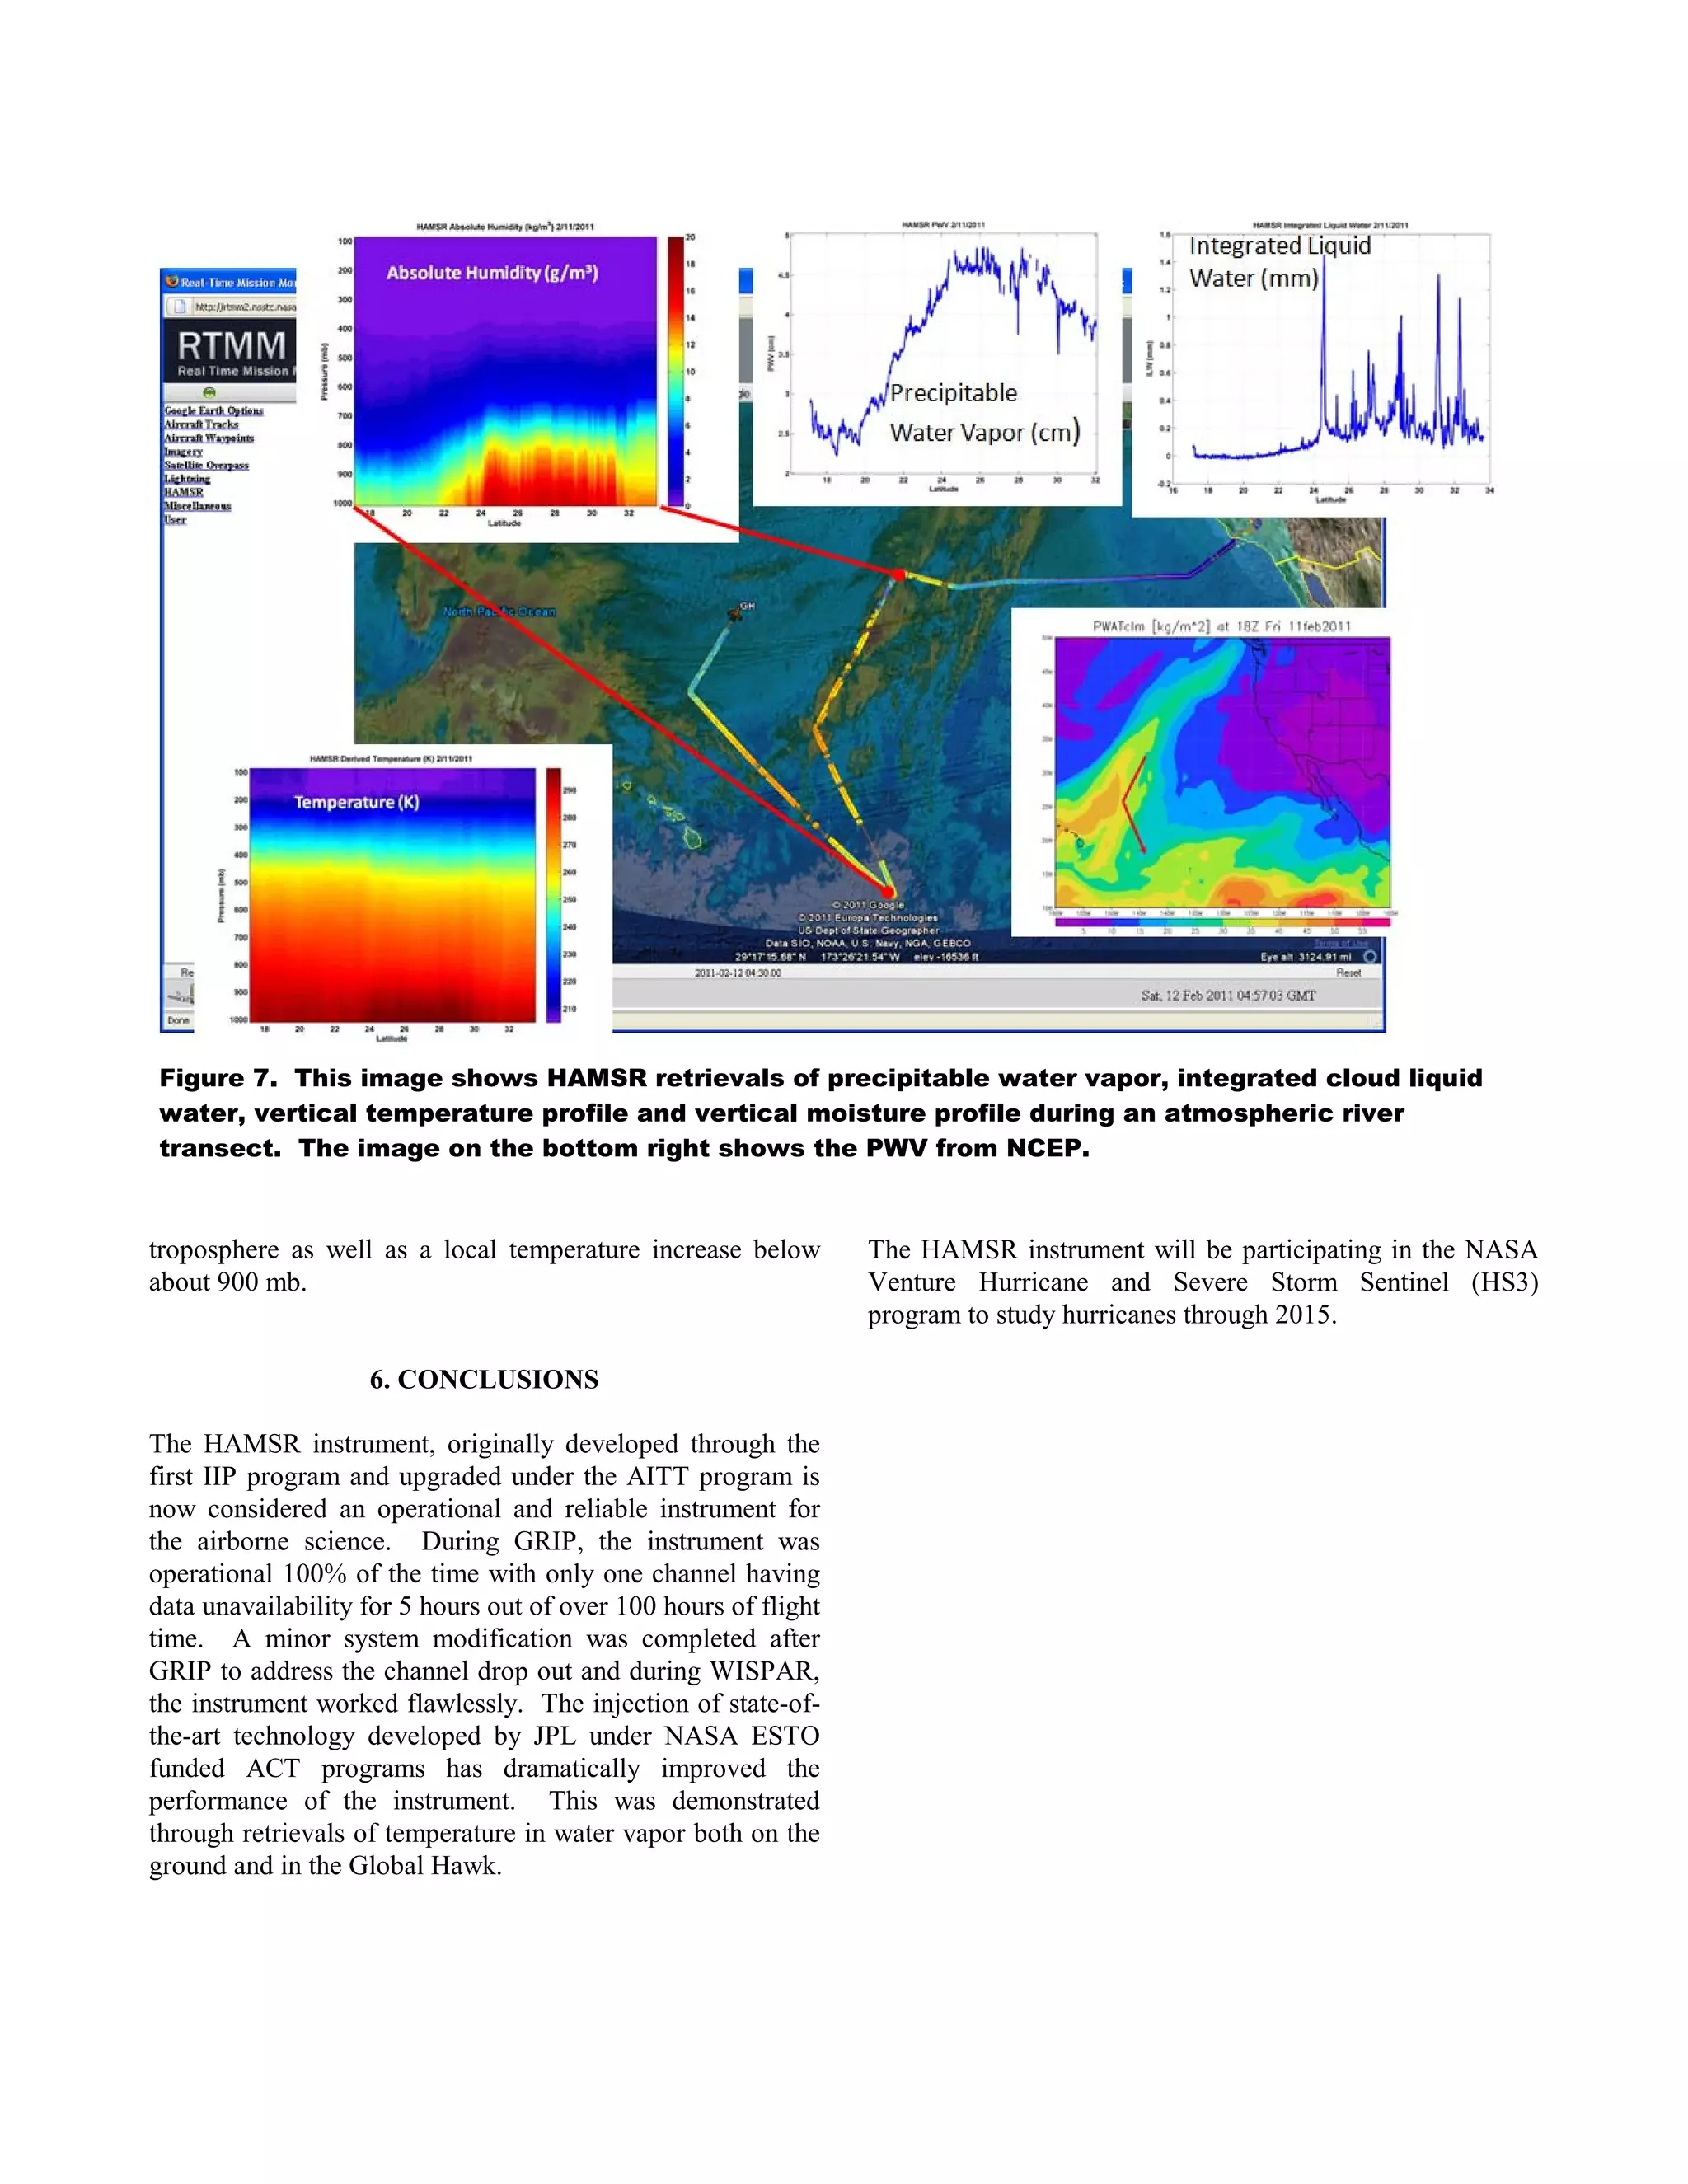
5.2. Temperature and Water Vapor Profiles from the
Global Hawk
In February and March 2011, HAMSR participated in the
WISPAR campaign on the Global Hawk to study winter
storms and atmospheric rivers in the Pacific Ocean. The
improved system performance enabled high quality
retrievals of vertical temperature and water vapor profiles
using the retrieval algorithm described in [4]. An example
of the retrievals for an atmospheric river transect are shown
in Figure 7. The atmospheric river is characterized by a
marked increase in water vapor through the lower
Figure 5. Image of PWV in mm over JPL in
Pasadena CA in February 2010. The data show
small scale structures in PWV passing over the
instrument.
Figure 6. Power spectrum of the HAMSR
derived PWV demonstrating that the new
system is capable of resolving water vapor
variability on time scales of seconds.](https://image.slidesharecdn.com/b4000c20-ec64-4024-8306-2cbb8a7e1520-150617051826-lva1-app6892/75/Brown_ESTF2011-4-2048.jpg)
![11. REFERENCES
[1] Lambrigtsen, B. and L. Riley "HAMSR - The High Altitude
MMIC Sounding Radiometer," ESTO report, JPL-document
http://hdl.handle.net/2014/40692
[2] Brown, S. T.; Lambrigtsen, B.; Denning, R. F.; Gaier, T.;
Kangaslahti, P.; Lim, B. H.; Tanabe, J. M.; Tanner, A. B.; , "The
High-Altitude MMIC Sounding Radiometer for the Global Hawk
Unmanned Aerial Vehicle: Instrument Description and
Performance," IEEE Transactions on Geoscience and Remote
Sensing, in press; doi: 10.1109/TGRS.2011.2125973
[3] Kangaslahti, P., Pukala, D., Gaier, T., Deal, W., Mei, X. B. and
Lai, R. “Low Noise Amplifier for 180 GHz Band” IEEE
International Microwave Symposium, June 2008, pp. 451-454
[4] Brown, S. Lambrigtsen, B. Tanner, A. Oswald, J. Dawson, D.
Denning, R., “Observations of tropical cyclones with a 60, 118 and
183 GHz microwave sounder,” IGARSS 2007, 23-28 July. pp.
3317-3320.](https://image.slidesharecdn.com/b4000c20-ec64-4024-8306-2cbb8a7e1520-150617051826-lva1-app6892/75/Brown_ESTF2011-6-2048.jpg)


