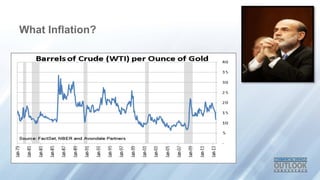
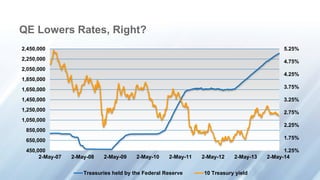
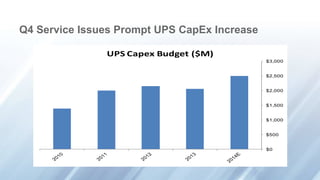
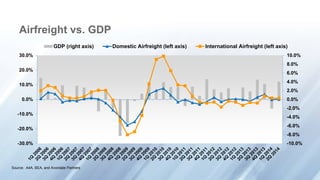
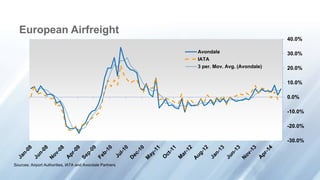
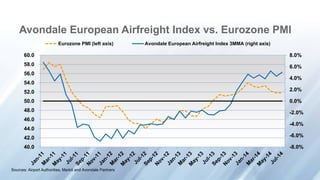
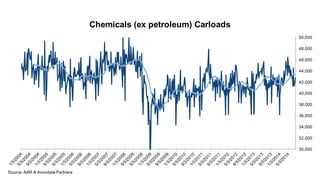
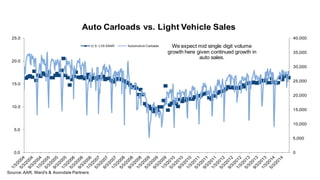
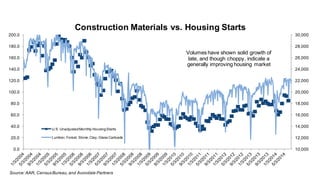
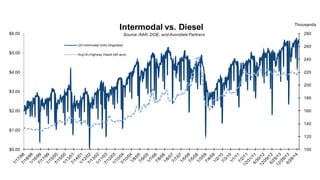
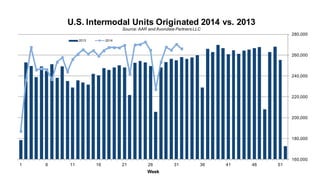
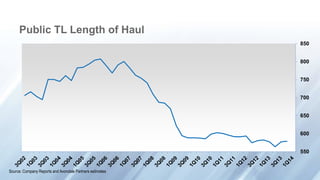
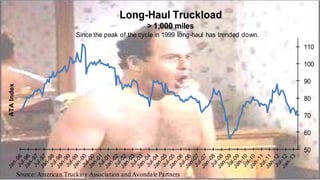
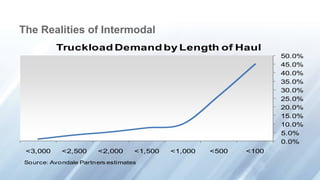
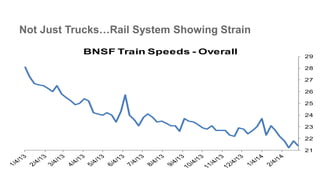
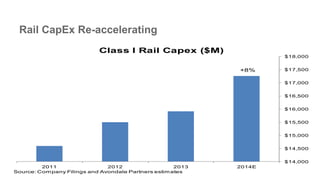
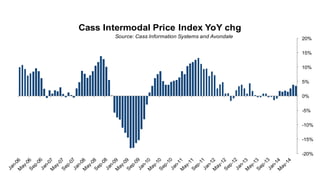
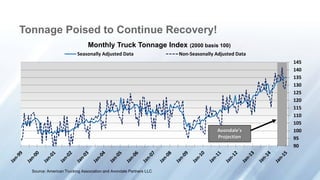
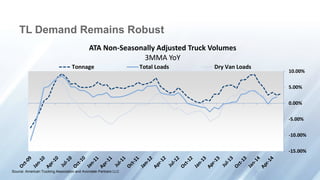
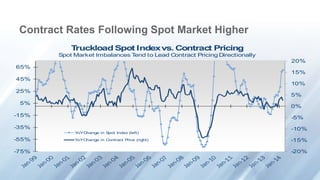
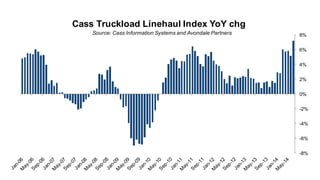
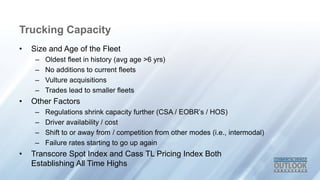
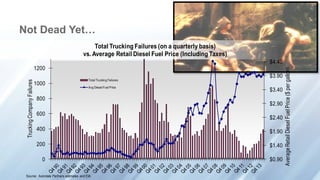
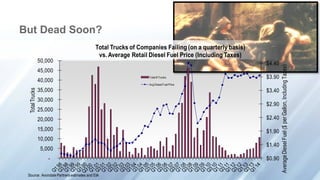
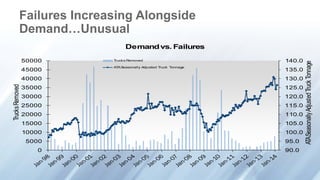
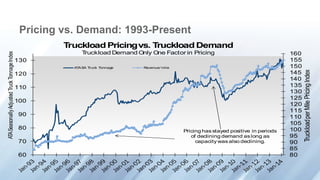
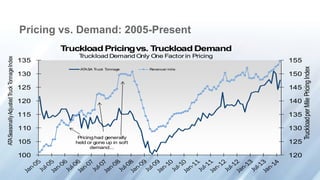
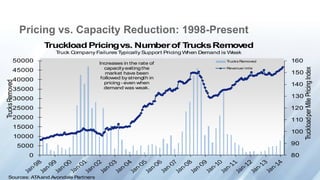
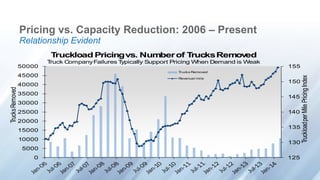
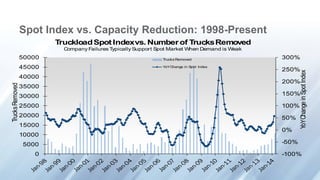
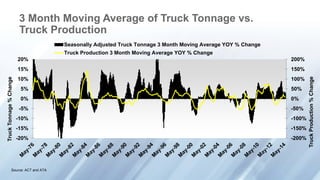
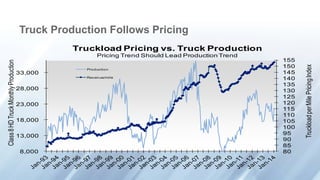
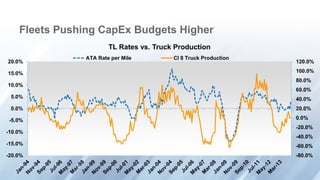
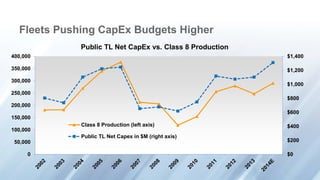
Donald Broughton
Avondale Partners
Senior Transportation Analyst, Managing Director, & Chief Market Strategist
What Inflation?
QE Lowers Rates, Right?
1.25%
1.75%
2.25%
2.75%
3.25%
3.75%
4.25%
4.75%
5.25%
450,000
650,000
850,000
1,050,000
1,250,000
1,450,000
1,650,000
1,850,000
2,050,000
2,250,000
2,450,000
2-May-07 2-May-08 2-May-09 2-May-10 2-May-11 2-May-12 2-May-13 2-May-14
Treasuries held by the Federal Reserve 10 Treasury yield
Trucking’s Economic Future
• Why does the Macro seem so bad?
• Tonnage tells a different story
– All modes showing varied degrees of acceleration / improvement
• Transportation Capacity
– Rail speeds slowing / increasing CapEx budgets to expand capacity
– Parcel struggling to meet e-commerce demand / increasing CapEx
– Trucking capacity tight / increasing CapEx & driver pay
• Trucking Capacity Specifically
In Tonnage We Trust
• Domestic Truck Tonnage growing at >3% and loads up 2%
• Airfreight was in contraction
– Now Domestic: +1.1%
– European: +5.6%
– Asia Pacific: +7.2%
• Rail Carloadings are up 5.0% overall
– Ex ag and coal: +7.7%
• Grain: +15.1%
• Coal: –3.2%
– Petroleum: +24.7%
• Intermodal is overall up 1.3%
– Stronger domestic intermodal despite service issues
– International container volume is rebounding
Q4 Service Issues Prompt UPS CapEx Increase
$0
$500
$1,000
$1,500
$2,000
$2,500
$3,000
UPS Capex Budget ($M)
-10.0%
-8.0%
-6.0%
-4.0%
-2.0%
0.0%
2.0%
4.0%
6.0%
8.0%
10.0%
-30.0%
-20.0%
-10.0%
0.0%
10.0%
20.0%
30.0%
GDP (right axis) Domestic Airfreight (left axis) International Airfreight (left axis)
Source: A4A, BEA, and Avondale Partners
Airfreight vs. GDP
-30.0%
-20.0%
-10.0%
0.0%
10.0%
20.0%
30.0%
40.0%
Avondale
IATA
3 per. Mov. Avg. (Avondale)
Sources: Airport Authorities, IATA and Avondale Partners
European Airfreight
-8.0%
-6.0%
-4.0%
-2.0%
0.0%
2.0%
4.0%
6.0%
8.0%
40.0
42.0
44.0
46.0
48.0
50.0
52.0
54.0
56.0
58.0
60.0
Eurozone PMI (left axis) Avondale European Airfreight Index 3MMA (right axis)
Sources: Airport Authorities, Markit and Avondale Partners
Avondale European Airfreight Index vs. Eurozone PMI
-40.0%
-30.0%
-20.0%
-10.0%
0.0%
10.0%
20.0%
30.0%
40.0%
50.0%
60.0%
Avondale IATA 3 per. Mov. Avg. (Avondale)
Sources: Airport Authorities, IATA and Avondale Partners
Asia Pacific Airfreight
-30.0%
-20.0%
-10.0%
0.0%
10.0%
20.0%
30.0%
Avondale APAC SIA APAC Semis Billings
Sources: Airport Authorities, SIA and Avondale Partners
Avondale APAC Airfreight vs.
SIA APAC Semiconductor Billings
-8.0%
-6.0%
-4.0%
-2.0%
0.0%
2.0%
4.0%
6.0%
8.0%
-20.0%
-15.0%
-10.0%
-5.0%
0.0%
5.0%
10.0%
15.0%
20.0%
GDP (right axis) Rail Carloads Ex Coal and Ag (left axis)
Source: American Association of Railroads, BEA, and Avondale Partners
Rail Carloads vs. GDP
180
200
220
240
260
280
300
320
340
360
Thousands
Total Carloads Originated
by Class I U.S. Railroads
Source:AAR and Avondale Partners LLC
-10.0%
-5.0%
0.0%
5.0%
10.0%
15.0%
Rail Carloads (ex coal, ag, and petroleum)
Two-year stacked
3WMA YoY
95,000
105,000
115,000
125,000
135,000
145,000
155,000
165,000
Coal Carloads
We believe coal will post YoY growth through the balance
of 2014 as utilities move to re-stock inventories run down
by the cold winter. That said, the cool summer to date has
made the 2015 outlook more uncertain.
Source:AAR & Avondale Partners
38,000
43,000
48,000
53,000
58,000
63,000
68,000
73,000
Chemical Carload Volume
Source:AAR and Avondale Partners
8,000
10,000
12,000
14,000
16,000
18,000
20,000
22,000
24,000
26,000
5,000,000
10,000,000
15,000,000
20,000,000
25,000,000
30,000,000
35,000,000
Petroleum Carloads vs. North Dakota Oil Production
North Dakota Oil Production Petroleum Carloads
30,000
32,000
34,000
36,000
38,000
40,000
42,000
44,000
46,000
48,000
50,000
Chemicals (ex petroleum) Carloads
Source:AAR & Avondale Partners
0
5,000
10,000
15,000
20,000
25,000
30,000
35,000
40,000
0.0
5.0
10.0
15.0
20.0
25.0
Auto Carloads vs. Light Vehicle Sales
U.S. LVS SAAR Automotive Carloads We expect mid single digit volume
growth here given continued growth in
auto sales.
Source:AAR, Ward's & Avondale Partners
10,000
12,000
14,000
16,000
18,000
20,000
22,000
24,000
26,000
28,000
30,000
0.0
20.0
40.0
60.0
80.0
100.0
120.0
140.0
160.0
180.0
200.0
Construction Materials vs. Housing Starts
U.S. UnadjustedMonthly HousingStarts
Lumber, Forest, Stone,Clay, Glass Carloads
Volumes have shown solid growth of
late, and though choppy, indicate a
generally improving housing market
Source:AAR, CensusBureau,and Avondale Partners
$0.00
$1.00
$2.00
$3.00
$4.00
$5.00
$6.00
100
120
140
160
180
200
220
240
260
280
Thousands
Intermodal vs. Diesel
US Intermodal Units Originated
Avg On-Highway Diesel (left axis)
Source:AAR, DOE, and Avondale Partners
160,000
180,000
200,000
220,000
240,000
260,000
280,000
1 6 11 16 21 26 31 36 41 46 51
Week
U.S. Intermodal Units Originated 2014 vs. 2013
2013 2014
Source:AAR and Avondale Partners LLC
550
600
650
700
750
800
850
Source: Company Reports and Avondale Partners estimates
Public TL Length of Haul
50
60
70
80
90
100
110
ATAIndex
Long-Haul Truckload
> 1,000 miles
Since the peak of the cycle in 1999 long-haul has trended down.
Source: American Trucking Association and Avondale Partners
The Realities of Intermodal
0.0%
5.0%
10.0%
15.0%
20.0%
25.0%
30.0%
35.0%
40.0%
45.0%
50.0%
<3,000 <2,500 <2,000 <1,500 <1,000 <500 <100
Truckload Demand by Length of Haul
Source: Avondale Partners estimates
Not Just Trucks…Rail System Showing Strain
21
22
23
24
25
26
27
28
29
BNSF Train Speeds - Overall
Rail CapEx Re-accelerating
$14,000
$14,500
$15,000
$15,500
$16,000
$16,500
$17,000
$17,500
$18,000
2011 2012 2013 2014E
Class I Rail Capex ($M)
Source: Company Filings and Avondale Partners estimates
+8%
-20%
-15%
-10%
-5%
0%
5%
10%
15%
20%
Cass Intermodal Price Index YoY chg
Source: Cass Information Systems and Avondale
Tonnage Poised to Continue Recovery!
90
95
100
105
110
115
120
125
130
135
140
145
Monthly Truck Tonnage Index (2000 basis 100)
Seasonally Adjusted Data Non-Seasonally Adjusted Data
Source: American Trucking Association and Avondale Partners LLC
Avondale's
Projection
TL Demand Remains Robust
-15.00%
-10.00%
-5.00%
0.00%
5.00%
10.00%
ATA Non-Seasonally Adjusted Truck Volumes
3MMA YoY
Tonnage Total Loads Dry Van Loads
Source: American Trucking Association and Avondale Partners LLC
Contract Rates Following Spot Market Higher
-20%
-15%
-10%
-5%
0%
5%
10%
15%
20%
-75%
-55%
-35%
-15%
5%
25%
45%
65%
Truckload Spot Indexvs. Contract Pricing
Spot Market Imbalances Tend to Lead Contract Pricing Directionally
YoYChange in Spot Index (left)
YoYChange in Contract Price (right)
-8%
-6%
-4%
-2%
0%
2%
4%
6%
8%
Cass Truckload Linehaul Index YoY chg
Source: Cass Information Systems and Avondale Partners
Trucking Capacity
• Size and Age of the Fleet
– Oldest fleet in history (avg age >6 yrs)
– No additions to current fleets
– Vulture acquisitions
– Trades lead to smaller fleets
• Other Factors
– Regulations shrink capacity further (CSA / EOBR’s / HOS)
– Driver availability / cost
– Shift to or away from / competition from other modes (i.e., intermodal)
– Failure rates starting to go up again
• Transcore Spot Index and Cass TL Pricing Index Both
Establishing All Time Highs
80.0
82.0
84.0
86.0
88.0
90.0
92.0
94.0
96.0
98.0
100.0
Public TL Fleet Size
Relative to Peak
-3.0%
-2.0%
-1.0%
0.0%
1.0%
2.0%
3.0%
Miles Per Tractor During EOBR
Implementation
Source: Company filings and Avondale Partners estimates
Based on population of trucking companies
which have already gone through the EOBR
adoption process
Q1 is quarter in which we estimate at least
2/3 of fleet was outfitted with EOBRs
-10.0%
-8.0%
-6.0%
-4.0%
-2.0%
0.0%
2.0%
4.0%
6.0%
8.0%
10.0%
-4.0%
-3.0%
-2.0%
-1.0%
0.0%
1.0%
2.0%
3.0%
4.0%
TL Industry Per Mile Analysis
OR (ex fuel and gains) YoY
Change - left axis
Cost per company mile (ex
fuel) - right axis
Total rate per mile - right axis
Source: Company filings and Avondale Partners estimates
Not Dead Yet…
$0.90
$1.40
$1.90
$2.40
$2.90
$3.40
$3.90
$4.40
0
200
400
600
800
1000
1200
TruckingCompanyFailures
Total Trucking Failures (on a quarterly basis)
vs. Average Retail Diesel Fuel Price (Including Taxes)
Total Trucking Failures
Avg Diesel Fuel Price
Source: Avondale Partners estimates and EIA
AverageRetailDieselFuelPrice($pergallon)
But Dead Soon?
$0.90
$1.40
$1.90
$2.40
$2.90
$3.40
$3.90
$4.40
-
5,000
10,000
15,000
20,000
25,000
30,000
35,000
40,000
45,000
50,000
TotalTrucks
Total Trucks of Companies Failing (on a quarterly basis)
vs. Average Retail Diesel Fuel Price (Including Taxes)
Total # Trucks
Avg Diesel Fuel Price
`
Source: AvondalePartnersestimates and EIA
AverageDieselFuel($perGallon,IncludingTaxes)
Failures Increasing Alongside
Demand…Unusual
90.0
95.0
100.0
105.0
110.0
115.0
120.0
125.0
130.0
135.0
140.0
0
5000
10000
15000
20000
25000
30000
35000
40000
45000
50000
ATASeasonallyAdjustedTruckTonnage
TrucksRemoved
Demandvs. Failures
Trucks Removed
ATASeasonally Adjusted Truck Tonnage
80
85
90
95
100
105
110
115
120
125
130
135
140
145
150
155
160
60
70
80
90
100
110
120
130
TruckloadperMilePricingIndex
ATASeasonallyAdjustedTruckTonnageIndex
Truckload Pricingvs. Truckload Demand
Truckload Demand Only One Factor in Pricing
ATASA Truck Tonnage Revenue/ mile
Pricing has stayed positive in periods
of declining demand as long as
capacity was also declining.
Pricing vs. Demand: 1993-Present
120
125
130
135
140
145
150
155
100
105
110
115
120
125
130
135
TruckloadperMilePricingIndex
ATASeasonallyAdjustedTruckTonnageIndex
Truckload Pricingvs. Truckload Demand
Truckload Demand Only One Factor in Pricing
ATASA Truck Tonnage Revenue/ mile
Pricinghad generally
held or gone up in soft
demand...
Pricing vs. Demand: 2005-Present
80
90
100
110
120
130
140
150
160
0
5000
10000
15000
20000
25000
30000
35000
40000
45000
50000
TruckloadperMilePricingIndex
TrucksRemoved
Truckload Pricingvs. Numberof TrucksRemoved
Truck Company Failures Typically Support Pricing When Demand is Weak
Trucks Removed
Revenue/ mile
Increases in the rate of
capacityexitingthe
market have been
followed bystrength in
pricing- even when
demand was weak.
Sources: ATAand Avondale Partners
Pricing vs. Capacity Reduction: 1998-Present
125
130
135
140
145
150
155
0
5000
10000
15000
20000
25000
30000
35000
40000
45000
50000
TruckloadperMilePricingIndex
TrucksRemoved
Truckload Pricingvs. Numberof TrucksRemoved
Truck CompanyFailures Typically Support Pricing When Demand is Weak
Trucks Removed
Revenue/ mile
Pricing vs. Capacity Reduction: 2006 – Present
Relationship Evident
-100%
-50%
0%
50%
100%
150%
200%
250%
300%
0
5000
10000
15000
20000
25000
30000
35000
40000
45000
50000
YoYChangeinSpotIndex
TrucksRemoved
TruckloadSpot Indexvs. Numberof TrucksRemoved
Company Failures Typically Support Spot Market When Demand is Weak
Trucks Removed
YoYChange in Spot Index
Spot Index vs. Capacity Reduction: 1998-Present
-200%
-150%
-100%
-50%
0%
50%
100%
150%
200%
-20%
-15%
-10%
-5%
0%
5%
10%
15%
20%
TruckProduction%Change
TruckTonnage%Change
Seasonally Adjusted Truck Tonnage 3 Month Moving Average YOY % Change
Truck Production 3 Month Moving Average YOY % Change
Source: ACT and ATA
3 Month Moving Average of Truck Tonnage vs.
Truck Production
Truck Production Follows Pricing
80
85
90
95
100
105
110
115
120
125
130
135
140
145
150
155
8,000
13,000
18,000
23,000
28,000
33,000
TruckloadperMilePricingIndex
Class8HDTruckMonthlyProduction
Truckload Pricing vs. Truck Production
Pricing Trend Should Lead Production Trend
Production
Revenue/mile
Fleets Pushing CapEx Budgets Higher
-80.0%
-60.0%
-40.0%
-20.0%
0.0%
20.0%
40.0%
60.0%
80.0%
100.0%
120.0%
-20.0%
-15.0%
-10.0%
-5.0%
0.0%
5.0%
10.0%
15.0%
20.0%
TL Rates vs. Truck Production
ATA Rate per Mile Cl 8 Truck Production
Fleets Pushing CapEx Budgets Higher
$0
$200
$400
$600
$800
$1,000
$1,200
$1,400
0
50,000
100,000
150,000
200,000
250,000
300,000
350,000
400,000
Public TL Net CapEx vs. Class 8 Production
Class 8 Production (left axis)
Public TL Net Capex in $M (right axis)
Executive Summary
• Demand is accelerating, in all modes (Truck, Rail, Airfreight)
• Capacity is getting tighter, in all modes
(broadly in Truck, specific areas of Rail, Airfreight)
• Pricing power is surging, in all modes
(broadly in Truck, specific areas of Rail, Airfreight)
• CapEx budgets are being actively revised up, in all modes
“Predictions” for 2014 – 2016
• EOBR’s will have a big impact on capacity and an
even bigger impact on equipment visibility
• Driver market gets even tougher
• TL pricing power of 4 to 6++ %
• Consolidation in transportation poised to dramatically increase
• Hard, durable assets increasingly valuable

Broughton

Editor's Notes

  • #8 Source file: N:ResearchTransportsfreightvsgdp.xls Last update: 3/10/2014
  • #9 Source file: N:ResearchTransportsAirfreightAvondale IndicesAir Indices.xls Last update: 3/21/2014
  • #11 Source file: N:ResearchTransportsAirfreightAvondale IndicesAir Indices.xls Last update: 2/21/2014
  • #12 Source file: N:ResearchTransportsAirfreightAvondale IndicesAir Indices.xls Last update: 5/15/2014
  • #13 Source file: N:ResearchTransportsfreightvsgdp.xls Last update: 3/7/2014
  • #14 N:ResearchTransportsRAILClass I Stats2 – Carloads.xls Last update: 3/21/2014
  • #15 Source file: N:ResearchTransportsRAILClass I Stats2 – Commodity Volume.xls Last update: 3/21/2014
  • #17 Source file: N:ResearchTransportsRAILClass I Stats2 – Commodity Volume.xls Last update: 3/21/2014
  • #18 Source file: N:ResearchTransportsRAILClass I Stats2 – Commodity Volume.xls Last update: 3/21/2014
  • #19 Source file: N:ResearchTransportsRAILClass I Stats2 – Commodity Volume.xls Last update: 3/21/2014
  • #20 Source file: N:ResearchTransportsRAILClass I Stats2 – Commodity Volume.xls Last update: 3/21/2014
  • #21 Source file: N:ResearchTransportsRAILClass I Stats2 – Commodity Volume.xls Last update: 3/21/2014
  • #22 Source file: N:ResearchTransportsRAILClass I Stats2 – Commodity Volume.xls Last update: 3/21/2014
  • #25 N:ResearchTransportsTruckingIndustryATA-TonnageLoads Performance to present.xls Last update: 8/15/2011
  • #26 Cyclical shift has happened and will go back the other way.
  • #29 Source file: N:ResearchRyan BCoverageCASSz – Cass Intermodal Index.xls Last update: 8/18/2014
  • #30 Increase in volatility for trucking on a month-to-month basis has been due to JIT. Last update: 3/25/2014
  • #31 Transports>Trucking>Industry>1-ATA Index(“stacked” tab)
  • #32 Transports>Trucking>Industry>1-tkcapacityutil
  • #33 Source file: N:ResearchRyan BCoverageCASSz – Cass Truckload Index.xls Last update: 8/18/2014
  • #37 N:ResearchTransportsTruckingIndustry1-Cost per mile
  • #38 Fuel as a percentage of expenses. Source file: N:ResearchTransportsTruckingIndustryFailures.xls Last Update: 07/12/12
  • #39 Fuel as a percentage of expenses. Source file: N:ResearchTransportsTruckingIndustryFailures.xls Last Update: 07/12/12
  • #41 Source file: N:ResearchTransportsTruckingIndustry1-tkcapcityutil.xls Last update: 3/25/2014
  • #42 Source file: N:ResearchTransportsTruckingIndustry1-tkcapcityutil.xls Last update: 3/25/2014
  • #43 Source file: N:ResearchTransportsTruckingIndustry1-tkcapcityutil.xls Last update: 4/11/2014
  • #44 Source file: N:ResearchTransportsTruckingIndustry1-tkcapcityutil.xls Last update: 4/11/2014
  • #45 Source file: N:ResearchTransportsTruckingIndustry1-tkcapcityutil.xls [exhibit 13] Last update: 4/11/2014
  • #46 Source file: N:ResearchKristine KTruckscl8 vs truck tonnage.xls [3MO cht est tab] Last update: 09/27/2013