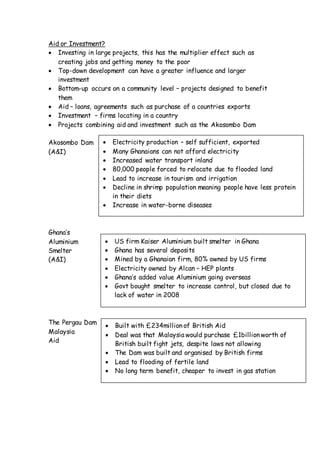
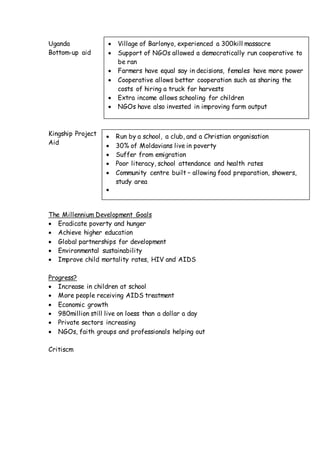
Bridging the Development Gap
Development Gap – The difference in income and quality of life in general
between the richest and poorest countries in the world
Food Crisis
Before
 Cheap imports
 Low interest rates – cheaper property
 Food surpluses
After (2006)
 Price of rice rose by 70% between 2007/08
 Poor harvests
 Growth of biofuels reducing land available
 Rising demand
 Hoarding of rise
 Rising oil prices
 Speculators predicting food futures
 Lead to several govts banning the export of rice
Philippines
 1990s was self sufficient, by 2008, was worlds biggest importer, due
to urban development and population growth
 Troops had to distribute rice
 Restaurants advised to give half portions of rice
Identifying the Development Gap
North-South Divide
 1981, the Brandt Report was created
 Showed the ‘North’ had 80% of wealth (1/3)
Measuring the DG
 GDP – value of products produced in a country over a year, also can
be changed into GDP per capita showing the average income
 GNI – Shows the income from overseas investments, and profits
from subsidiary overseas firms – many wealthy countries earn
money this way
 GDP/GNI do not show what per capita is worth in terms of
spending power and taking into to account the cost of living
 PPP – To show what per capita income would purchase when the cost
of living is taken into consideration (Several currencies expressed
in one currency)
 HDI – Measures quality of life – life expectancy, education
(literacy and length), GDP per capita
 Below 0.5 = low level of development >0.8 means high level
Uganda
 Green, fertile, rainy seasons, half population of UK, similar land area
 Good resources
 HDI = 0.505, UK = 0.946
 GDP per capita - $1454 (4.4% of UK)
 Based on export of primary products, meaning low income
 24% of families undernourished
 Poorest 20% infant mortality – 106/1000
 HIV/AIDS – average life expectancy – 49.5years
 60% have access to clean water
 Now only 6% of population are HIV-positive due to awareness
 Education – 17% of girls attend primary, 1/30,000 students allowed to
uni
The Debt Crisis
 Before, several countries self-sufficient, stable and low debt
 Oil price rise meant OPEC received more money, put money in banks
 Banks lent money out, but interest rate rises, increased payments
 Several countries could not pay debt
 IMF helped refinance loans, but only if cuts in govt budgets were
made
Highly Indebted Poor Countries
 38 countries, (32 in s-S Africa)
 Pressure for NGOs to reduce debt burdens
 2005 -G8 met, and cancelled $40billion worth of loans from
18countries, as long as good financial management occurred, less
corruption and money saved was spent on education, healthcare, and
poverty reduction
 2008 27/38 countries met conditions for debt relieve saving
$85billion
Impacts of Debt Cancellation (Uganda)
 20% increase in public services spending (40% on education,
70%health)
 Free primary schooling introduced
 2.2 million have clean access to water
 HDI rise – 1985 -0.420, 2005 – 0.505
Core and Periphery
 Core areas drive the world economy, were first industrialised, from
investment from prosperous farm economy
 Peripheral lack capital, tend to export primary resources
 Core import, process and add value
 Global shifts to periphery due to cheap labour
Neo-liberalism
 Promotes free market theory and the private sector
 Reduced government influence
 However, in many developing countries, many feel that threats such as
poverty can only be helped by govt help
South Africa
 Large reserves of diamonds and gold, several tourists
 Income inequality rates are high – privatisation gave whites chance to
become richer
 Unemployment has reached 30%
 Over 18,000murders a year, crime rates are high
 New black political party, privatised several industries in 1994 to
attract investment
 Most economic growth was due to capital intensive
 Apartheid – segregation between blacks and whites
 50% SA’s population under 18
 Inflation between 14-20%
 Cuts in health spending
 Large regional and ethnic inequalities
Bangalore
 Specialises in IT, banking and finance
 Has 40% of IT workforce, attracting foreign investment – outsourcing
 Hubs designated to firms such as Electronic City
 Tax breaks, low wage rates attract firms
 Has highest average incomes in India
 Caste system – Religious and social class system – defined by birth and
family – this discrimination has been made illegal, but still occurs
 More housing needed, public transport, energy, airport
Trade or Aid
 Many countries donate 0.7% of GDP to developing countries
 However, trade may be more effective – multiplier effect
Uganda
 Uganda’s independence from Britain, lead to Idi Amin to take over, and
exported commodities such as cotton and tea dramatically decreased
 Amin now left, growth is achieved but not filtered to the poor
 Uganda lent money by IMF – if tariffs were removed
 Privatisation lead to unemployment as firms became more efficient
 Cuts in govt spending
 Good economic growth average, reduced poverty
 Low average income, income inequality
Free trade or Fair Trade
 WTO put pressure on EU subsides on sugar
 NGOs such as Oxfam put pressure on rich countries
 Uganda must also remove trade barriers to gain access to EU markets
 Uganda has fluctuating economic capacity
 Poor infrastructure
 Leaves Uganda vulnerable to global, more competitive competition
Aid or Investment?
 Investing in large projects, this has the multiplier effect such as
creating jobs and getting money to the poor
 Top-down development can have a greater influence and larger
investment
 Bottom-up occurs on a community level – projects designed to benefit
them
 Aid – loans, agreements such as purchase of a countries exports
 Investment – firms locating in a country
 Projects combining aid and investment such as the Akosombo Dam
Akosombo Dam
(A&I)
Ghana’s
Aluminium
Smelter
(A&I)
The Pergau Dam
Malaysia
Aid
 Electricity production – self sufficient, exported
 Many Ghanaians can not afford electricity
 Increased water transport inland
 80,000 people forced to relocate due to flooded land
 Lead to increase in tourism and irrigation
 Decline in shrimp population meaning people have less protein
in their diets
 Increase in water-borne diseases
 US firm Kaiser Aluminium built smelter in Ghana
 Ghana has several deposits
 Mined by a Ghanaian firm, 80% owned by US firms
 Electricity owned by Alcan – HEP plants
 Ghana’s added value Aluminium going overseas
 Govt bought smelter to increase control, but closed due to
lack of water in 2008
 Built with £234million of British Aid
 Deal was that Malaysia would purchase £1billion worth of
British built fight jets, despite laws not allowing
 The Dam was built and organised by British firms
 Lead to flooding of fertile land
 No long term benefit, cheaper to invest in gas station
Uganda
Bottom-up aid
Kingship Project
Aid
The Millennium Development Goals
 Eradicate poverty and hunger
 Achieve higher education
 Global partnerships for development
 Environmental sustainability
 Improve child mortality rates, HIV and AIDS
Progress?
 Increase in children at school
 More people receiving AIDS treatment
 Economic growth
 980million still live on loess than a dollar a day
 Private sectors increasing
 NGOs, faith groups and professionals helping out
Critiscm
 Village of Barlonyo, experienced a 300kill massacre
 Support of NGOs allowed a democratically run cooperative to
be ran
 Farmers have equal say in decisions, females have more power
 Cooperative allows better cooperation such as sharing the
costs of hiring a truck for harvests
 Extra income allows schooling for children
 NGOs have also invested in improving farm output
 Run by a school, a club, and a Christian organisation
 30% of Moldavians live in poverty
 Suffer from emigration
 Poor literacy, school attendance and health rates
 Community centre built – allowing food preparation, showers,
study area


Bridging the development gap

  • 1.
    Bridging the DevelopmentGap Development Gap – The difference in income and quality of life in general between the richest and poorest countries in the world Food Crisis Before  Cheap imports  Low interest rates – cheaper property  Food surpluses After (2006)  Price of rice rose by 70% between 2007/08  Poor harvests  Growth of biofuels reducing land available  Rising demand  Hoarding of rise  Rising oil prices  Speculators predicting food futures  Lead to several govts banning the export of rice Philippines  1990s was self sufficient, by 2008, was worlds biggest importer, due to urban development and population growth  Troops had to distribute rice  Restaurants advised to give half portions of rice Identifying the Development Gap North-South Divide  1981, the Brandt Report was created  Showed the ‘North’ had 80% of wealth (1/3) Measuring the DG  GDP – value of products produced in a country over a year, also can be changed into GDP per capita showing the average income  GNI – Shows the income from overseas investments, and profits from subsidiary overseas firms – many wealthy countries earn money this way  GDP/GNI do not show what per capita is worth in terms of spending power and taking into to account the cost of living
  • 2.
     PPP –To show what per capita income would purchase when the cost of living is taken into consideration (Several currencies expressed in one currency)  HDI – Measures quality of life – life expectancy, education (literacy and length), GDP per capita  Below 0.5 = low level of development >0.8 means high level Uganda  Green, fertile, rainy seasons, half population of UK, similar land area  Good resources  HDI = 0.505, UK = 0.946  GDP per capita - $1454 (4.4% of UK)  Based on export of primary products, meaning low income  24% of families undernourished  Poorest 20% infant mortality – 106/1000  HIV/AIDS – average life expectancy – 49.5years  60% have access to clean water  Now only 6% of population are HIV-positive due to awareness  Education – 17% of girls attend primary, 1/30,000 students allowed to uni The Debt Crisis  Before, several countries self-sufficient, stable and low debt  Oil price rise meant OPEC received more money, put money in banks  Banks lent money out, but interest rate rises, increased payments  Several countries could not pay debt  IMF helped refinance loans, but only if cuts in govt budgets were made Highly Indebted Poor Countries  38 countries, (32 in s-S Africa)  Pressure for NGOs to reduce debt burdens  2005 -G8 met, and cancelled $40billion worth of loans from 18countries, as long as good financial management occurred, less corruption and money saved was spent on education, healthcare, and poverty reduction  2008 27/38 countries met conditions for debt relieve saving $85billion
  • 3.
    Impacts of DebtCancellation (Uganda)  20% increase in public services spending (40% on education, 70%health)  Free primary schooling introduced  2.2 million have clean access to water  HDI rise – 1985 -0.420, 2005 – 0.505 Core and Periphery  Core areas drive the world economy, were first industrialised, from investment from prosperous farm economy  Peripheral lack capital, tend to export primary resources  Core import, process and add value  Global shifts to periphery due to cheap labour Neo-liberalism  Promotes free market theory and the private sector  Reduced government influence  However, in many developing countries, many feel that threats such as poverty can only be helped by govt help South Africa  Large reserves of diamonds and gold, several tourists  Income inequality rates are high – privatisation gave whites chance to become richer  Unemployment has reached 30%  Over 18,000murders a year, crime rates are high  New black political party, privatised several industries in 1994 to attract investment  Most economic growth was due to capital intensive  Apartheid – segregation between blacks and whites  50% SA’s population under 18  Inflation between 14-20%  Cuts in health spending  Large regional and ethnic inequalities
  • 4.
    Bangalore  Specialises inIT, banking and finance  Has 40% of IT workforce, attracting foreign investment – outsourcing  Hubs designated to firms such as Electronic City  Tax breaks, low wage rates attract firms  Has highest average incomes in India  Caste system – Religious and social class system – defined by birth and family – this discrimination has been made illegal, but still occurs  More housing needed, public transport, energy, airport Trade or Aid  Many countries donate 0.7% of GDP to developing countries  However, trade may be more effective – multiplier effect Uganda  Uganda’s independence from Britain, lead to Idi Amin to take over, and exported commodities such as cotton and tea dramatically decreased  Amin now left, growth is achieved but not filtered to the poor  Uganda lent money by IMF – if tariffs were removed  Privatisation lead to unemployment as firms became more efficient  Cuts in govt spending  Good economic growth average, reduced poverty  Low average income, income inequality Free trade or Fair Trade  WTO put pressure on EU subsides on sugar  NGOs such as Oxfam put pressure on rich countries  Uganda must also remove trade barriers to gain access to EU markets  Uganda has fluctuating economic capacity  Poor infrastructure  Leaves Uganda vulnerable to global, more competitive competition
  • 5.
    Aid or Investment? Investing in large projects, this has the multiplier effect such as creating jobs and getting money to the poor  Top-down development can have a greater influence and larger investment  Bottom-up occurs on a community level – projects designed to benefit them  Aid – loans, agreements such as purchase of a countries exports  Investment – firms locating in a country  Projects combining aid and investment such as the Akosombo Dam Akosombo Dam (A&I) Ghana’s Aluminium Smelter (A&I) The Pergau Dam Malaysia Aid  Electricity production – self sufficient, exported  Many Ghanaians can not afford electricity  Increased water transport inland  80,000 people forced to relocate due to flooded land  Lead to increase in tourism and irrigation  Decline in shrimp population meaning people have less protein in their diets  Increase in water-borne diseases  US firm Kaiser Aluminium built smelter in Ghana  Ghana has several deposits  Mined by a Ghanaian firm, 80% owned by US firms  Electricity owned by Alcan – HEP plants  Ghana’s added value Aluminium going overseas  Govt bought smelter to increase control, but closed due to lack of water in 2008  Built with £234million of British Aid  Deal was that Malaysia would purchase £1billion worth of British built fight jets, despite laws not allowing  The Dam was built and organised by British firms  Lead to flooding of fertile land  No long term benefit, cheaper to invest in gas station
  • 6.
    Uganda Bottom-up aid Kingship Project Aid TheMillennium Development Goals  Eradicate poverty and hunger  Achieve higher education  Global partnerships for development  Environmental sustainability  Improve child mortality rates, HIV and AIDS Progress?  Increase in children at school  More people receiving AIDS treatment  Economic growth  980million still live on loess than a dollar a day  Private sectors increasing  NGOs, faith groups and professionals helping out Critiscm  Village of Barlonyo, experienced a 300kill massacre  Support of NGOs allowed a democratically run cooperative to be ran  Farmers have equal say in decisions, females have more power  Cooperative allows better cooperation such as sharing the costs of hiring a truck for harvests  Extra income allows schooling for children  NGOs have also invested in improving farm output  Run by a school, a club, and a Christian organisation  30% of Moldavians live in poverty  Suffer from emigration  Poor literacy, school attendance and health rates  Community centre built – allowing food preparation, showers, study area 