Downloaded 45 times

![Braving the Financial Jungle THANK YOU FOR YOUR ATTENTION! A copy of this presentation will be posted on www.wynnebusiness.com Lisa M. Starr [email_address]](https://image.slidesharecdn.com/braving-the-financial-jungle-1225562613375676-9/85/Braving-The-Financial-Jungle-21-320.jpg)

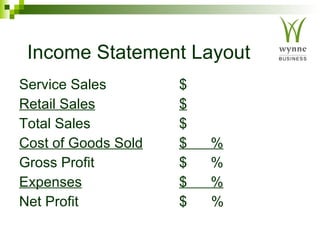
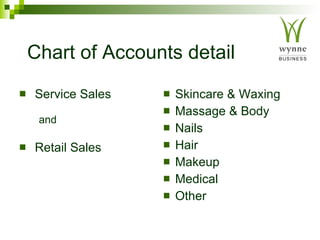
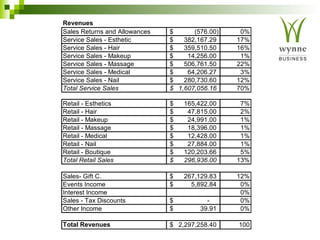
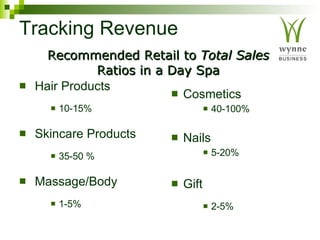
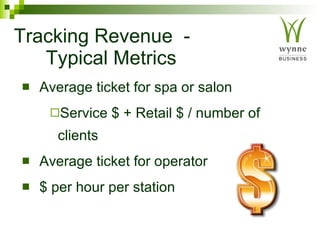
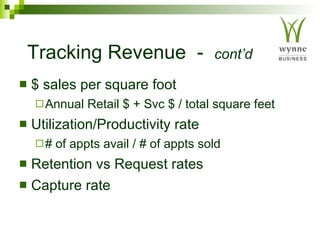
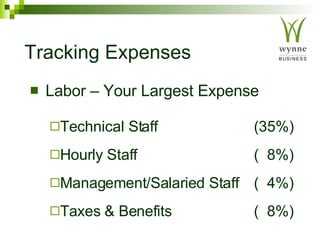
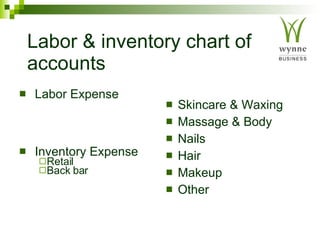
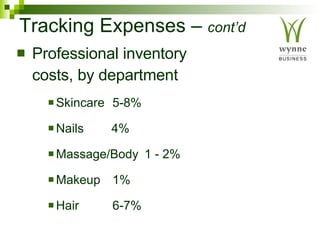
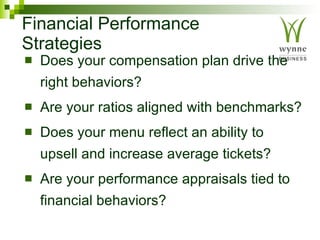
This document discusses strategies for effective financial management of a spa or salon business. It provides guidance on tracking key metrics like revenue, expenses, and profits. Revenue should be tracked by department and product category. Labor is typically the largest expense and should be tracked by staff type. The document also recommends developing action plans to address underperforming areas and prioritizing strategies to increase revenue and control expenses. Financial performance can be improved by aligning metrics with industry benchmarks and ensuring compensation plans and workstations drive optimal productivity.


