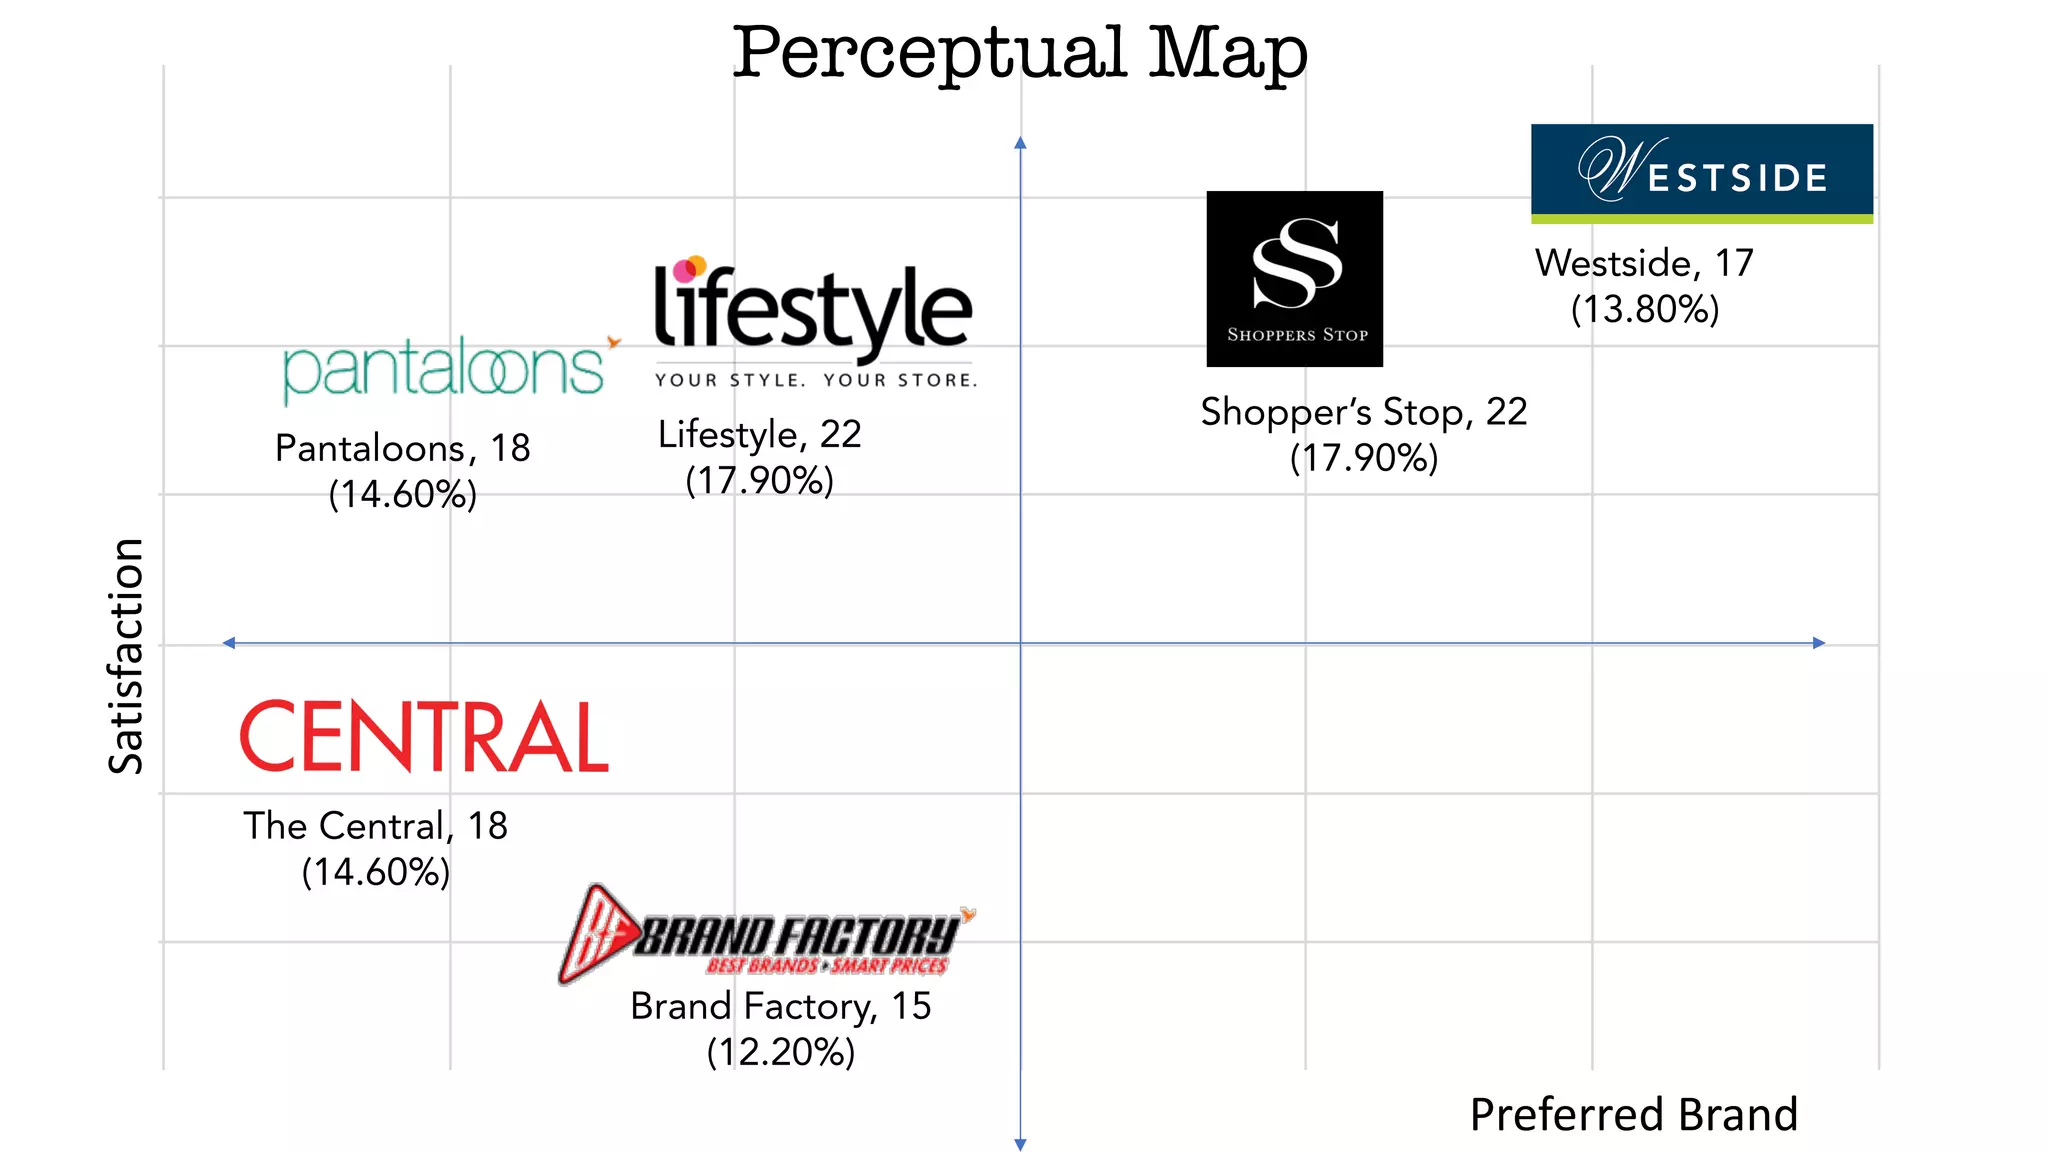
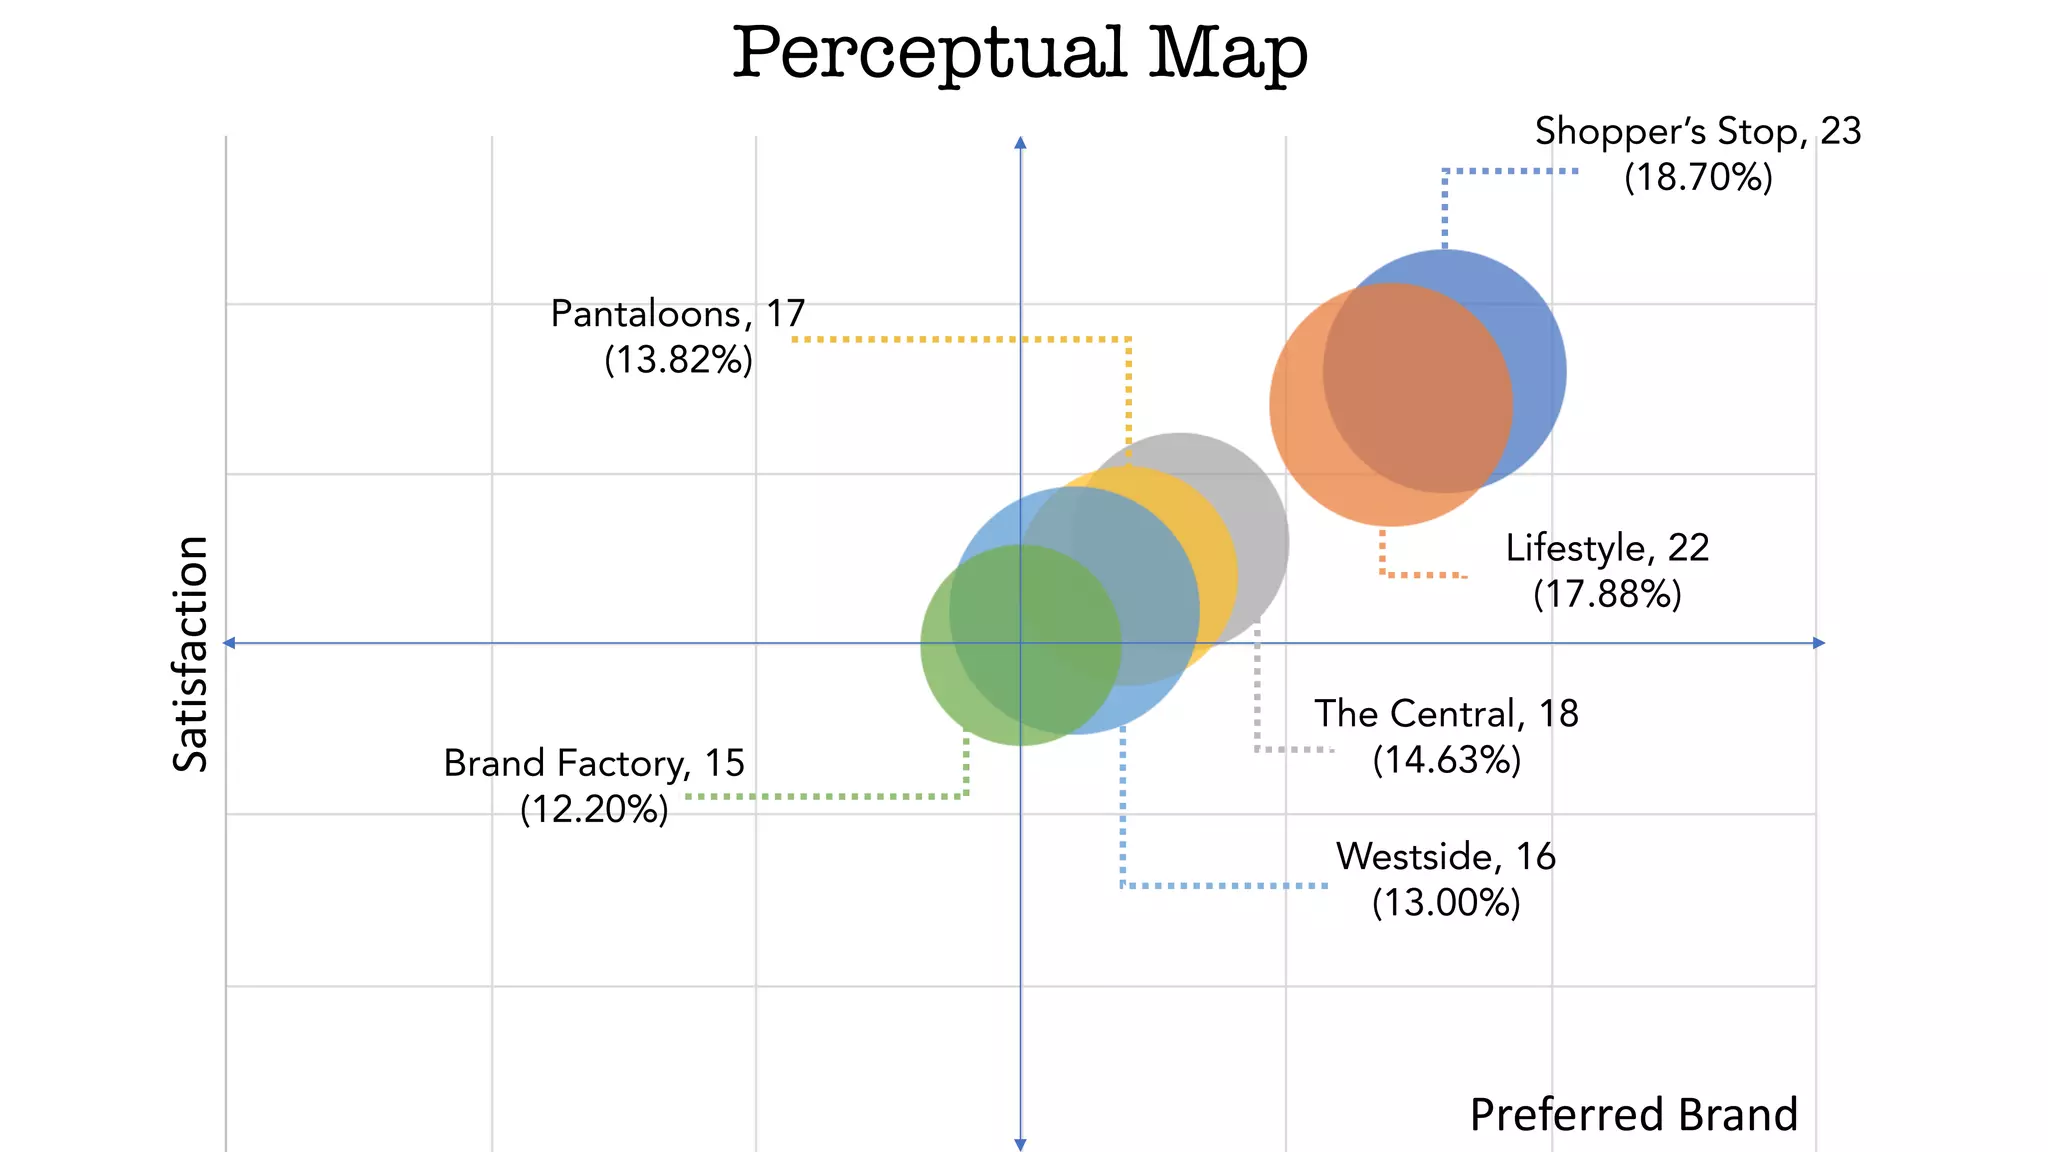
Perceptual Map of Retailers
and their Loyalty Programs
Group members
Dipti Mhatre 112 | Darsh Parekh 116 | Devang Tailor 123
Aakash Solomen 135 | Prateek Gupta 136
Project Title:
“Perceptual mapping is a market research technique in which consumer’s
views about a product are traced or plotted (mapped) on a chart.”
Respondents are asked questions about their experience with
the product in terms of its performance, packaging, price, size, etc.
What is a Perceptual Map?
Theses qualitative answers are transferred to a chart (perceptual map)
using a suitable scale (such as the Likert scale), and the results are
employed in improving the product or in developing a new one.
Perceptual mapping offers a unique ability to understand market
structure, analyzing the complex relationships among marketplace
competitors and the criteria used by buyers in making purchase decisions
and recommendations.
Research Methodology
• The Top 6 apparel retail outlets in Mumbai were selected for the project, based
on their loyalty programs.
• A total of 123 respondents were selected from the city of Mumbai. Convenience
sampling method was used for selecting the sample of respondents.
• A quantitative questionnaire was prepared keeping in mind the objectives of the
study. The data was collected through online mediums such as email and social
media websites.
• In order to achieve the objective of the study, discriminant analysis was used to
identify the attributes that are best associated with the particular apparel store.
• Then Perceptual maps were drawn to identify the market space occupied by each
of the brands along these attributes.
• Also, the importance of various factors considered by consumers while selecting
the loyalty program of a particular apparel store was evaluated.
• The study used Microsoft Excel 2016 for purpose of data analysis.
Brands Under
Consideration
• Apparel Retailer
• Loyalty Program
• Joining Fess
• Rewards and Benefits
• Place of Redemption of Points
• Ease of Redemption
• Satisfaction Level
• Maximum Rewards for minimum purchase
• Importance of Loyalty Program
Sample Size - 123 Respondents
Factors Under Consideration
• Apparel Retailer
• Loyalty Program
• Joining Fess
• Rewards and Benefits
• Place of Redemption of Points
• Ease of Redemption
• Satisfaction Level
• Maximum Rewards for minimum purchase
• Importance of Loyalty Program
Sample Size - 123 Respondents
Factors Under Consideration
Analysis
Analysis
Analysis
Likert’s Scale
Equally
Preferred
Moderately
Preferred
Strongly
Preferred
Very Strongly
Preferred
Extremely
Preferred
Preference of Brands
Satisfaction Level
Highly
SatisfiedSatisfiedNeutralDissatisfied
Highly
Dissatisfied
Likert’s Scale - Brands
Equally
Preferred
Moderately
Preferred
Strongly
Preferred
Very Strongly
Preferred
Extremely
Preferred
Highly
SatisfiedSatisfiedNeutralDissatisfied
Highly
Dissatisfied
Preference of Brands
Satisfaction Level
Perceptual Map
Brand Factory, 15
(12.20%)
Pantaloons, 18
(14.60%)
Shopper’s Stop, 22
(17.90%)
The Central, 18
(14.60%)
Westside, 17
(13.80%)
Lifestyle, 22
(17.90%)
Satisfaction
Preferred	Brand
Conclusion
Perceptual Map
Brand Factory, 15
(12.20%)
Pantaloons, 17
(13.82%)
Shopper’s Stop, 23
(18.70%)
The Central, 18
(14.63%)
Westside, 16
(13.00%)
Lifestyle, 22
(17.88%)
Satisfaction
Preferred	Brand

Brand Management Presentation- Perceptual map of Apparel Retailers in India

  • 1.
    Perceptual Map ofRetailers and their Loyalty Programs Group members Dipti Mhatre 112 | Darsh Parekh 116 | Devang Tailor 123 Aakash Solomen 135 | Prateek Gupta 136 Project Title:
  • 2.
    “Perceptual mapping isa market research technique in which consumer’s views about a product are traced or plotted (mapped) on a chart.” Respondents are asked questions about their experience with the product in terms of its performance, packaging, price, size, etc. What is a Perceptual Map? Theses qualitative answers are transferred to a chart (perceptual map) using a suitable scale (such as the Likert scale), and the results are employed in improving the product or in developing a new one. Perceptual mapping offers a unique ability to understand market structure, analyzing the complex relationships among marketplace competitors and the criteria used by buyers in making purchase decisions and recommendations.
  • 3.
    Research Methodology • TheTop 6 apparel retail outlets in Mumbai were selected for the project, based on their loyalty programs. • A total of 123 respondents were selected from the city of Mumbai. Convenience sampling method was used for selecting the sample of respondents. • A quantitative questionnaire was prepared keeping in mind the objectives of the study. The data was collected through online mediums such as email and social media websites. • In order to achieve the objective of the study, discriminant analysis was used to identify the attributes that are best associated with the particular apparel store. • Then Perceptual maps were drawn to identify the market space occupied by each of the brands along these attributes. • Also, the importance of various factors considered by consumers while selecting the loyalty program of a particular apparel store was evaluated. • The study used Microsoft Excel 2016 for purpose of data analysis.
  • 4.
  • 5.
    • Apparel Retailer •Loyalty Program • Joining Fess • Rewards and Benefits • Place of Redemption of Points • Ease of Redemption • Satisfaction Level • Maximum Rewards for minimum purchase • Importance of Loyalty Program Sample Size - 123 Respondents Factors Under Consideration
  • 6.
    • Apparel Retailer •Loyalty Program • Joining Fess • Rewards and Benefits • Place of Redemption of Points • Ease of Redemption • Satisfaction Level • Maximum Rewards for minimum purchase • Importance of Loyalty Program Sample Size - 123 Respondents Factors Under Consideration
  • 7.
  • 8.
  • 9.
  • 10.
    Likert’s Scale Equally Preferred Moderately Preferred Strongly Preferred Very Strongly Preferred Extremely Preferred Preferenceof Brands Satisfaction Level Highly SatisfiedSatisfiedNeutralDissatisfied Highly Dissatisfied
  • 11.
    Likert’s Scale -Brands Equally Preferred Moderately Preferred Strongly Preferred Very Strongly Preferred Extremely Preferred Highly SatisfiedSatisfiedNeutralDissatisfied Highly Dissatisfied Preference of Brands Satisfaction Level
  • 12.
    Perceptual Map Brand Factory,15 (12.20%) Pantaloons, 18 (14.60%) Shopper’s Stop, 22 (17.90%) The Central, 18 (14.60%) Westside, 17 (13.80%) Lifestyle, 22 (17.90%) Satisfaction Preferred Brand
  • 13.
  • 14.
    Perceptual Map Brand Factory,15 (12.20%) Pantaloons, 17 (13.82%) Shopper’s Stop, 23 (18.70%) The Central, 18 (14.63%) Westside, 16 (13.00%) Lifestyle, 22 (17.88%) Satisfaction Preferred Brand