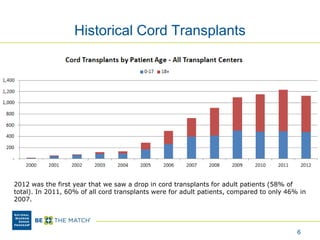
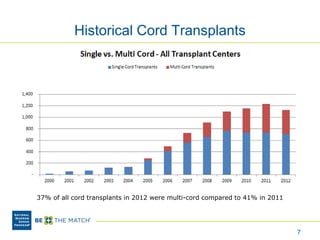
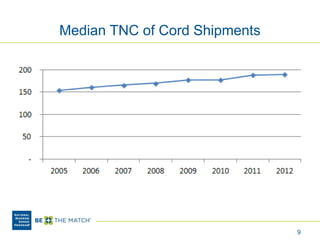
Expenses as an Issue Inhibiting
the Use of Cord Blood
Transplantation
Michael Boo, Chief Strategy Officer
National Marrow Donor Program
June 8, 2013
Overview
• The cost of cord transplantation impacts the use
of cord blood units
– Insurance coverage
– Time commitment
• Elements of Cost
– The product
– The procedure
• What’s next
2
5573 Transplants in 2011
3
4
0
200
400
600
800
1,000
1,200
1997
1998
1999
2000
2001
2002
2003
2004
2005
2006
2007
2008
2009
2010
2011
PediatricRecipients(Age Youngerthan18 Years)
Bone Marrow Peripheral Blood Stem Cells Cord Blood
NMDP Transplants by Cell Source
5
-
100
200
300
400
500
600
700
800
900
1,000
1997
1998
1999
2000
2001
2002
2003
2004
2005
2006
2007
2008
2009
2010
2011
Bone Marrow Peripheral Blood Stem Cells Cord Blood
*Minority includes those patients with race of CAU, DEC, OTH, UNK and Hispanic ethnicity.
NMDP Transplants for Minority
Patients by Cell Source
Historical Cord Transplants
6
2012 was the first year that we saw a drop in cord transplants for adult patients (58% of
total). In 2011, 60% of all cord transplants were for adult patients, compared to only 46% in
2007.
Historical Cord Transplants
37% of all cord transplants in 2012 were multi-cord compared to 41% in 2011
7
Product Related Costs
• Cost of Collection
– Staff vs. OB model
– The goal of diversity
• Cost of Banking
– TNC cut off decision
– Testing services
– The costs of process
8
Median TNC of Cord Shipments
9
Cord Shipments by TNC Group
10
Caucasian vs. Minority – 2012 Inventory
36% of Caucasian inventory has TNC higher than 124 compared to 32% of Minority inventory
11
Caucasian vs. Minority – 2012 Recruitment
12
62% of Caucasian recruitment has TNC higher than 124 compared to 37% of Minority recruitment
Caucasian vs. Minority – 2012 Shipments
13
90% of Caucasian shipments have TNC higher than 124 compared to 83% of Minority shipments
Caucasian vs. Minority – 2012 Shipments,
cont. – Patient Age 0-17
14
30% of shipments to minority pediatrics had a TNC less than 125
Caucasian vs. Minority – 2012 Shipments,
cont. – Patient Age 18+
15
Less than 5% of shipments to adult recipients had a TNC less than 125
Product Related Costs
• Cost of Regulation
– Capital costs
– Higher staffing costs
• Other Factors
– Research interest of the institution
– Overhead associated with the sponsoring institution
– Lack of scale
16
Procedure Related Costs
• Patient Management Challenges
– Slower engraftment
– Higher incidence of relapse
– Greater incidence of infectious diseases and
other pre-engraftment complications
– Management of the product requires
specialized knowledge
17
Procedure Related Costs
• Cost challenges
– Slower engraftment requires longer inpatient
stay
– Greater incidence of complications requires
more blood products, drugs and other medical
services
– Need for second unit for adults doubles cost
of the graft source
18
What Needs to be Done?
• Education and Awareness
– Promote cord blood studies as they get
published
– Provide clinical sample protocols and SOPs to
centers considering cord blood transplant
– Develop best practice guidelines for clinical
management
19
What Needs to be Done?
• Address the issue of slow engraftment
• Better inventory selection
• Identification of other selection criteria
• Pursue expansion or other technologies
• Continue to investigate use of cord blood in
other diseases
20
What Needs to be Done - Banking
• Assist Cord Blood Banks to become more
efficient and effective
– Provide guidance on economics of banking
• Update NMDP 2010 market analysis
• Study impact of FDA compliance
– Identify and promote best practices in banking
operations
• Ongoing effort through Cord Blood Advisory
Group
21

Expenses as an Issue Inhibiting the Use of Cord Blood Transplantation

  • 1.
    Expenses as anIssue Inhibiting the Use of Cord Blood Transplantation Michael Boo, Chief Strategy Officer National Marrow Donor Program June 8, 2013
  • 2.
    Overview • The costof cord transplantation impacts the use of cord blood units – Insurance coverage – Time commitment • Elements of Cost – The product – The procedure • What’s next 2
  • 3.
  • 4.
  • 5.
    5 - 100 200 300 400 500 600 700 800 900 1,000 1997 1998 1999 2000 2001 2002 2003 2004 2005 2006 2007 2008 2009 2010 2011 Bone Marrow PeripheralBlood Stem Cells Cord Blood *Minority includes those patients with race of CAU, DEC, OTH, UNK and Hispanic ethnicity. NMDP Transplants for Minority Patients by Cell Source
  • 6.
    Historical Cord Transplants 6 2012was the first year that we saw a drop in cord transplants for adult patients (58% of total). In 2011, 60% of all cord transplants were for adult patients, compared to only 46% in 2007.
  • 7.
    Historical Cord Transplants 37%of all cord transplants in 2012 were multi-cord compared to 41% in 2011 7
  • 8.
    Product Related Costs •Cost of Collection – Staff vs. OB model – The goal of diversity • Cost of Banking – TNC cut off decision – Testing services – The costs of process 8
  • 9.
    Median TNC ofCord Shipments 9
  • 10.
    Cord Shipments byTNC Group 10
  • 11.
    Caucasian vs. Minority– 2012 Inventory 36% of Caucasian inventory has TNC higher than 124 compared to 32% of Minority inventory 11
  • 12.
    Caucasian vs. Minority– 2012 Recruitment 12 62% of Caucasian recruitment has TNC higher than 124 compared to 37% of Minority recruitment
  • 13.
    Caucasian vs. Minority– 2012 Shipments 13 90% of Caucasian shipments have TNC higher than 124 compared to 83% of Minority shipments
  • 14.
    Caucasian vs. Minority– 2012 Shipments, cont. – Patient Age 0-17 14 30% of shipments to minority pediatrics had a TNC less than 125
  • 15.
    Caucasian vs. Minority– 2012 Shipments, cont. – Patient Age 18+ 15 Less than 5% of shipments to adult recipients had a TNC less than 125
  • 16.
    Product Related Costs •Cost of Regulation – Capital costs – Higher staffing costs • Other Factors – Research interest of the institution – Overhead associated with the sponsoring institution – Lack of scale 16
  • 17.
    Procedure Related Costs •Patient Management Challenges – Slower engraftment – Higher incidence of relapse – Greater incidence of infectious diseases and other pre-engraftment complications – Management of the product requires specialized knowledge 17
  • 18.
    Procedure Related Costs •Cost challenges – Slower engraftment requires longer inpatient stay – Greater incidence of complications requires more blood products, drugs and other medical services – Need for second unit for adults doubles cost of the graft source 18
  • 19.
    What Needs tobe Done? • Education and Awareness – Promote cord blood studies as they get published – Provide clinical sample protocols and SOPs to centers considering cord blood transplant – Develop best practice guidelines for clinical management 19
  • 20.
    What Needs tobe Done? • Address the issue of slow engraftment • Better inventory selection • Identification of other selection criteria • Pursue expansion or other technologies • Continue to investigate use of cord blood in other diseases 20
  • 21.
    What Needs tobe Done - Banking • Assist Cord Blood Banks to become more efficient and effective – Provide guidance on economics of banking • Update NMDP 2010 market analysis • Study impact of FDA compliance – Identify and promote best practices in banking operations • Ongoing effort through Cord Blood Advisory Group 21