Download to read offline
![V.Leela Prasad, B.Simmi Cintre / International Journal of Engineering Research and Applications
(IJERA) ISSN: 2248-9622 www.ijera.com
Vol. 2, Issue 4, July-August 2012, pp.409-420
Analysis of Novel Multi-Viewpoint Similarity Measures
V.Leela Prasad*, B.Simmi Cintre**
*(Student Scholar (MTech), Department of CSE, Adams Engineering College, JNTUH, Khammam,AP-507115, India)
** (Associate professor, Department of CSE, Adams Engineering College, JNTUH, Khammam, AP-507115, India)
Abstract— algorithms in many domains. In spite of that, its
All clustering methods have to assume simplicity, understandability and scalability are the
some cluster relationship among the data objects reasons for its tremendous popularity. An algorithm with
that they are applied on. Similarity between a pair adequate performance and usability in most of application
of objects can be defined either explicitly or scenarios could be preferable to one with better
implicitly. In this paper, we introduce a novel performance in some cases but limited usage due to high
multi-viewpoint based similarity measure and two complexity. While offering reasonable results, k-means is
related clustering methods. The major difference fast and easy to combine with other methods in larger
between a traditional dissimilarity/similarity systems.
measure and ours is that the former uses only a Our study of similarity of clustering was
single viewpoint, which is the origin, while the initially motivated by a research on automated text
latter utilizes many different viewpoints, which are categorization of foreign language texts, as explained
objects assumed to not be in the same cluster with below. As the amount of digital documents has been
the two objects being measured. Using multiple increasing dramatically over the years as the Internet
viewpoints, more informative assessment of grows, information management, search, and retrieval,
similarity could be achieved. Theoretical analysis etc., have become practically important problems.
and empirical study are conducted to support this Developing methods to organize large amounts of
claim. Two criterion functions for document unstructured text documents into a smaller number of
clustering are proposed based on this new measure. meaningful clusters would be very helpful as document
We compare them with several well-known clustering is vital to such tasks as indexing, filtering,
clustering algorithms that use other popular automated metadata generation, word sense
similarity measures on various document disambiguation, population of hierarchical catalogues of
collections to verify the advantages of our proposal. web resources and, in general, any application requiring
document organization .
Key Terms—Document clustering, text mining, Document clustering is also useful for topics
similarity measure, Clustering methods such as Gene Ontology in biomedicine where hierarchical
catalogues are needed. To deal with the large amounts of
I. INTRODUCTION data, machine learning approaches have been applied to
Clustering is one of the most interesting perform Automated Text Clustering (ATC). Given an
and important topics in data mining. The aim of unlabeled dataset, this ATC system builds clusters of
clustering is to find intrinsic structures in data, and documents that are hopefully similar to clustering
organize them into meaningful subgroups for further (classification, categorization, or labeling) performed by
study and analysis. There have been many clustering human experts. To identify a suitable tool and algorithm
algorithms published every year. They can be proposed for clustering that produces the best clustering solutions, it
for very distinct research fields, and developed using becomes necessary to have a method for comparing the
totally different techniques and approaches. results of different clustering algorithms. Though
Nevertheless, according to a recent study [1], more than considerable work has been done in designing clustering
half a century after it was introduced, the simple algorithms, not much research has been done on
algorithm k-means still remains as one of the top 10 formulating a measure for the similarity of two different
data mining algorithms nowadays. It is the most clustering algorithms. Thus, the main goal of this paper is
frequently used partitional clustering algorithm in to: First, propose an algorithm for performing similarity
practice. Another recent scientific discussion [2] states analysis among different clustering algorithms; second,
that k-means is the favourite algorithm that practitioners apply the algorithm to calculate similarity of various pairs
in the related fields choose to use. Needless to mention, of clustering methods applied to a Portuguese corpus and
k-means has more than a few basic drawbacks, such as the Iris dataset; finally, to cross validate the results of
sensitiveness to initialization and to cluster size, and its similarity analysis with the Euclidean (centroids) distances
performance can be worse than other state-of-the-art
409 | P a g e](https://image.slidesharecdn.com/bl24409420-121002052704-phpapp02/75/Bl24409420-1-2048.jpg)
![V.Leela Prasad, B.Simmi Cintre / International Journal of Engineering Research and Applications
(IJERA) ISSN: 2248-9622 www.ijera.com
Vol. 2, Issue 4, July-August 2012, pp.409-420
and Pearson correlation coefficient, using the same k
datasets. Possible applications are discussed. min∑ ∑ || di – Cr ||2
r=1 di Є Sr
The work in this paper is motivated by However, for data in a sparse and high-
investigations from the above and similar research dimensional space, such as that in document clustering,
findings. It appears to us that the nature of similarity cosine similarity is more widely used. It is also a popular
measure plays a very important role in the success or similarity score in text mining and information retrieval
failure of a clustering method. Our first objective is to [12]. Particularly, similarity of two document vectors d i
derive a novel method for measuring similarity between and dj , Sim(di, dj), is defined as the cosine of the angle
data objects in sparse and high-dimensional domain, between them. For unit vectors, this equals to their inner
particularly text documents. From the proposed product:
similarity measure, we then formulate new clustering Sim(di,dj ) = cos(di,dj) = ditdj
criterion functions and introduce their respective Cosine measure is used in a variant of k-means
clustering algorithms, which are fast and scalable like called spherical k-means [3]. While k-means aims to
k-means, but are also capable of providing high-quality minimize Euclidean distance, spherical k-means intends
and consistent performance. to maximize the cosine similarity between documents in
a cluster and that cluster’s centroid:
The remaining of this paper is organized as k dtiCr
follows. In Section 2, we review related literature on max∑ ∑ ——
similarity and clustering of documents. We then present r=1 diЄSr || Cr||
our proposal for document similarity measure in Section
3.It is followed by two criterion functions for document The major difference between Euclidean
clustering and their optimization algorithms in Section distance and cosine similarity, and therefore between k-
4. Extensive experiments on real-world benchmark means and spherical k-means, is that the former focuses
datasets are presented and discussed in Sections 5 on vector magnitudes, while the latter emphasizes on
.Finally, conclusions and potential future work are vector directions. Besides direct application in spherical
given in Section 6. k-means, cosine of document vectors is also widely used
in many other document clustering methods as a core
2 RELATED WORKS similarity measurement. The min-max cut graph-based
Each document in a corpus corresponds to an spectral method is an example [13]. In graph partitioning
m-dimensional vector d, where m is the total number approach, document corpus is consider as a graph G
of terms that the document corpus has. Document =(V,E), where each document is a vertex in V and each
vectors are often subjected to some weighting edge in E has a weight equal to the similarity between a
schemes, such as the standard Term Frequency- pair of vertices. Min-max cut algorithm tries to minimize
Inverse Document Frequency (TF-IDF), and the criterion function.
normalized to have unit length.
The principle definition of clustering is to In nearest-neighbor graph clustering methods,
arrange data objects into separate clusters such that the such as the CLUTO’s graph method above, the concept
intra-cluster similarity as well as the inter-cluster of similarity is somewhat different from the previously
dissimilarity is maximized. The problem formulation discussed methods. Two documents may have a certain
itself implies that some forms of measurement are value of cosine similarity, but if neither of them is in the
needed to determine such similarity or dissimilarity. other one’s neighborhood, they have no connection
There are many state-of-threat clustering approaches between them. In such a case, some context-based
that do not employ any specific form of measurement, knowledge or relativeness property is already taken into
for instance, probabilistic model based method , non- account when considering similarity. Recently, Ahmad
negative matrix factorization , information theoretic and Dey [21] proposed a method to compute distance
co-clustering and so on. In this paper, though, we between two categorical values of an attribute based on
primarily focus on methods that indeed do utilize a their relationship with all other attributes. Subsequently,
specific measure. In the literature, Euclidean distance Ienco et al. [22] introduced a similar context-based
is one of the most popular measures: distance learning method for categorical data. However,
Dist (di, dj) = | |di − dj || for a given attribute, they only selected a relevant subset
It is used in the traditional k-means of attributes from the whole attribute set to use as the
algorithm. The objective of k-means is to minimize the context for calculating distance between its two values.
Euclidean distance between objects of a cluster and More related to text data, there are phrase-based and
that cluster’s centroid: concept-based document similarities. Lakkaraju et al.
[23] employed a conceptual tree-similarity measure to
410 | P a g e](https://image.slidesharecdn.com/bl24409420-121002052704-phpapp02/75/Bl24409420-2-2048.jpg)
![V.Leela Prasad, B.Simmi Cintre / International Journal of Engineering Research and Applications
(IJERA) ISSN: 2248-9622 www.ijera.com
Vol. 2, Issue 4, July-August 2012, pp.409-420
identify similar documents. This method requires research, we include all the measures that were tested in
representing documents as concept trees with the help [17] and add another one—the averaged Kullback-
of a classifier. For clustering, Chim and Deng [24] Leibler divergence. These five measures are discussed
proposed a phrase-based document similarity by below. Different measure not only results in different
combining suffix tree model and vector space model. final partitions, but also imposes different requirements
They then used Hierarchical Agglomerative Clustering for the same clustering algorithm, as we will see in
algorithm to perform the clustering task. However, a Section 4.
drawback of this approach is the high computational
complexity due to the needs of building the suffix tree 3.1 Metric
and calculating pairwise similarities explicitly before Not every distance measure is a metric. To qualify as a
clustering. There are also measures designed metric, a measure d must satisfy the following four
specifically for capturing structural similarity among conditions.
XML documents [25]. They are essentially different Let x and y be any two objects in a set and d(x, y) be the
from the document-content measures that are distance between x and y.
discussed in this paper. 1. The distance between any two points must be
In general, cosine similarity still remains as nonnegative,
the most popular measure because of its simple that is, d(x, y) ≥0.
interpretation and easy computation, though its 2. The distance between two objects must be zero if and
effectiveness is yet fairly limited. In the following only if the two objects are identical, that is, d(x, y) = 0
sections, we propose a novel way to evaluate if and only if x = y.
similarity between documents, and consequently 3. Distance must be symmetric, that is, distance from
formulate new criterion functions for document x to y is the same as the distance from y to x, ie.
clustering. d(x, y) = d(y, x).
4. The measure must satisfy the triangle inequality,
3. SIMILARITY MEASURES which
Before clustering, a similarity/distance measure must is d(x, z) ≤ d(x, y) + d(y, z).
be determined.The measure reflects the degree of
closeness or separation of the target objects and should 3.2 Euclidean Distance
correspond to the characteristics that are believed to Euclidean distance is a standard metric for geometrical
distinguish the clusters embedded in the data. In many problems. It is the ordinary distance between two points
cases, these characteristics are dependent on the data and can be easily measured with a ruler in two- or three-
or the problem context at hand, and there is no dimensional space. Euclidean distance is widely used in
measure that is universally best for all kinds of clustering problems, including clustering text. It satisfies
clustering problems. all the above four conditions and therefore is a true
Moreover, choosing an appropriate similarity measure metric. It is also the default distance measure used with
is also crucial for cluster analysis, especially for a the K-means algorithm.
particular type of clustering algorithms. For example, Measuring distance between text documents, given two
the density-based clustering algorithms, such as documents da and db represented by their
DBScan [4], rely heavily on the similarity → →
computation. Density-based clustering finds clusters term vectors ta and tb respectively, the Euclidean
as dense areas in the data set, and the density of a distance of the two documents is defined as
given point is in turn estimated as the closeness of the
corresponding data object to its neighboring objects. →→ m
Recalling that closeness is quantified as the DE( ta , tb) =( ∑ | wt,a – wt,b|2)1/2 ,
distance/similarity value, we can see that large number t=1
of distance/similarity computations are required for
finding dense areas and estimate cluster assignment of where the term set is T = {t1, . . . , tm}. As mentioned
new data objects. Therefore, understanding the previously, we use the tfidf value as term weights, that is
effectiveness of different measures is of great wt,a = tfidf(da, t).
importance in helping to choose the best one.
In general, similarity/distance measures map the 3.3 Cosine Similarity
distance or similarity between the symbolic When documents are represented as term vectors, the
description of two objects into a single numeric value, similarity of two documents corresponds to the
which depends on two factors— the properties of the correlation between the vectors. This is quantified as the
two objects and the measure itself. In order to make cosine of the angle between vectors, that is, the so-called
the results of this study comparable to previous cosine similarity. Cosine similarity is one of the most
411 | P a g e](https://image.slidesharecdn.com/bl24409420-121002052704-phpapp02/75/Bl24409420-3-2048.jpg)
![V.Leela Prasad, B.Simmi Cintre / International Journal of Engineering Research and Applications
(IJERA) ISSN: 2248-9622 www.ijera.com
Vol. 2, Issue 4, July-August 2012, pp.409-420
popular similarity measure applied to text documents, The Jaccard coefficient is a similarity measure and
such as in numerous information retrieval applications ranges between 0 and 1. It is 1 when the
[21] and clustering too [9]. → →
ta = tb and 0 when ta and tb are disjoint, where 1 means
the two objects are the same and 0 means they are
→ → completely different. The corresponding distance
Given two documents ta and tb , their cosine measure is DJ = 1 − SIMJ and we will use DJ instead in
similarity is subsequent experiments.
→ →
→→ ta . tb 3.5 Averaged Kullback-Leibler Divergence
SIMC (ta, tb) = ————— In information theory based clustering, a document is
→ → considered as a probability distribution of terms. The
| ta | × | tb | similarity of two documents is measured as the distance
between the two corresponding probability distributions.
→ → The Kullback- Leibler divergence (KL divergence), also
Where ta and tb are m-dimensional vectors over the called the relative entropy, is a widely applied measure
term set T = {t1, . . . , tm}. Each dimension represents for evaluating the differences between two probability
a term with its weight in the document, which is non- distributions.
negative. As a result, the cosine similarity is non-
negative and bounded between [0,1]. Given two distributions P and Q, the KL divergence
from distribution P to distribution Q is defined as
An important property of the cosine similarity is its P
independence of document length. For example, DKL(P||Q) = Plog( —)
combining two identical copies of a document d to get Q
a new pseudo document d1, the cosine similarity In the document scenario, the divergence between two
between d and d1 is 1, which means that these two distribution of words is:
documents are regarded to be identical. Meanwhile, →→ w t,a
given another document l, d and d1 will have the same DKL(ta||tb) = ∑ wt,a × log ( — )
similarity value to l, wt,b
→ → → →
that is, sim(td , tl ) = sim( td1 , tl ). In other words, However, unlike the previous measures, the KL
documents with the same composition but different divergence is not symmetric, ie.
totals will be treated identically. Strictly speaking, this DKL(P||Q) ≠ DKL(Q||P). Therefore it is not a true metric.
does not satisfy the second condition of a metric, As a result, we use the averaged KL divergence instead,
because after all the combination of two copies is a which is defined as
different object from the original document. However, DAvgKL(P||Q) = π1DKL(P||M) + π2DKL(Q||M),
in practice, when the term vectors are normalized to a P Q
unit length such as 1, and in this case the where π1 = —— π2 = —— and M = π1P + π2Q.
representation of d and d1 is the same. P+Q , P+Q ,
3.4 Jaccard Coefficient The average weighting between two vectors ensures
The Jaccard coefficient, which is sometimes referred symmetry, that is, the divergence from document i to
to as the Tanimoto coefficient, measures similarity as document j is the same as the divergence from document
the intersection divided by the union of the objects. j to document i. The averaged KL divergence has
For text document, the Jaccard coefficient compares recently been applied to clustering text documents, such
the sum weight of shared terms to the sum weight of as in the family of the Information Bottleneck clustering
terms that are present in either of the two document algorithms [18], to good effect.
but are not the shared terms. The formal definition is:
→ → 3.6 novel similarity measure
→→ ta . tb The cosine similarity can be expressed in the following
SIMJ (ta, tb) = ———————— form without changing its meaning:
→ → →→ Sim(di, dj) = cos(di−0, dj−0) = (di−0)t (dj−0)
| ta |2× | tb |2 - ta . tb where 0 is vector 0 that represents the origin point.
According to this formula, the measure takes 0 as one
and only reference point. The similarity between two
documents di and dj is determined w.r.t. the angle
412 | P a g e](https://image.slidesharecdn.com/bl24409420-121002052704-phpapp02/75/Bl24409420-4-2048.jpg)
![V.Leela Prasad, B.Simmi Cintre / International Journal of Engineering Research and Applications
(IJERA) ISSN: 2248-9622 www.ijera.com
Vol. 2, Issue 4, July-August 2012, pp.409-420
To further justify the above proposal and analysis, we Two real-world document datasets are used as examples
carried out a validity test for MVS and CS. The in this validity test. The first is reuters7, a subset of the
purpose of this test is to check how much a similarity famous collection, Reuters-21578 Distribution 1.0, of
measure coincides with the true class labels. It is based Reuter’s newswire articles1. Reuters-21578 is one of the
on one principle: if a similarity measure is appropriate most widely used test collection for text categorization.
for the clustering problem, for any of a document in In our validity test, we selected 2,500 documents from
the corpus, the documents that are closest to it based the largest 7 categories: ―acq‖, ―crude‖, ―interest‖,
on this measure should be in the same cluster with ―earn‖, ―money-fx‖, ―ship‖ and ―trade‖ to form reuters7.
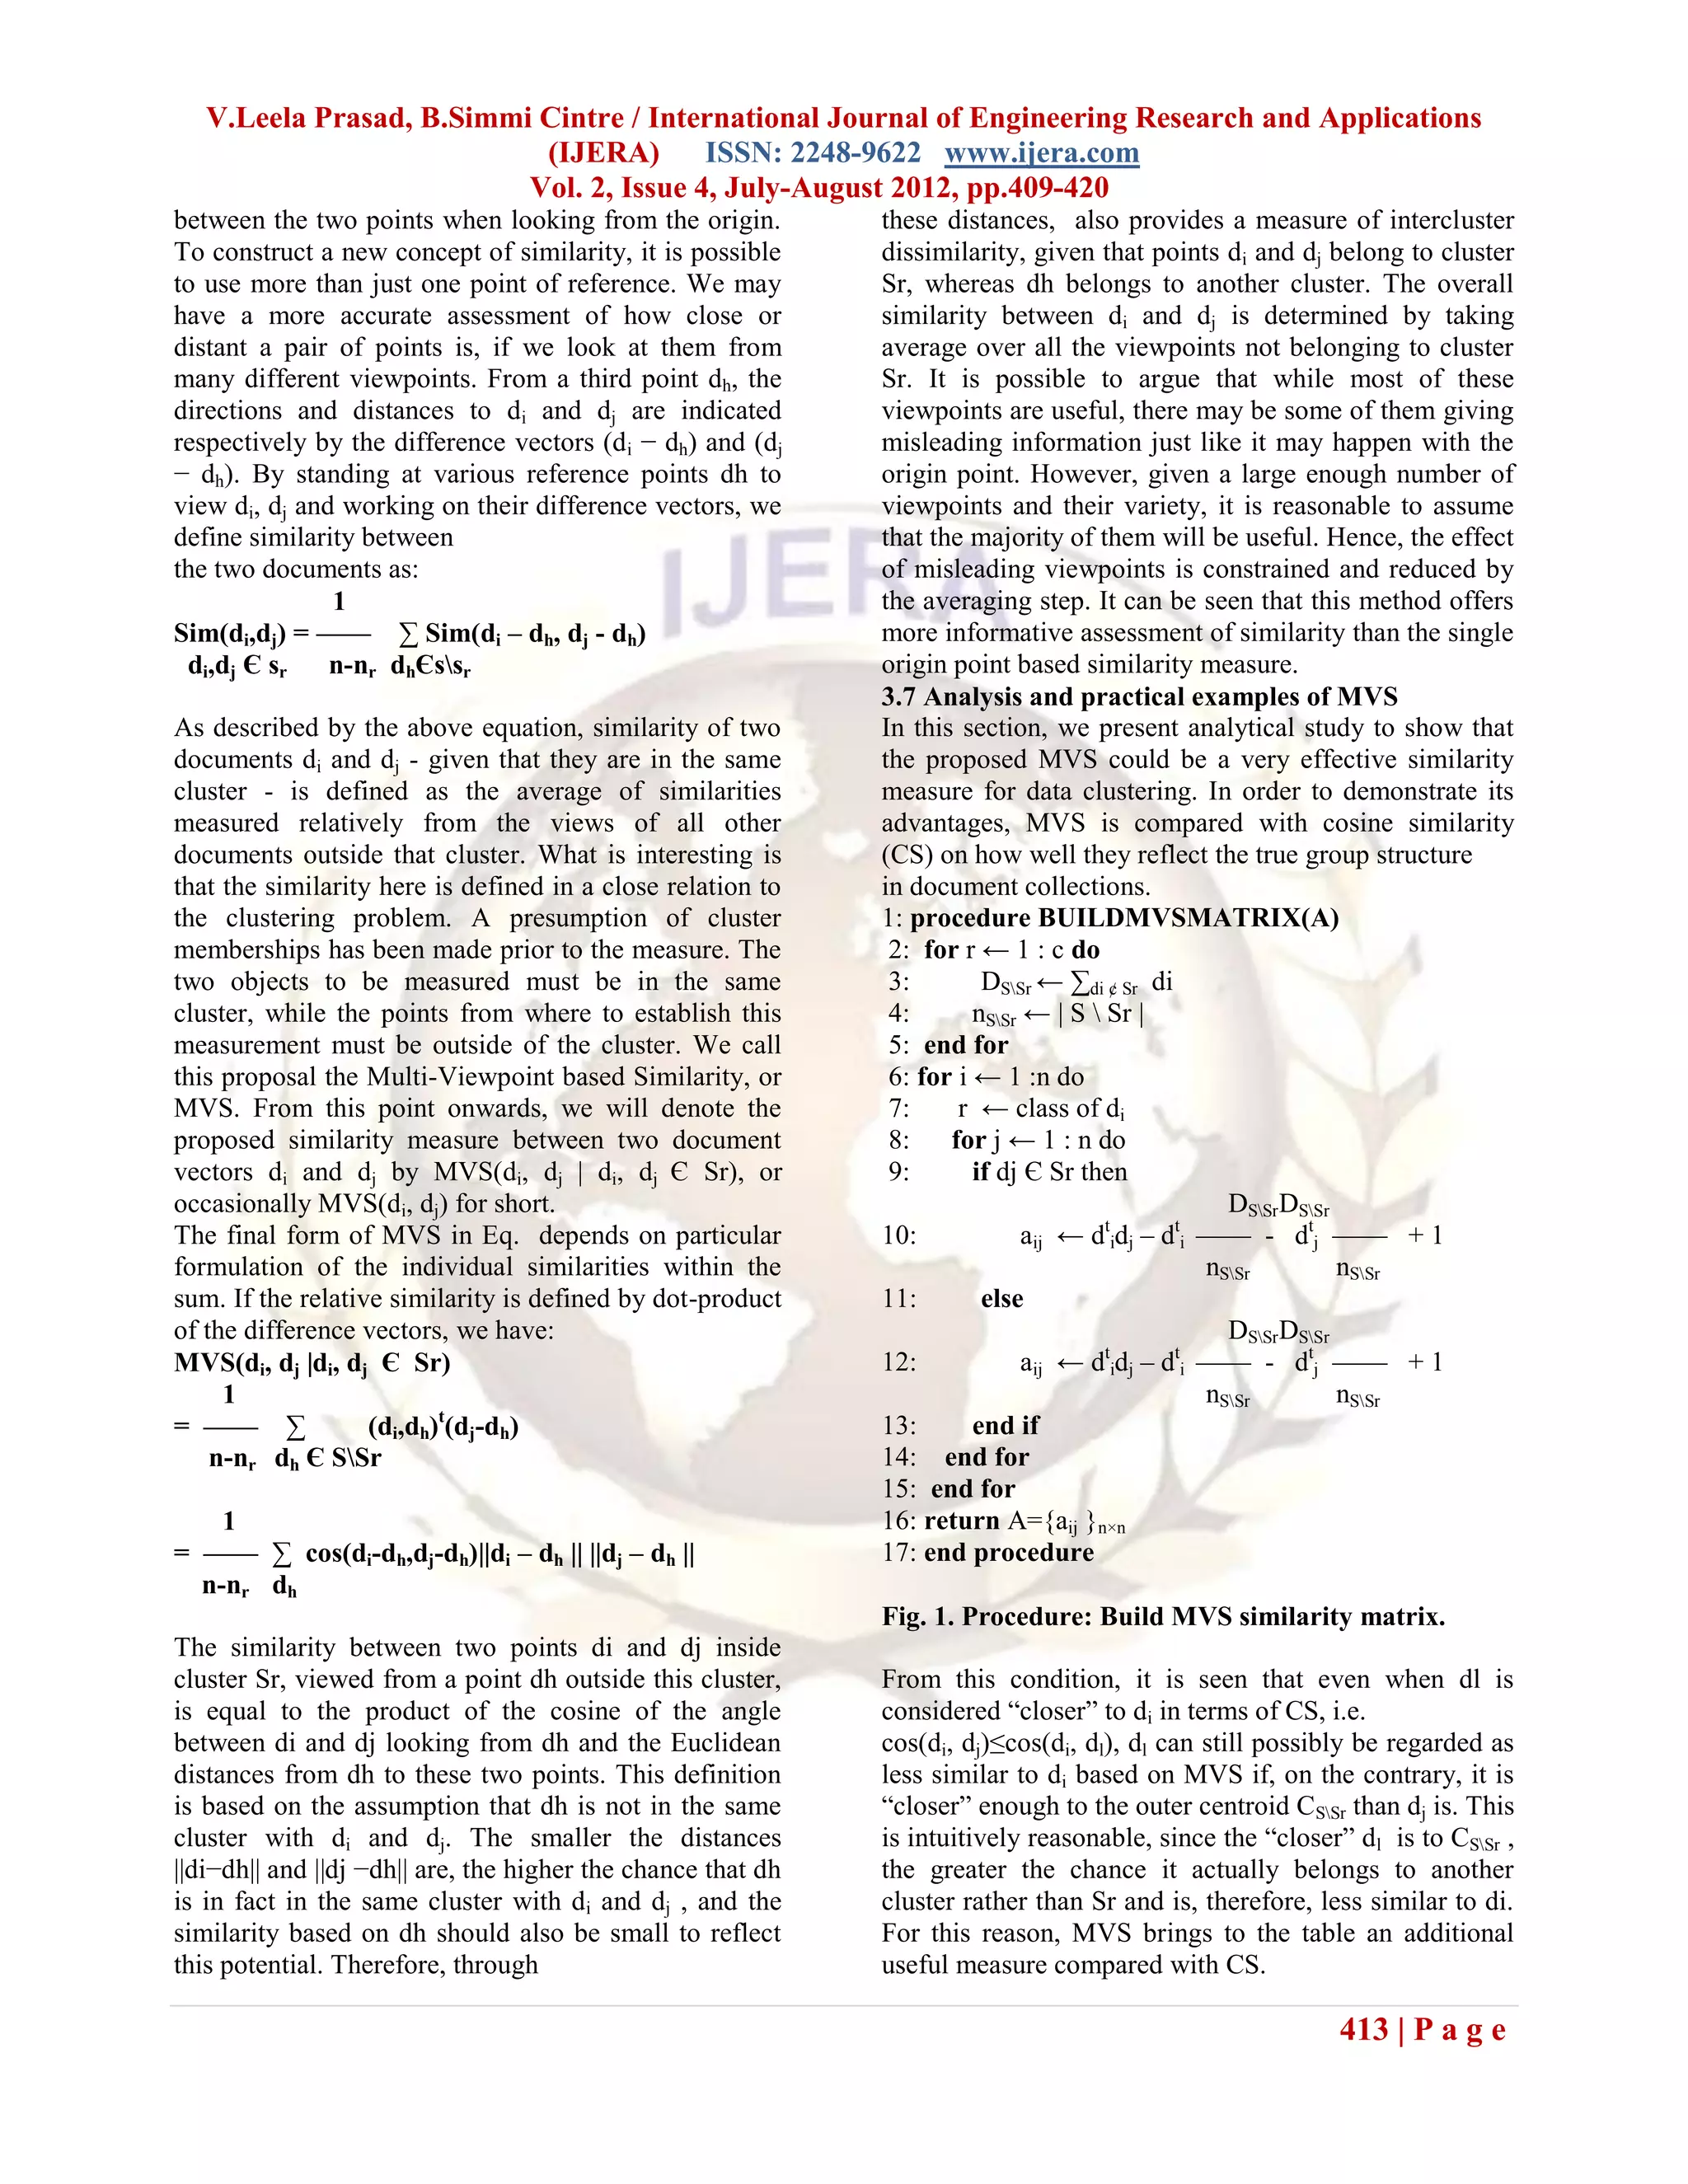
it.The validity test is designed as following. For each Some of the documents may appear in more than one
type of similarity measure, a similarity matrix A category. The second dataset is k1b, a collection of 2,340
={aij}n×n is created. For CS, this is simple, as aij = dti web pages from the Yahoo! subject hierarchy, including
dj .The procedure for building MVS matrix is 6 topics: ―health‖, ―entertainment‖, ―sport‖, ―politics‖,
described in Fig. 1. Firstly, the outer composite w.r.t. ―tech‖ and ―business‖. It was created from a past study
each class is determined. Then, for each row ai of A, i in information retrieval called WebAce [26], and is now
= 1, . . . , n, if the pair of documents d i and dj, j = 1, . . . available with the CLUTO toolkit [19].
, n are in the same class, aij is calculated as in line 10, The two datasets were preprocessed by stop-word
Fig. 1. Otherwise, dj is assumed to be in d i’s class, and removal and stemming. Moreover, we removed words
aij is calculated as in line 12, Fig. 1. After matrix A is that appear in less than two documents or more than
formed, the procedure in Fig. 2 is used to get its 99.5% of the total number of documents. Finally, the
validity score. For each document d i corresponding to documents were weighted by TF-IDF and normalized to
row ai of A, we select qr documents closest to di. The unit vectors.
value of qr is chosen relatively as percentage of the For example, with k1b dataset at percentage = 1.0, MVS’
size of the class r that contains di, where percentage ∈ validity score is 0.80, while that of CS is only 0.67. This
(0, 1]. Then, validity w.r.t. di is calculated by the indicates that, on average, when we pick up any
fraction of these qr documents having the same class document and consider its neighborhood of size equal to
label with di, as in line 12, Fig. 2. The final validity is its true class size, only 67% of that document’s
determined by averaging neighbors based on CS actually belong to its class. If
Require: 0 < percentage ≤ 1 based on MVS, the number of valid neighbors increases
1: procedure GETVALIDITY(validity,A, percentage) to 80%. The validity test has illustrated the potential
2: for r ← 1 : c do advantage of the new multi-viewpoint based similarity
3: qr ← [percentage × nr] measure compared to the cosine measure.
4: if qr = 0 then
5: qr ← 1
6: end if 4.MULTI-VIEWPOINT BASED
7: end for CLUSTERING
8: for i ← 1 : n do Having defined our similarity measure, we now
9: {aiv[1], . . . , aiv[n] } ←Sort {ai1, . . . , ain} formulate our clustering criterion functions. The first
10: s.t. aiv[1] ≥ aiv[2] ≥ . . . ≥ aiv[n] function, called IR, is the cluster size-weighted sum of
{v[1], . . . , v[n]} ← permute {1, . . . , n} average pairwise similarities of documents in the same
11: r ← class of di cluster. Firstly, let us express this sum in a general form
12: validity(di) ←|{dv[1], . . . , dv[qr]} ∩ Sr| by function F:
—————————— k
qr F= ∑ nr [ 1 / n2r ∑ Sim(di,dj) ]
13: end for di,djЄ Sr
14: validity ←∑ni←1 validity(di) We would like to transform this objective function into
—————— some suitable form such that it could facilitate the
n optimization procedure to be performed in a simple, fast
15: return validity and effective way. Let us use a parameter α called the
16: end procedure regulating factor, which has some constant value
(α Є [0, 1]), and let λr = n αr in Eq. the final form of our
Fig. 2. Procedure: Get validity score criterion function IR is:
over all the rows of A, as in line 14, Fig. 2. It is clear
that validity score is bounded within 0 and 1. The
higher validity score a similarity measure has, the
more suitable it should be for the clustering task.
414 | P a g e](https://image.slidesharecdn.com/bl24409420-121002052704-phpapp02/75/Bl24409420-6-2048.jpg)
![V.Leela Prasad, B.Simmi Cintre / International Journal of Engineering Research and Applications
(IJERA) ISSN: 2248-9622 www.ijera.com
Vol. 2, Issue 4, July-August 2012, pp.409-420
completes without any documents being moved to new
clusters. Unlike the traditional k-means, this algorithm is
a stepwise optimal procedure. While kmeans only
k 1 n+nr n+nr updates after all n documents have been reassigned, the
IR = ∑ —— [—— || Dr||2 – (—— - 1) DtrD] incremental clustering algorithm updates immediately
r=1 nr1-ά n-nr n-nr whenever each document is moved to new cluster. Since
every move when happens increases the objective
In the empirical study of Section 5.4, it appears that function value, convergence to a local optimum is
IR’s performance dependency on the value of α is not guaranteed.
very critical. The criterion function yields relatively During the optimization procedure, in each iteration, the
good clustering results for α Є (0, 1). main sources of computational cost are:
In the formulation of IR, a cluster quality is measured • Searching for optimum clusters to move individual
by the average pairwise similarity between documents documents to: O(nz · k).
within that cluster. However, such an approach can • Updating composite vectors as a result of such moves:
lead to sensitiveness to the size and tightness of the O(m · k).
clusters. With CS, for example, pairwise similarity of where nz is the total number of non-zero entries in all
documents in a sparse cluster is usually smaller than document vectors. Our clustering approach is partitional
those in a dense cluster. Though not as clear as with and incremental; therefore, computing similarity matrix
CS, it is still is absolutely not needed. If τ denotes the number of
possible that the same effect may hinder MVS-based iterations the algorithm takes, since nz is often several
clustering if using pairwise similarity. To prevent this, tens times larger than m for document domain, the
an alternative approach is to consider similarity computational complexity required for clustering with
between each document vector and its cluster’s IR and IV is O(nz · k · τ).
centroid instead.
4.1 Optimization algorithm and complexity 5 PERFORMANCE EVALUATION OF MVSC
We denote our clustering framework by To verify the advantages of our proposed
MVSC, meaning Clustering with Multi-Viewpoint methods, we evaluate their performance in experiments
based Similarity. Subsequently, we have MVSC-IR on document data. The objective of this section is to
and MVSC-IV , which are MVSC with criterion compare MVSC- IR and MVSC-IV with the existing
function IR and IV respectively. The main goal is to algorithms that also use specific similarity measures and
perform document clustering by optimizing criterion functions for document clustering. The
IR in Eq. and IV in Eq.. For this purpose, the similarity measures to be compared includes Euclidean
incremental k-way algorithm [18], [29] - a sequential distance, cosine similarity and extended Jaccard
version of k-means - is employed. Considering that the coefficient.
expression of IV depends only on nr and Dr, r = 1, . . . 5.1 Document collections
, k, IV can be written in a general form: The data corpora that we used for experiments
k consist of twenty benchmark document datasets. Besides
IV =∑Ir (nr,Dr) reuters7 and k1b, which have been described in details
r=1 earlier, we included another eighteen text collections so
that the examination of the clustering methods is more
where Ir (nr,Dr) corresponds to the objective value of thorough and exhaustive. Similar to k1b, these datasets
cluster r. The same is applied to IR. With this general are provided together with CLUTO by the toolkit’s
form, the incremental optimization algorithm, which authors [19]. They had been used for experimental
has two major steps Initialization and Refinement, is testing in previous papers, and their source and origin
described in Fig. 5. At Initialization, k arbitrary had also been described in details [30], [31]. Table 2
documents are selected to be the seeds from which summarizes their characteristics. The corpora present a
initial partitions are formed. Refinement is a diversity of size, number of classes and class balance.
procedure that consists of a number of iterations. They were all preprocessed by standard procedures,
During each iteration, the n documents are visited one including stopword removal, stemming, removal of too
by one in a totally random order. Each document is rare as well as too frequent words, TF-IDF weighting
checked if its move to another cluster results in and normalization.
improvement of the objective function. If yes, the
document is moved to the cluster that leads to the
highest improvement. If no clusters are better than the
current cluster, the document is not moved. The
clustering process terminates when an iteration
415 | P a g e](https://image.slidesharecdn.com/bl24409420-121002052704-phpapp02/75/Bl24409420-7-2048.jpg)
![V.Leela Prasad, B.Simmi Cintre / International Journal of Engineering Research and Applications
(IJERA) ISSN: 2248-9622 www.ijera.com
Vol. 2, Issue 4, July-August 2012, pp.409-420
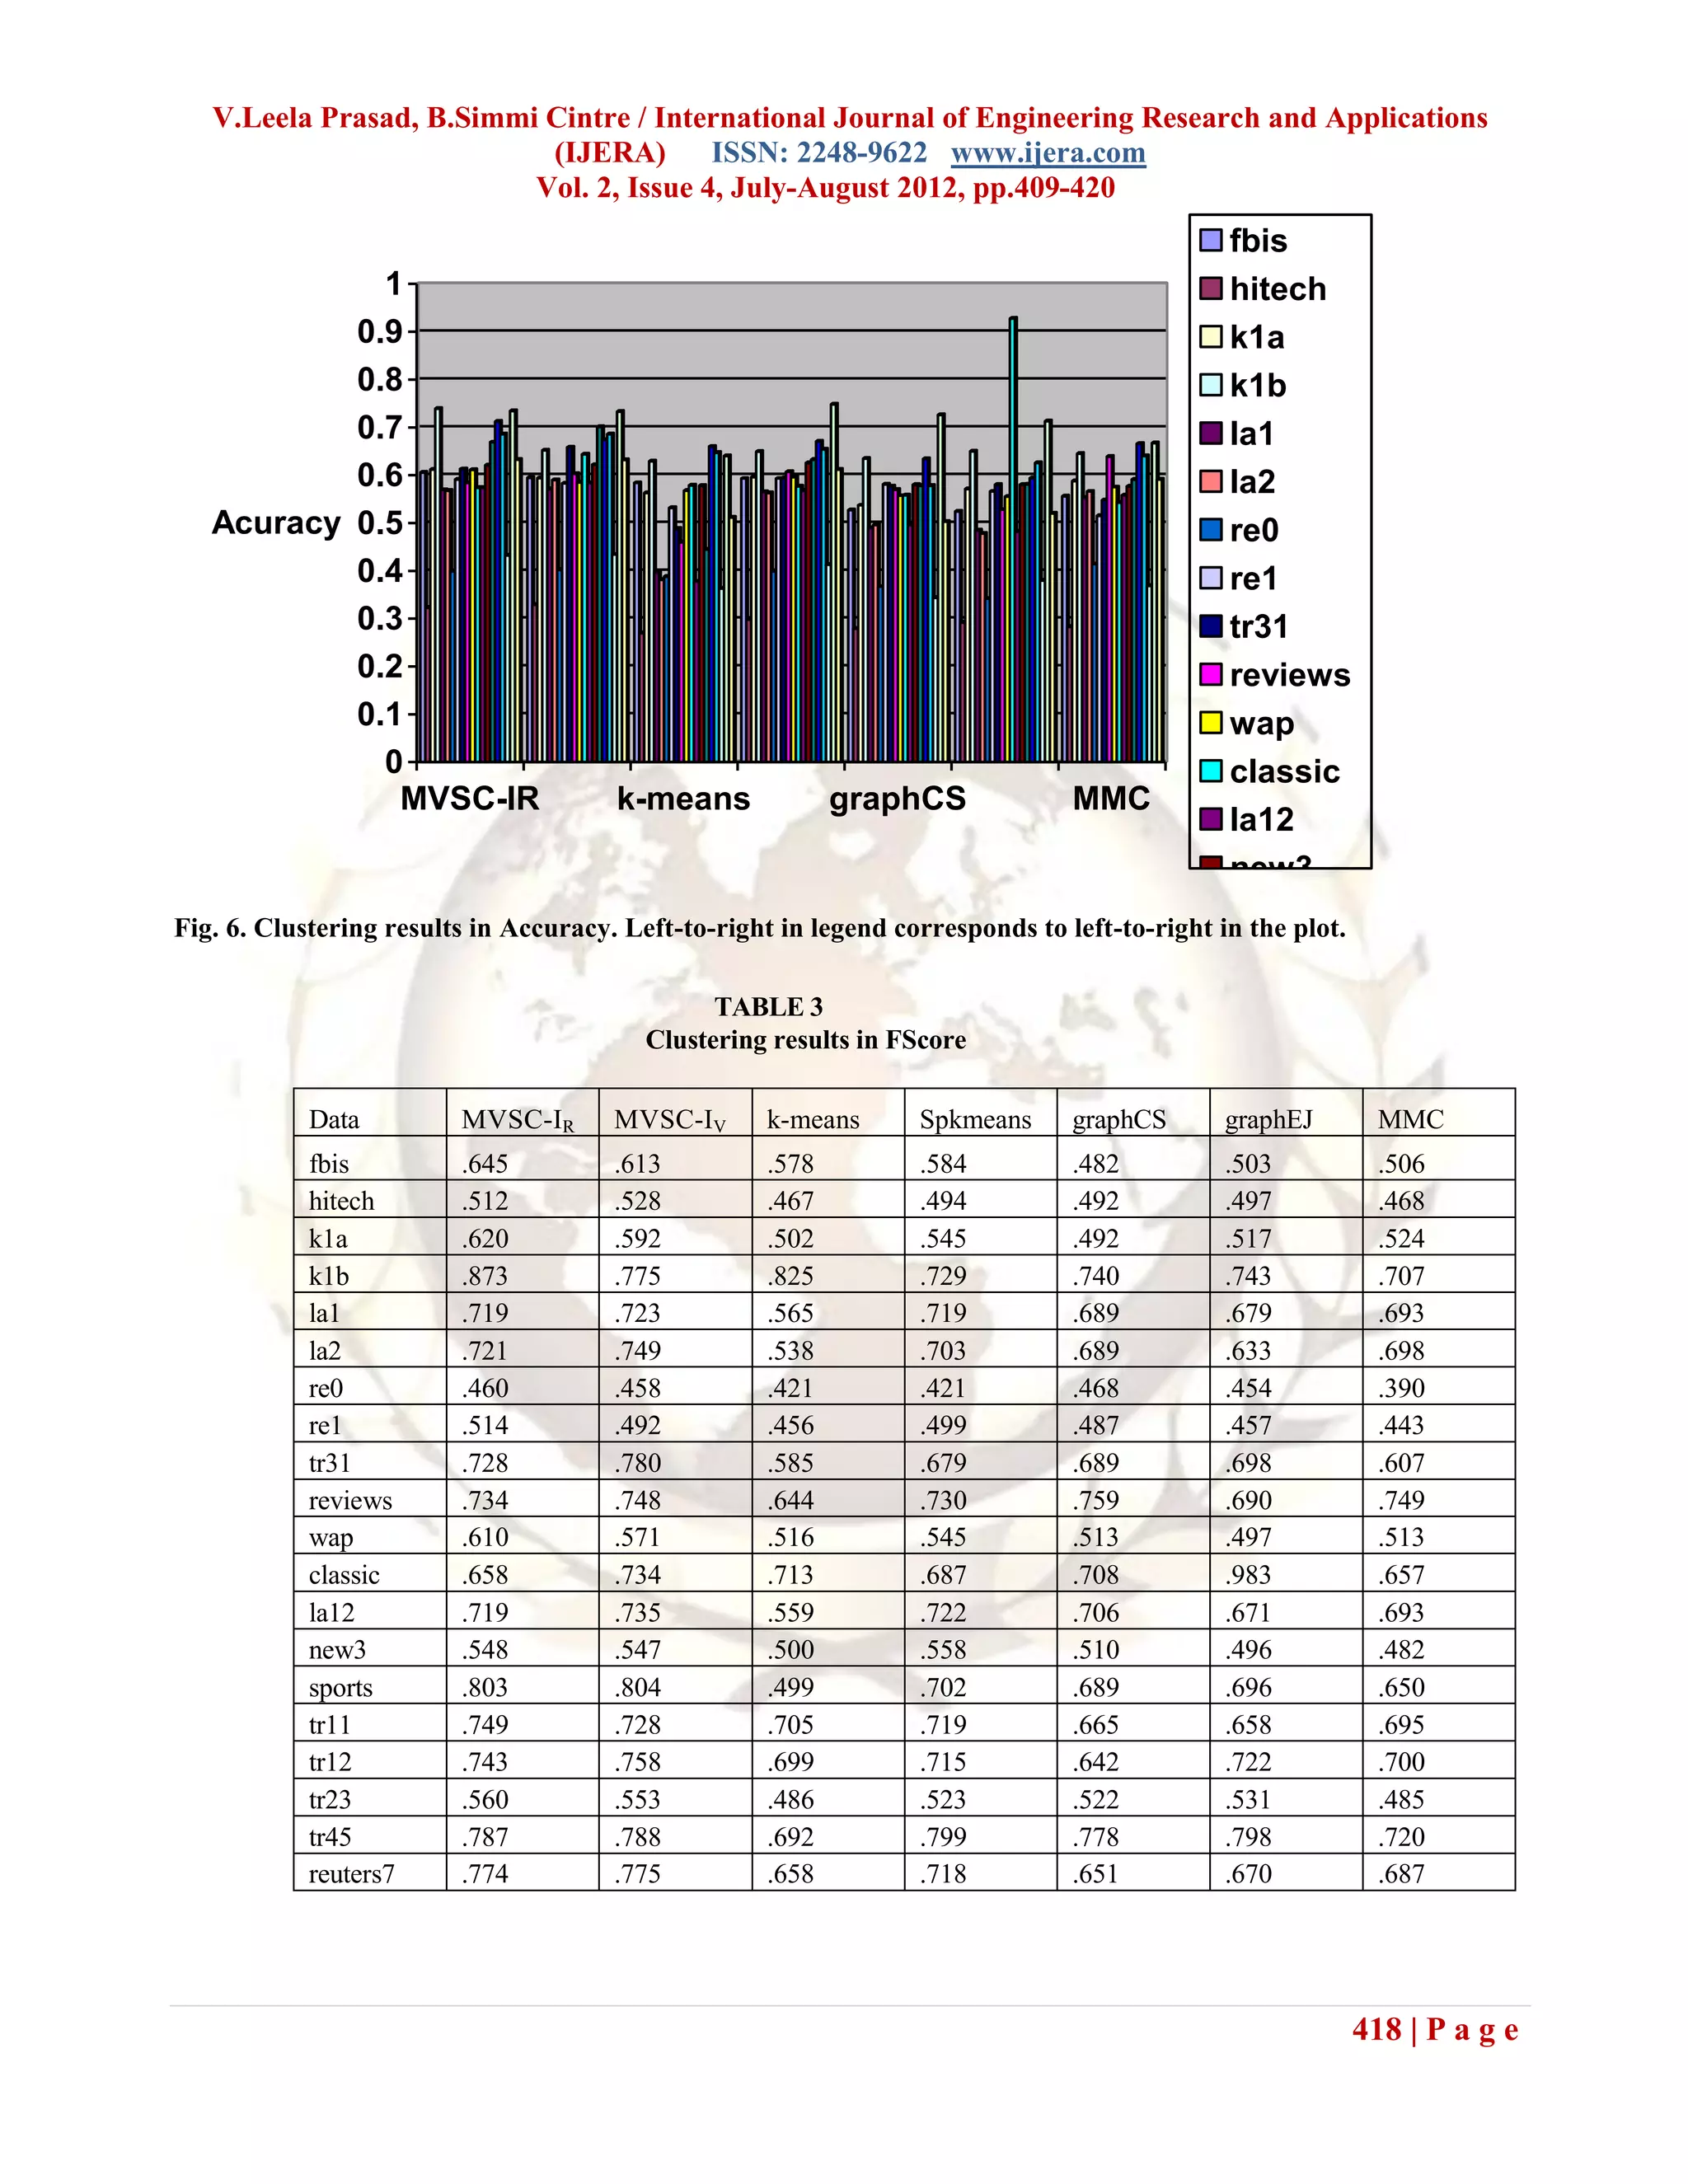
After a test run, clustering solution is evaluated
by comparing the documents’ assigned labels with their
true labels provided by the corpus. Three types of
external evaluation metric are used to assess clustering
TABLE 2 performance. They are the FScore, Normalized Mutual
Document datasets Information (NMI) and Accuracy. FScore is an equally
weighted combination of the ―precision‖ (P) and
Data Source c n m Balance ―recall‖(R) values used in information retrieval. Given a
clustering solution, FScore is determined as:
fbis TREC 17 2,463 2,000 0.075 k ni
hitech TREC 6 2,301 13,170 0.192 FScore= ∑ — max (Fi,j)
k1a WebACE 20 2,340 13,859 0.018 i=1 nj
k1b WebACE 6 2,340 13,859 0.043
la1 TREC 6 3,204 17,273 0.290 where ni denotes the number of documents in
la2 TREC 6 3,075 15,211 0.274 class i, nj the number of documents assigned to cluster j,
re0 Reuters 13 1,504 2,886 0.018 and ni,j the number of documents shared by class i and
re1 Reuters 25 1,657 3,758 0.027 cluster j. From another aspect, NMI measures the
tr31 TREC 7 927 10,127 0.006 information the true class partition and the cluster
c: # of classes, n: # of documents, m: # of words assignment share.It measures how much knowing about
Balance= (smallest class size)/(largest class size) the clusters helps us know about the classes.
Finally, Accuracy measures the fraction of documents
5.2 Experimental setup and evaluation that are correctly labels, assuming a one-to-one
correspondence between true classes and assigned
To demonstrate how well MVSCs can clusters. Let q denote any possible permutation of index
perform, we compare them with five other clustering set {1, . . . , k}, Accuracy is calculated by:
methods on the twenty datasets in Table 2. In
summary, the seven clustering algorithms are: 1 k
• MVSC-IR: MVSC using criterion function IR Accuracy = — max ∑ ni,q(i)
• MVSC-IV : MVSC using criterion function IV nq i=1
• k-means: standard k-means with Euclidean distance
• Spkmeans: spherical k-means with CS The best mapping q to determine Accuracy
• graphCS: CLUTO’s graph method with CS could be found by the Hungarian algorithm2. For all
• graphEJ: CLUTO’s graph with extended Jaccard three metrics, their range is from 0 to 1, and a greater
• MMC: Spectral Min-Max Cut algorithm [13] value indicates a better clustering solution.
Our MVSC-IR and MVSC-IV programs are 5.3 Results
implemented in Java. The regulating factor α in IR is Fig. 6 shows the Accuracy of the seven
always set at 0.3 during the experiments. We clustering algorithms on the twenty text collections.
observed that this is one of the most appropriate Presented in a different way, clustering results based on
values. A study on MVSC-IR’s performance relative FScore and NMI are reported in Table 3 and Table 4
to different α values is presented in a later section. The respectively. For each dataset in a row, the value in bold
other algorithms are provided by the C library and underlined is the best result, while the value in bold
interface which is available freely with the CLUTO only is the second to best. It can be observed that
toolkit [19]. For each dataset, cluster number is MVSC-IR and MVSC-IV perform consistently well. In
predefined equal to the number of true class, i.e. k = c. Fig. 6, 19 out of 20 datasets, except reviews, either both
None of the above algorithms are guaranteed to find or one of MVSC approaches are in the top two
global optimum, and all of them are algorithms. The next consistent performer is Spkmeans.
initializationdependent. Hence, for each method, we The other algorithms might work well on certain dataset.
performed clustering For example, graphEJ yields
a few times with randomly initialized values, and outstanding result on classic; graphCS and MMC are
chose the best trial in terms of the corresponding good on reviews. But they do not fare very well on the
objective function value. In all the experiments, each rest of the collections.
test run consisted of 10 trials. Moreover, the result To have a statistical justification of the
reported here on each dataset by a particular clustering clustering performance comparisons, we also carried out
method is the average of 10 test runs. statistical significance tests. Each of MVSC-IR and
416 | P a g e](https://image.slidesharecdn.com/bl24409420-121002052704-phpapp02/75/Bl24409420-8-2048.jpg)
![V.Leela Prasad, B.Simmi Cintre / International Journal of Engineering Research and Applications
(IJERA) ISSN: 2248-9622 www.ijera.com
Vol. 2, Issue 4, July-August 2012, pp.409-420
MVSC-IV was paired up with one of the remaining show, the advantage of MVSCIR and MVSC-IV over
algorithms for a paired t-test [32]. Given two paired the other methods is statistically significant. A special
sets X and Y of N measured values, the null case is the graphEJ algorithm. On the one hand, MVSC-
hypothesis of the test is that the differences between IR is not significantly better than graphEJ if based on
X and Y come from a population with mean 0. The FScore or NMI. On the other hand,
alternative hypothesis is that the paired sets differ when MVSC-IR and MVSC-IV are tested obviously
from each other in a significant way. In our better than graphEJ, the p-values can still be considered
experiment, these tests were done based on the relatively large, although they are smaller than 0.05. The
evaluation values obtained on the twenty datasets. reason is that, as observed before, graphEJ’s results on
The typical 5% significance level was used. For classic dataset are very different from those of the other
example, considering the pair (MVSC-IR, k-means), algorithms. While interesting, these values can be
from Table 3, it is seen that MVSC-IR dominates k- considered as outliers, and including them in the
means w.r.t. FScore. If the paired t-test returns a p- statistical tests would affect the outcomes greatly.
value smaller than 0.05, we reject the null hypothesis Hence, w e also report in Table 5 the tests where classic
and say that the dominance is significant. Otherwise, was excluded and only results on the other 19 datasets
the null hypothesis is true and the comparison is were used.
considered insignificant. The outcomes of the paired t-
tests are presented in Table 5. As the paired t-tests
fbis
1 hitech
0.9
k1a
0.8
k1b
0.7
la1
0.6
Acuracy 0.5 la2
0.4 re0
0.3 re1
0.2 tr31
0.1 reviews
0 wap
MVSC-IR k-means graphCS MMC classic
la12
new3
417 | P a g e](https://image.slidesharecdn.com/bl24409420-121002052704-phpapp02/75/Bl24409420-9-2048.jpg)
![V.Leela Prasad, B.Simmi Cintre / International Journal of Engineering Research and Applications
(IJERA) ISSN: 2248-9622 www.ijera.com
Vol. 2, Issue 4, July-August 2012, pp.409-420
TABLE 4
Clustering results in NMI
Data MVSC- MVSC- k-means Spkmeans graphCS graphEJ MMC
IR IV
fbis .606 .595 .584 .593 .527 .524 .556
hitech .323 .329 .270 .298 .279 .292 .283
k1a .612 .594 .563 .596 .537 .571 .588
k1b .739 .652 .629 .649 .635 .650 .645
la1 .569 .571 .397 .565 .490 .485 .553
la2 .568 .590 .381 .563 .496 .478 .566
re0 .399 .402 .388 .399 .367 .342 .414
re1 .591 .583 .532 .593 .581 .566 .515
tr31 .613 .658 .488 .594 .577 .580 .548
reviews .584 .603 .460 .607 .570 .528 .639
wap .611 .585 .568 .596 .557 .555 .575
classic .574 .644 .579 .577 .558 .928 .543
la12 .574 .584 .378 .568 .496 .482 .558
new3 .621 .622 .578 .626 .580 .580 .577
sports .669 .701 .445 .633 .578 .581 .591
tr11 .712 .674 .660 .671 .634 .594 .666
tr12 .686 .686 .647 .654 .578 .626 .640
tr23 .432 .434 .363 .413 .344 .380 .369
tr45 .734 .733 .640 .748 .726 .713 .667
reuters7 .633 .632 .512 .612 .503 .520 .591
Under this circumstance, both MVSC-IR and MVSC-IV outperform graphEJ significantly with good p-values.
5.4 Effect of α on MVSC-IR’s performance with α = αi. The same transformation was applied to NMI
It has been known that criterion function based and Accuracy to yield relative NMI and relative Accuracy
partitional clustering methods can be sensitive to cluster respectively. MVSC-IR performs the best with an αi if its
size and balance. In the formulation of I R , there exists relative measure has a value of 1. Otherwise its relative
parameter α which is called the regulating factor, α Є [0, measure is greater than 1; the larger this value is, the
1]. To examine how the determination of α could affect worse MVSC-IR with αi performs in comparison with
MVSC-IR’s performance, we evaluated MVSC-IR with other settings of α. Finally, the average relative measures
different values of α from 0 to 1, with 0.1 incremental were calculated over all the datasets to present the overall
interval. The assessment was done based on the performance.
clustering results in NMI, FScore and Accuracy, each
averaged over all the twenty given datasets. Since the 6. CONCLUSIONS AND FUTURE WORK
evaluation metrics for different datasets could be very In this paper, we analyses a Multi-Viewpoint
different from each other, simply taking the average over based Similarity measuring method, named MVS.
all the datasets would not be very meaningful. Hence, we Theoretical analysis and empirical examples show that
employed the method used in [18] to transform the MVS is potentially more suitable for text documents than
metrics into relative metrics before averaging. On a the popular cosine similarity. Based on MVS, two
particular document collection S, the relative FScore criterion functions, IR and IV , and their respective
measure of MVSC-IR with α = αi is determined as clustering algorithms, MVSC-IR and MVSC-IV , have
following been introduced. Compared with other state-of-the-art
maxαj{FScore(IR; S, αj)} clustering methods that use different types of similarity
relative FScore (IR; S, αi) = ————————— measure, on a large number of document datasets and
FScore(IR; S, αi) under different evaluation metrics, the proposed
algorithms show that they could provide significantly
where αi, αj ∈ {0.0, 0.1, . . . , 1.0}, FScore(IR; S, αi) is improved clustering performance.
the FScore result on dataset S obtained by MVSC-IR
419 | P a g e](https://image.slidesharecdn.com/bl24409420-121002052704-phpapp02/75/Bl24409420-11-2048.jpg)
![V.Leela Prasad, B.Simmi Cintre / International Journal of Engineering Research and Applications
(IJERA) ISSN: 2248-9622 www.ijera.com
Vol. 2, Issue 4, July-August 2012, pp.409-420
The key contribution of this paper is the fundamental [13] C. Ding, X. He, H. Zha, M. Gu, and H. Simon, ―A
concept of similarity measure from multiple viewpoints. min-max cut algorithm for graph partitioning and
Future methods could make use of the same principle, data clustering,‖ in IEEE ICDM, 2001, pp. 107–
but define alternative forms or the relative similarity , or 114.
do not use average but have other methods to combine [14] H. Zha, X. He, C. H. Q. Ding, M. Gu, and H. D.
the relative similarities according to the different Simon, ―Spectral relaxation for k-means
viewpoints. Besides, this paper focuses on partitional clustering,‖ in NIPS, 2001, pp. 1057–1064.
clustering of documents. In the future, it would also be [15] J. Shi and J. Malik, ―Normalized cuts and image
possible to apply the proposed criterion functions for segmentation,‖ IEEE Trans. Pattern Anal. Mach.
hierarchical clustering algorithms. Finally, we have Intell., vol. 22, pp. 888–905, 2000.
shown the application of MVS and its clustering [16] I. S. Dhillon, ―Co-clustering documents and words
algorithms for text data. It would be interesting to using bipartite spectral graph partitioning,‖ in
explore how they work on other types of sparse and KDD, 2001, pp. 269–274.
high-dimensional. [17] Y. Gong and W. Xu, Machine Learning for
Multimedia Content Analysis. Springer-Verlag
REFERENCES New York, Inc., 2007.
[1] D. Arthur and S. Vassilvitskii. k-means++ the [18] Y. Zhao and G. Karypis, ―Empirical and theoretical
advantages of careful seeding. In Symposium on comparisons of selected criterion functions for
Discrete Algorithms, 2007. document clustering,‖ Mach. Learn., vol. 55, no.
[2] M. Craven, D. DiPasquo, A. McCallum, T. 3, pp. 311–331, Jun 2004.
Mitchell, K. Nigam, and S. Slattery. Learning to [19] G. Karypis, ―CLUTO a clustering toolkit,‖ Dept. of
extract symbolic knowledge from the world wide Computer Science, Uni. of Minnesota, Tech. Rep.,
web. In AAAI-98, 1998. 2003,
[3] D. R. Cutting, J. O. Pedersen, D. R. Karger, and J. http://glaros.dtc.umn.edu/gkhome/views/cluto.
W. Tukey. Scatter/gather: A cluster-based [20] A. Strehl, J. Ghosh, and R. Mooney, ―Impact of
approach to browsing large document collections. similarity measures on web-page clustering,‖ in
In Proceedings of the ACM SIGIR, 1992. Proc. of the 17th National Conf. on Artif. Intell.:
[4] M. Ester, H.-P. Kriegel, J. Sander, and X. Xu. A Workshop of Artif. Intell. for Web Search. AAAI,
density-based algorithm for discovering clusters Jul. 2000, pp. 58–64.
in large spatial databases with noise. In [21] A. Ahmad and L. Dey, ―A method to compute
Proceedings of 2nd International Conference on distance between two categorical values of same
KDD, 1996. attribute in unsupervised learning for categorical
[5] N. Friburger and D. Maurel. Textual similarity data set,‖ Pattern Recognit. Lett., vol. 28, no. 1, pp.
based on proper names. In Proceedings of 110 – 118, 2007.
Workshop on Mathematical Formal Methods in [22] D. Ienco, R. G. Pensa, and R. Meo, ―Context-based
Information Retrieval at th 25th ACM SIGIR distance learning for categorical data clustering,‖ in
Conference, 2002. Proc. of the 8th Int. Symp. IDA, 2009, pp. 83–94.
[7] M. Pelillo, ―What is a cluster? Perspectives from [23] P. Lakkaraju, S. Gauch, and M. Speretta,
game theory,‖ in Proc. of the NIPS Workshop on ―Document similarity based on concept tree
Clustering Theory, 2009. distance,‖ in Proc. of the 19th ACM conf. on
[8] D. Lee and J. Lee, ―Dynamic dissimilarity Hypertext and hypermedia, 2008, pp. 127–132.
measure for support based clustering,‖ IEEE [24] H. Chim and X. Deng, ―Efficient phrase-based
Trans. on Knowl. and Data Eng., vol. 22, no. 6, document similarity for clustering,‖ IEEE Trans.
pp. 900–905, 2010. on Knowl. and Data Eng., vol. 20, no. 9, pp. 1217–
[9] A. Banerjee, I. Dhillon, J. Ghosh, and S. Sra, 1229, 2008.
―Clustering on the unit hypersphere using von [25] S. Flesca, G. Manco, E. Masciari, L. Pontieri, and
Mises-Fisher distributions,‖ J. Mach. Learn. Res., A. Pugliese, ―Fast detection of xml structural
vol. 6, pp. 1345–1382, Sep 2005. similarity,‖ IEEE Trans. on Knowl. And Data Eng.,
[10] W. Xu, X. Liu, and Y. Gong, ―Document vol. 17, no. 2, pp. 160–175, 2005.
clustering based on nonnegative matrix [26] E.-H. Han, D. Boley, M. Gini, R. Gross, K. Hastings,
factorization,‖ in SIGIR, 2003, pp. 267–273. G. Karypis, V. Kumar, B. Mobasher, and J.
[11] I. S. Dhillon, S. Mallela, and D. S. Modha, Moore, ―Webace: a web agent for document
―Information-theoretic co-clustering,‖ in KDD, categorization and exploration,‖ in AGENTS ’98:
2003, pp. 89–98. Proc. of the 2nd ICAA, 1998, pp. 408–415.
[12] C. D. Manning, P. Raghavan, and H. Sch ¨ utze,
An Introduction to Information Retrieval. Press,
Cambridge U., 2009.
420 | P a g e](https://image.slidesharecdn.com/bl24409420-121002052704-phpapp02/75/Bl24409420-12-2048.jpg)

This document summarizes a research paper that introduces a novel multi-viewpoint similarity measure for clustering text documents. The paper begins with background on commonly used similarity measures like Euclidean distance and cosine similarity. It then presents the novel multi-viewpoint measure, which considers multiple viewpoints (objects not assumed to be in the same cluster) rather than a single viewpoint. The paper proposes two new clustering criterion functions based on this measure and compares them to other algorithms on benchmark datasets. The goal is to develop a similarity measure and clustering methods that provide high-quality, consistent performance like k-means but can better handle sparse, high-dimensional text data.