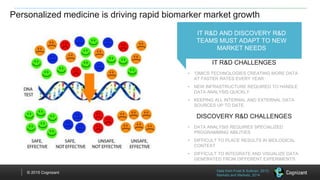
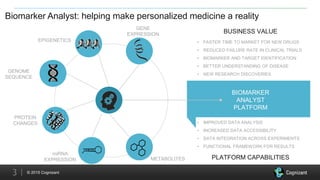
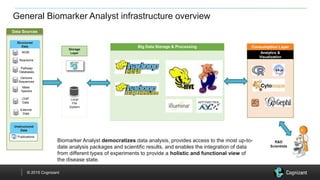
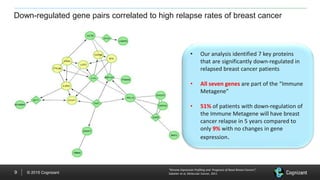
© 2015 Cognizant
© 2015 Cognizant
June 8, 2015
Biomarker and Target Analyst: A new platform using
data science to improve Pharma R&D outcomes
Camille Diges, PhD
© 2015 Cognizant
Personalized medicine is driving rapid biomarker market growth
Data from Frost & Sullivan, 2013;
Markets and Markets, 2014
IT R&D AND DISCOVERY R&D
TEAMS MUST ADAPT TO NEW
MARKET NEEDS
IT R&D CHALLENGES
• ‘OMICS TECHNOLOGIES CREATING MORE DATA
AT FASTER RATES EVERY YEAR
• NEW INFRASTRUCTURE REQUIRED TO HANDLE
DATA ANALYSIS QUICKLY
• KEEPING ALL INTERNAL AND EXTERNAL DATA
SOURCES UP TO DATE
DISCOVERY R&D CHALLENGES
• DATA ANALYSIS REQUIRES SPECIALIZED
PROGRAMMING ABILITIES
• DIFFICULT TO PLACE RESULTS IN BIOLOGICAL
CONTEXT
• DIFFICULT TO INTEGRATE AND VISUALIZE DATA
GENERATED FROM DIFFERENT EXPERIMENTS
© 2015 Cognizant3
Biomarker Analyst: helping make personalized medicine a reality
METABOLITES
BIOMARKER
ANALYST
PLATFORM
PROTEIN
CHANGES
EPIGENETICS
GENE
EXPRESSION
GENOME
SEQUENCE
miRNA
EXPRESSION
• IMPROVED DATA ANALYSIS
• INCREASED DATA ACCESSIBILITY
• DATA INTEGRATION ACROSS EXPERIMENTS
• FUNCTIONAL FRAMEWORK FOR RESULTS
PLATFORM CAPABILITIES
BUSINESS VALUE
• FASTER TIME TO MARKET FOR NEW DRUGS
• REDUCED FAILURE RATE IN CLINICAL TRIALS
• BIOMARKER AND TARGET IDENTIFICATION
• BETTER UNDERSTANDING OF DISEASE
• NEW RESEARCH DISCOVERIES
© 2015 Cognizant
Biomarker Analyst: Combining experimental analysis with functional information
Data Sources
Gene expression
DNA Sequencing
Epigenetic Data
Pathway Databases
Biomarker Analyst
Proteomic Data
© 2015 Cognizant
General Biomarker Analyst infrastructure overview
Storage
Layer
Data Sources
Structured
Data
Unstructured
Data
Publications
NCBI
Reactome
Pathway
Databases
Genome
Sequences
Mass
Spectra
ChIP
Data
External
Data
Local
File
System
Big Data Storage & Processing Consumption Layer
Analytics &
Visualization
R&D
Scientists
Biomarker Analyst democratizes data analysis, provides access to the most up-to-
date analysis packages and scientific results, and enables the integration of data
from different types of experiments to provide a holistic and functional view of
the disease state.
© 2015 Cognizant
Proof of Concept: Identifying new biomarkers for
breast cancer relapse
© 2015 Cognizant7
Application: Linking gene expression to phenotype to identify biomarkers
Client Challenge:
• “Biomarkers” routinely identified, but fail at various stages of drug
development. Costly failures ($MM).
• Gene expression data is time consuming and statistically challenging
to analyze. Misinterpretation is common. No functional information.
• Biomarker success dependent on understanding its function.
Cognizant Solution:
• Cognizant coupled gene expression analysis to signaling pathway
data to identify functional biomarkers for breast cancer relapse
• Differential gene expression algorithms implemented to add rigor to
data analysis
• Hadoop and R used to decrease processing time from days to hours
Client Benefit:
• Differential gene expression analysis reduced candidate biomarkers from
2,300+ genes to 10 gene pairs
• 7 potential biomarkers identified for breast cancer relapse when placed in
functional context
Industry
Pharmaceutical
Environment
Hadoop
R, Rstudio
NCBI
Challenge
Data normalization
Statistical analysis
Identification of important gene pairs
Cognizant Solution
Automate process to shorten
analysis time from days to minutes
Client Benefit
BM Identification
Functional analysis of BM
Companion tests
Companion diagnostics
© 2015 Cognizant
Biomarker Analyst places results in a functional context
Microarray
Data from
GEO
Pathway
Data
Data
Collection
Generating Possible Pairs on Pathway
List of
Differential
Gene Paris
List of Gene
Pairs on inter-
connected
Pathways
Joint Lists of Gene PairsMap Pairs on Pathway MapBio-Marker
Network Charts
Grouping
Normalization
Name Matching
ANOVA Test
Filter
Differential
Genes
Correlation for
all pairs of
differential
genes
Keep strongly
related gene
pairs only
• Use the Differential Genes to form pairs
• Examine pairs in the functional context of Reactome Pathways
Phase1
Phase2
Phase 3
Note:
• Gene Selection, Pearson’s Correlation in Phase 1 AND Generating Pairs on Pathway in Phase 2 improved by applying Hadoop
• If desired, Gene Selection Step may be taken out from process to keep more genes after Hadoop applied.
© 2015 Cognizant9
Down-regulated gene pairs correlated to high relapse rates of breast cancer
“Kinome Expression Profiling and Prognosis of Basal Breast Cancers”,
Sabatier et al, Molecular Cancer, 2011
• Our analysis identified 7 key proteins
that are significantly down-regulated in
relapsed breast cancer patients
• All seven genes are part of the “Immune
Metagene”
• 51% of patients with down-regulation of
the Immune Metagene will have breast
cancer relapse in 5 years compared to
only 9% with no changes in gene
expression.
© 2015 Cognizant10
Biomarker Analyst Platform: Additional Features
• Multiple data sources for analysis to reflect complexity of experimental
landscape
• DNA sequencing, metabolomic and proteomic data, CHiP-Seq and RNA-Seq
• Capable of working with any signaling pathway databases
• Ingenuity IPA, GeneGo, Pathway Studio, KEGG, etc.
• Integrate results from different experiment types
• Not possible currently due to data handling, analytical, and statistical challenges
• Customize visualization of results
• Designed to meet scientific needs
• Phase 2 will automatically connect results to key publications using semantic
technology
• Provide instant scientific context for results
© 2015 Cognizant
Camille Diges
Camille.Diges@Cognizant.com

Biomarker Analyst_Presentation_For_Client

  • 1.
    © 2015 Cognizant ©2015 Cognizant June 8, 2015 Biomarker and Target Analyst: A new platform using data science to improve Pharma R&D outcomes Camille Diges, PhD
  • 2.
    © 2015 Cognizant Personalizedmedicine is driving rapid biomarker market growth Data from Frost & Sullivan, 2013; Markets and Markets, 2014 IT R&D AND DISCOVERY R&D TEAMS MUST ADAPT TO NEW MARKET NEEDS IT R&D CHALLENGES • ‘OMICS TECHNOLOGIES CREATING MORE DATA AT FASTER RATES EVERY YEAR • NEW INFRASTRUCTURE REQUIRED TO HANDLE DATA ANALYSIS QUICKLY • KEEPING ALL INTERNAL AND EXTERNAL DATA SOURCES UP TO DATE DISCOVERY R&D CHALLENGES • DATA ANALYSIS REQUIRES SPECIALIZED PROGRAMMING ABILITIES • DIFFICULT TO PLACE RESULTS IN BIOLOGICAL CONTEXT • DIFFICULT TO INTEGRATE AND VISUALIZE DATA GENERATED FROM DIFFERENT EXPERIMENTS
  • 3.
    © 2015 Cognizant3 BiomarkerAnalyst: helping make personalized medicine a reality METABOLITES BIOMARKER ANALYST PLATFORM PROTEIN CHANGES EPIGENETICS GENE EXPRESSION GENOME SEQUENCE miRNA EXPRESSION • IMPROVED DATA ANALYSIS • INCREASED DATA ACCESSIBILITY • DATA INTEGRATION ACROSS EXPERIMENTS • FUNCTIONAL FRAMEWORK FOR RESULTS PLATFORM CAPABILITIES BUSINESS VALUE • FASTER TIME TO MARKET FOR NEW DRUGS • REDUCED FAILURE RATE IN CLINICAL TRIALS • BIOMARKER AND TARGET IDENTIFICATION • BETTER UNDERSTANDING OF DISEASE • NEW RESEARCH DISCOVERIES
  • 4.
    © 2015 Cognizant BiomarkerAnalyst: Combining experimental analysis with functional information Data Sources Gene expression DNA Sequencing Epigenetic Data Pathway Databases Biomarker Analyst Proteomic Data
  • 5.
    © 2015 Cognizant GeneralBiomarker Analyst infrastructure overview Storage Layer Data Sources Structured Data Unstructured Data Publications NCBI Reactome Pathway Databases Genome Sequences Mass Spectra ChIP Data External Data Local File System Big Data Storage & Processing Consumption Layer Analytics & Visualization R&D Scientists Biomarker Analyst democratizes data analysis, provides access to the most up-to- date analysis packages and scientific results, and enables the integration of data from different types of experiments to provide a holistic and functional view of the disease state.
  • 6.
    © 2015 Cognizant Proofof Concept: Identifying new biomarkers for breast cancer relapse
  • 7.
    © 2015 Cognizant7 Application:Linking gene expression to phenotype to identify biomarkers Client Challenge: • “Biomarkers” routinely identified, but fail at various stages of drug development. Costly failures ($MM). • Gene expression data is time consuming and statistically challenging to analyze. Misinterpretation is common. No functional information. • Biomarker success dependent on understanding its function. Cognizant Solution: • Cognizant coupled gene expression analysis to signaling pathway data to identify functional biomarkers for breast cancer relapse • Differential gene expression algorithms implemented to add rigor to data analysis • Hadoop and R used to decrease processing time from days to hours Client Benefit: • Differential gene expression analysis reduced candidate biomarkers from 2,300+ genes to 10 gene pairs • 7 potential biomarkers identified for breast cancer relapse when placed in functional context Industry Pharmaceutical Environment Hadoop R, Rstudio NCBI Challenge Data normalization Statistical analysis Identification of important gene pairs Cognizant Solution Automate process to shorten analysis time from days to minutes Client Benefit BM Identification Functional analysis of BM Companion tests Companion diagnostics
  • 8.
    © 2015 Cognizant BiomarkerAnalyst places results in a functional context Microarray Data from GEO Pathway Data Data Collection Generating Possible Pairs on Pathway List of Differential Gene Paris List of Gene Pairs on inter- connected Pathways Joint Lists of Gene PairsMap Pairs on Pathway MapBio-Marker Network Charts Grouping Normalization Name Matching ANOVA Test Filter Differential Genes Correlation for all pairs of differential genes Keep strongly related gene pairs only • Use the Differential Genes to form pairs • Examine pairs in the functional context of Reactome Pathways Phase1 Phase2 Phase 3 Note: • Gene Selection, Pearson’s Correlation in Phase 1 AND Generating Pairs on Pathway in Phase 2 improved by applying Hadoop • If desired, Gene Selection Step may be taken out from process to keep more genes after Hadoop applied.
  • 9.
    © 2015 Cognizant9 Down-regulatedgene pairs correlated to high relapse rates of breast cancer “Kinome Expression Profiling and Prognosis of Basal Breast Cancers”, Sabatier et al, Molecular Cancer, 2011 • Our analysis identified 7 key proteins that are significantly down-regulated in relapsed breast cancer patients • All seven genes are part of the “Immune Metagene” • 51% of patients with down-regulation of the Immune Metagene will have breast cancer relapse in 5 years compared to only 9% with no changes in gene expression.
  • 10.
    © 2015 Cognizant10 BiomarkerAnalyst Platform: Additional Features • Multiple data sources for analysis to reflect complexity of experimental landscape • DNA sequencing, metabolomic and proteomic data, CHiP-Seq and RNA-Seq • Capable of working with any signaling pathway databases • Ingenuity IPA, GeneGo, Pathway Studio, KEGG, etc. • Integrate results from different experiment types • Not possible currently due to data handling, analytical, and statistical challenges • Customize visualization of results • Designed to meet scientific needs • Phase 2 will automatically connect results to key publications using semantic technology • Provide instant scientific context for results
  • 11.
    © 2015 Cognizant CamilleDiges Camille.Diges@Cognizant.com

Editor's Notes

  • #8 In 2014, there’s an increased threat surface driven by: Data proliferation: PII data, identification, classification, breaches, data loss, ILM Platform proliferation: Cloud, BYOD Access proliferation: Enterprise, cloud, social, partner ecosystems