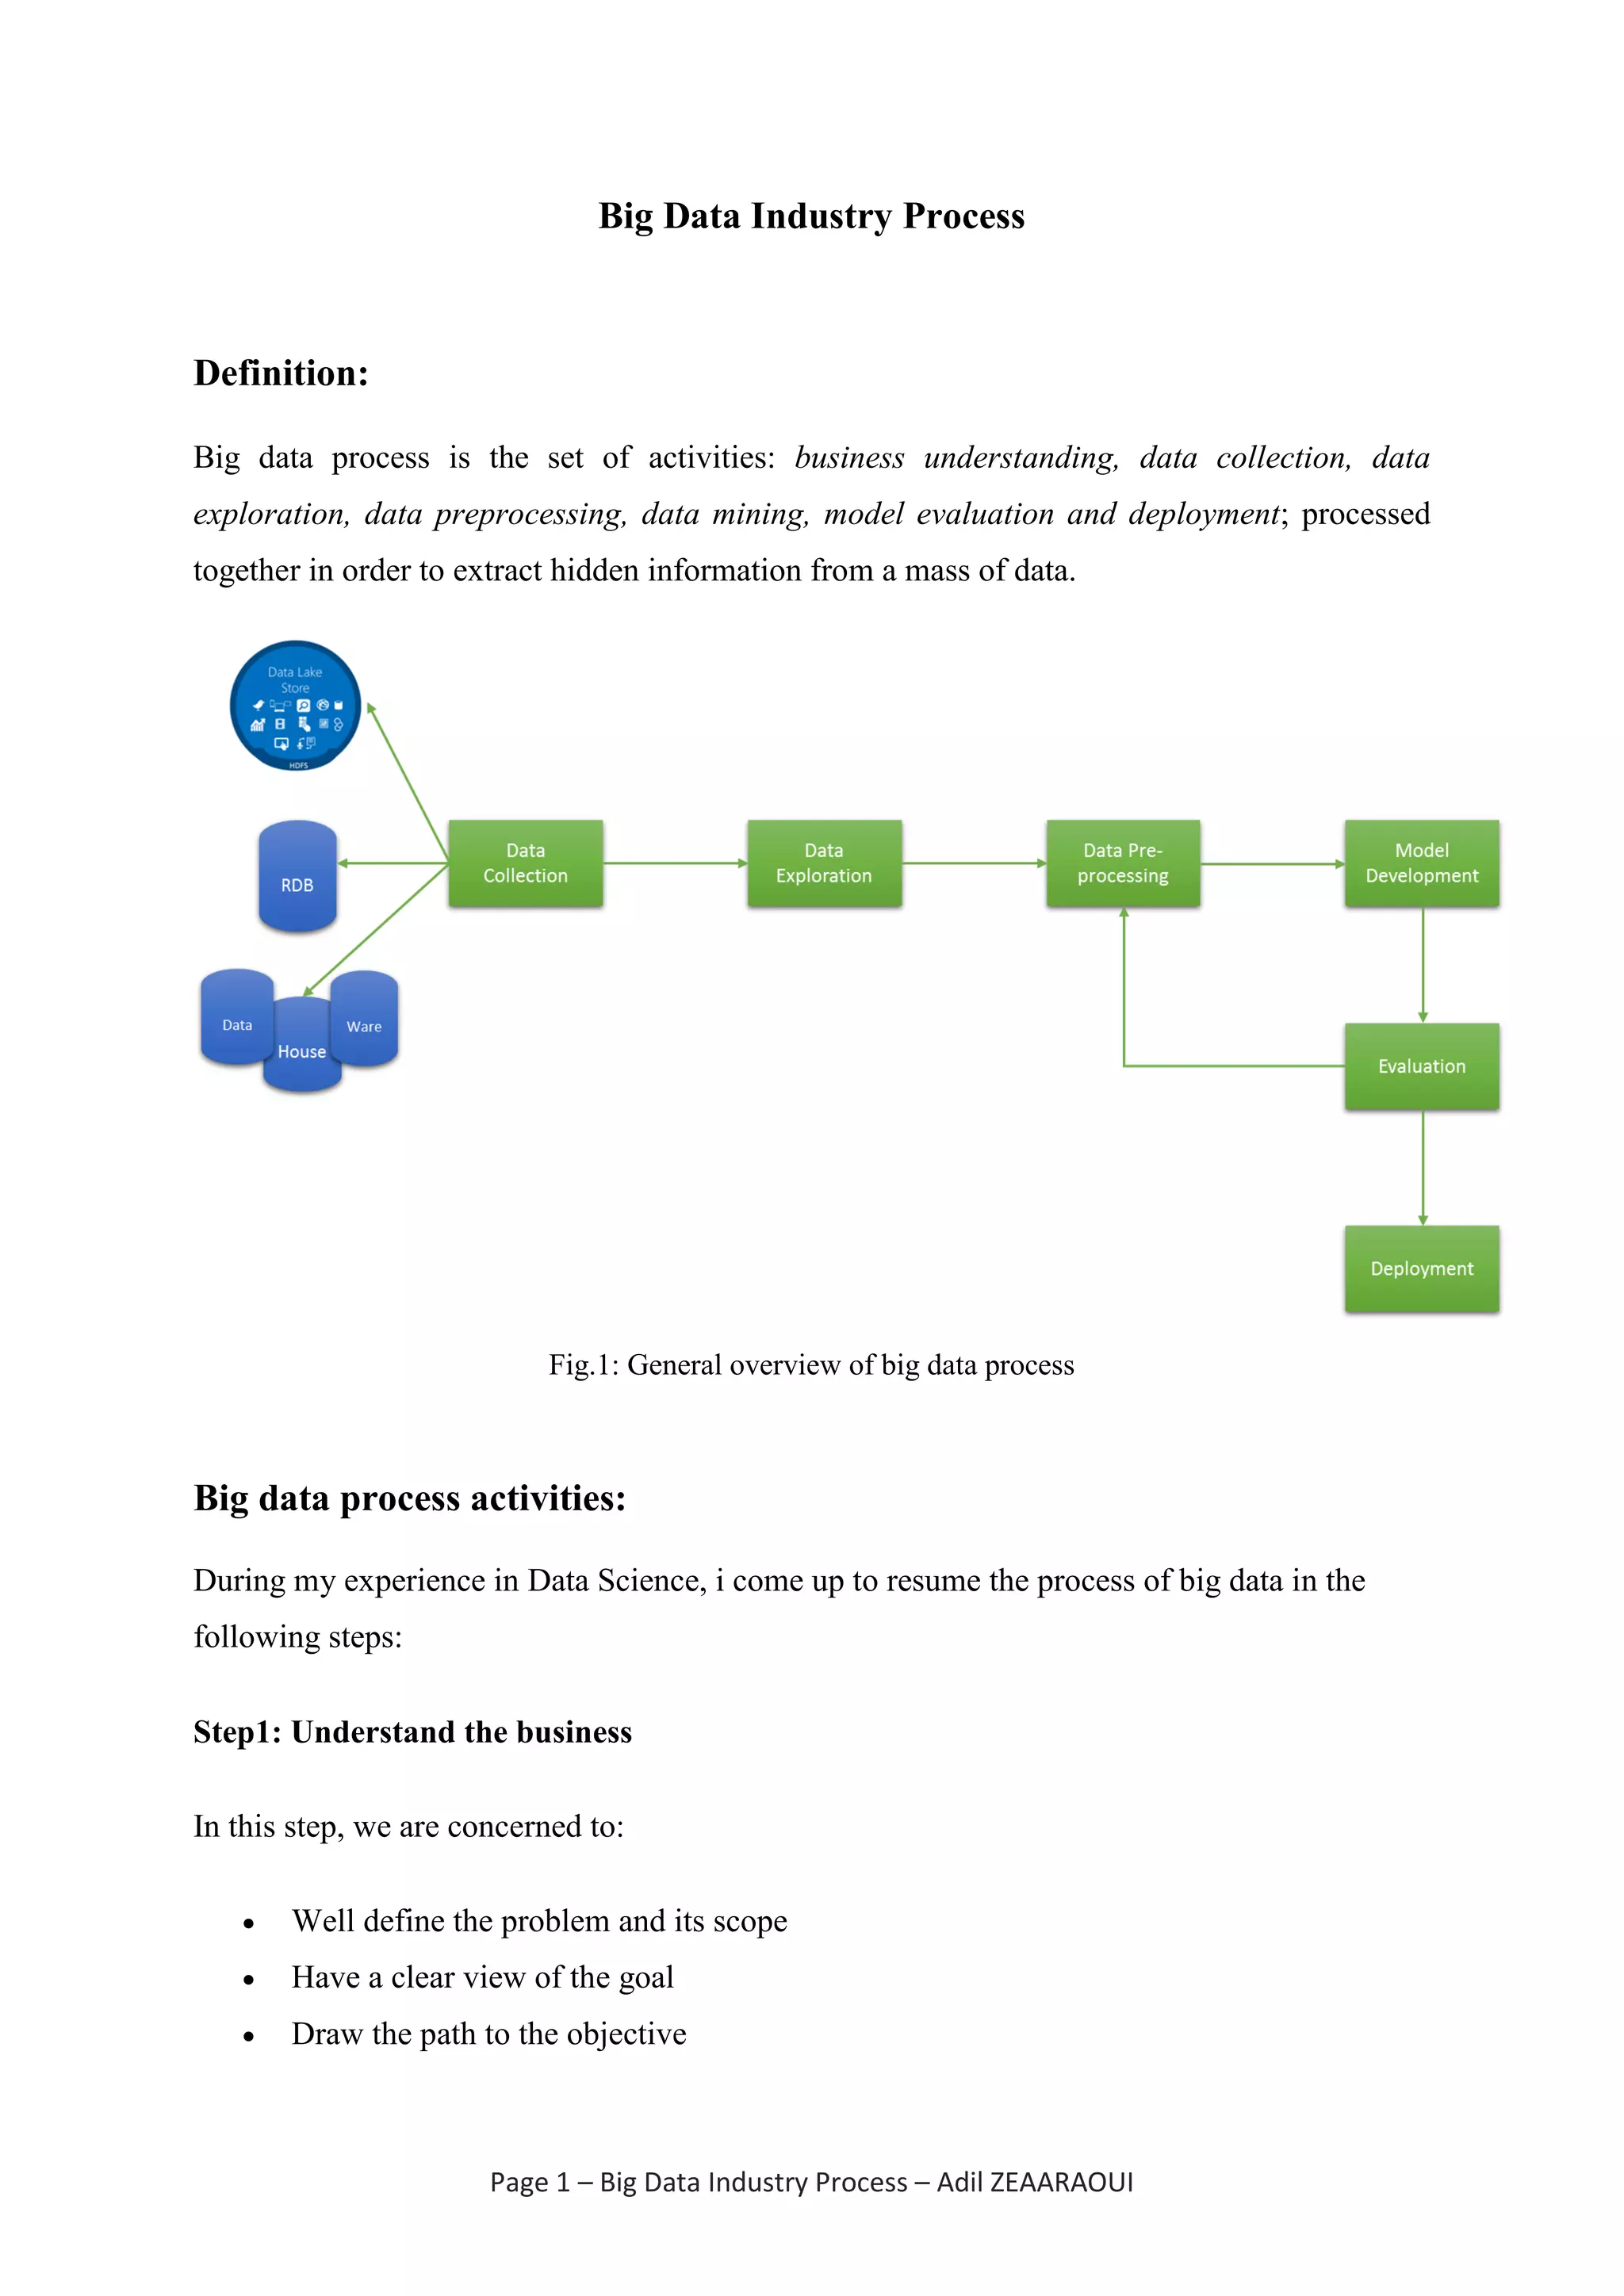
This presentation lists the activities of big data industry. Those activities are : business understanding, data collection, data exploration, data preprocessing, data mining, model evaluation and deployment
Lecture 1.13 & 1.14 &1.15_Business Profiles in Big Data.pptxRATISHKUMAR32
The presentation contain the business profiles in big data analytics. through this ppt user can learn about the different case studies such as facebook and walmart. This ppt contain the information and seven characteristics that are required to learn the basics of big data.
Prescriptive analytics is the process of analyzing data to provide recommendations on how to optimize business practices based on multiple predicted outcomes. It is the third and final tier of modern data processing, after descriptive analytics which analyzes current data, and predictive analytics which predicts future behavior based on models. Prescriptive analytics utilizes machine learning, business rules, AI and algorithms to simulate various approaches to numerous outcomes and suggest the best possible actions. Data mining is the process of analyzing raw data to identify patterns and extract useful information that can help companies improve marketing strategies and sales. Process mining involves analyzing event logs from enterprise systems to understand processes and identify inefficiencies.
This document provides an introduction to data science concepts. It discusses the components of data science including statistics, visualization, data engineering, advanced computing, and machine learning. It also covers the advantages and disadvantages of data science, as well as common applications. Finally, it outlines the six phases of the data science process: framing the problem, collecting and processing data, exploring and analyzing data, communicating results, and measuring effectiveness.
Big data analytics (BDA) involves examining large, diverse datasets to uncover hidden patterns, correlations, trends, and insights. BDA helps organizations gain a competitive advantage by extracting insights from data to make faster, more informed decisions. It supports a 360-degree view of customers by analyzing both structured and unstructured data sources like clickstream data. Businesses can leverage techniques like machine learning, predictive analytics, and natural language processing on existing and new data sources. BDA requires close collaboration between IT, business users, and data scientists to process and analyze large datasets beyond typical storage and processing capabilities.
Dr. Windu Gata is an internal trainer, IT consultant, and lecturer who has specialized in data science since 2008. The document discusses data science, including defining data and data warehousing. It explains that data science combines various fields like mathematics, programming, analytics, and machine learning to uncover insights from data to guide decision making. The CRISP-DM process for data mining is also summarized, which includes business understanding, data understanding, data preparation, modeling, evaluation, and deployment phases to build and assess models. Finally, common data mining techniques like regression, classification, association, and clustering are briefly explained.
Data mining involves analyzing large datasets to discover patterns and extract useful information. It has evolved from early methods like regression analysis and involves techniques from machine learning, statistics, and databases. Data mining is used for applications like market analysis, fraud detection, customer retention, and science exploration by performing descriptive tasks like frequent pattern mining and associations or classification/prediction tasks. It involves preprocessing data, extracting patterns, and evaluating and presenting results.
"Industrializing Machine Learning – How to Integrate ML in Existing Businesse...Dataconomy Media
"Industrializing Machine Learning – How to Integrate ML in Existing Businesses", Erik Schmiegelow, CEO at Hivemind Technologies AG
Watch more from Data Natives Berlin 2016 here: http://bit.ly/2fE1sEo
Visit the conference website to learn more: www.datanatives.io
Follow Data Natives:
https://www.facebook.com/DataNatives
https://twitter.com/DataNativesConf
Stay Connected to Data Natives by Email: Subscribe to our newsletter to get the news first about Data Natives 2017: http://bit.ly/1WMJAqS
About the Author:
Since 1996, Erik Schmiegelow has worked as a software architecht and consultant, building large data processing platforms for companies such as NTT DoCoMo, Royal Mail, Siemens, E-Plus, Allianz and T-Mobile; and until 2001 he was CTO at the Cologne-based digital agency denkwerk.
In 2007 he founded the telecommunications consulting agency Itellity, followed by Hivemind Technologies in 2014. Hivemind Technologies is a solutions and services company, focussed on big data analytics and stream processing technologies for web, social data and industrial applications. Erik studied computer sciences in Hamburg.
Data mining involves using analytical techniques to discover patterns in large data sets. It is used to gain insights into business problems like predicting customer behavior or identifying fraud. The key steps in data mining include requirement analysis, data collection/preparation, exploration of techniques, implementation/evaluation, and visualization of results. Applications include prediction, relationship marketing, customer profiling, outlier detection, and customer segmentation.
The data analysis process involves 5 steps: 1) defining the business problem or question, 2) collecting relevant quantitative and qualitative data, 3) cleaning the data by removing errors and outliers, 4) analyzing the cleaned data using techniques like regression analysis, and 5) sharing the results through reports, dashboards, and visualizations to support findings and recommendations.
This document provides an overview of business intelligence and its key components. It defines business intelligence as processes, technologies, and tools that help transform data into knowledge and plans to guide business decisions. The key components discussed include data mining, data warehousing, and data analysis. Data mining involves extracting patterns from large databases, data warehousing focuses on data storage, and data analysis is the process of inspecting, cleaning, transforming, and modeling data to support decision making.
This document provides an overview of signals and signal extraction methodology. It begins with defining a signal as a pattern that is indicative of an impending business outcome. Examples of signals in different industries are provided. The document then outlines a 9-step methodology for extracting signals from data, including defining the business problem, building a data model, conducting univariate and correlation analysis, building predictive models, creating a business narrative, and identifying actions and ROI. R commands for loading, manipulating, and analyzing data in R are also demonstrated. The key points are that signals can provide early warnings for business outcomes and the outlined methodology is a rigorous approach for extracting meaningful signals from data.
This document discusses how businesses can improve their operations using their own internal data. It begins by stating the objective is to learn how to use existing internal data to improve a business. It then outlines tips for taking advantage of internal data sources, locating data within a company, and using data enrichment. The document is divided into several sections that provide more details on topics like the advantages of internal data, data collection sources, data enrichment processes, and using data to build a brand.
This document provides an introduction to big data, including defining big data, discussing its history, importance, types, characteristics, how it works, challenges, technologies, and architecture. Big data is defined as extremely large and complex datasets that cannot be processed using traditional tools. It has existed for thousands of years but grew substantially in the 20th century. Companies use big data to improve operations and increase profits. The types include structured, semi-structured, and unstructured data. Big data works through data collection, storage, processing, analysis, and visualization. The challenges include rapid data growth, storage needs, unreliable data, and security issues. Technologies include those for operations and analytics. The architecture includes ingestion, batch processing, analytical storage
Business Intelligence and Analytics Unit-2 part-A .pptxRupaRani28
This document provides an overview of data mining, including its definition, process, applications, and challenges. Data mining involves analyzing large datasets to extract useful patterns and trends. It has several key steps: data is collected and loaded into warehouses, analysts determine how to organize it, software sorts and organizes the data, and it is presented to end users. Data mining is used by organizations in retail, finance, marketing and other industries to determine customer preferences and behaviors to help with decisions. While powerful, data mining also faces challenges to do with performance, data issues, and selecting the right techniques.
1) The document discusses data mining, which is defined as extracting information from large datasets. It can be used for applications like market analysis, fraud detection, and customer retention.
2) It explains the basics of data mining including the KDD (Knowledge Discovery in Databases) process and various data mining tasks and techniques.
3) The KDD process is described as the organized procedure for discovering useful patterns from large, complex datasets through steps like data cleaning, integration, selection, transformation, mining, evaluation and presentation.
A Data Warehouse And Business Intelligence ApplicationKate Subramanian
The document outlines a project to develop a real-time fraud detection system for banking transactions by capturing functional and non-functional requirements, including system capabilities, interfaces, performance needs, security requirements, and an overall design architecture. The goal is to help banks identify fraudulent transactions in real-time through analyzing banking data and transactions based on pre-defined rules to flag suspicious activity and prevent financial losses from fraud.
Data mining involves finding patterns in large datasets that can help improve business outcomes. It uses computer processes and statistical techniques to analyze datasets too large for manual review. The CRISP process standardizes the data mining workflow into six phases: business understanding, data understanding, data preparation, modeling, evaluation, and deployment. Key modeling techniques include supervised learning methods like decision trees and regression as well as unsupervised clustering. Ongoing evaluation and refinement of models is important as data and business needs change over time.
This lecture gives various definitions of Data Mining. It also gives why Data Mining is required. Various examples on Classification , Cluster and Association rules are given.
The 7 Key Steps To Build Your Machine Learning ModelRobert Smith
A machine learning model is a file that has been trained to recognize certain types of patterns. You train a model over a set of data, providing it an algorithm that it can use to reason over and learn from those data.
Data pipelines are the heart and soul of data science. Are you a beginner looking to understand data pipelines? A glimpse into what they are and how they work.
Mesos Meetup - Building an enterprise-ready analytics and operational ecosyst...Stratio
On November 6th, we got together at Google Campus to talk about Mesos and DC/OS.
Ignacio Mulas, Sparta & Spark Product Owner at Stratio, explained how to build an environment that can secure and govern its data for operational and analytical applications on top of DC/OS platform. He showed that analytical and machine learning pipelines can be combined with operational processes maintaining the security and providing governing tools to manage our data. He focused on the architecture and tools needed to achieve an ecosystem like this and we will show a demo of it. He also explained how we can develop our pipelines interactively with auto-discovered data catalogs and explore our results.
Find out more: https://www.stratio.com/events/discover-how-to-deploy-a-secure-big-data-pipeline-with-dcos/
BA is used to gain insights that inform business decisions and can be used to automate and optimize business processes. Data-driven companies treat their data as a corporate asset and leverage it for a competitive advantage. Successful business analytics depends on data quality, skilled analysts who understand the technologies and the business, and an organizational commitment to data-driven decision-making.
Business analytics examples
Business analytics techniques break down into two main areas. The first is basic business intelligence. This involves examining historical data to get a sense of how a business department, team or staff member performed over a particular time. This is a mature practice that most enterprises are fairly accomplished at using.
Data Quality in Data Warehouse and Business Intelligence Environments - Disc...Alan D. Duncan
Time and again, we hear about the failure of data warehouses – while things may be improving, they’re moving only slowly. One explanation data quality being overlooked is that the I.T. department is often responsible for delivering and operating the DWH/BI
environment. What ensues ends up being an agenda based on “how do we build it”, not a “why are we doing this”. This needs to change. In this discussion paper, I explore the issues of data quality in data warehouse, business intelligence and analytic environments, and propose an approach based on "Data Quality by Design"
This document discusses data quality issues related to missing and noisy data. It introduces the concept of data imputation, which is a technique used to replace missing values in a dataset. Common imputation methods discussed include replacing missing numeric values with the mean, median, or mode of existing values for that attribute. The document also discusses different types of missing data (MCAR, MAR, NMAR) and techniques for handling missing data such as discarding records or attributes with many missing values.
This document discusses what makes an effective data team. It begins with introductions from Alex Dean, CEO of Snowplow Analytics. It then discusses how Snowplow helps companies collect and analyze customer event data. The document outlines a hierarchy of needs for a data team, beginning with ensuring data is available and ending with data scientists doing industry-leading work. It provides advice on each level of the hierarchy to help data teams become more effective.
In this presentation, I have talked about Big Data and its importance in brief. I have included the very basics of Data Science and its importance in the present day, through a case study. You can also get an idea about who a data scientist is and what all tasks he performs. A few applications of data science have been illustrated in the end.
The document discusses data wrangling, which is the process of cleaning, organizing, and transforming raw data into a usable format for analysis. It defines data wrangling and describes the importance, benefits, common tools, and examples of data wrangling. It also outlines the typical iterative steps in data wrangling software and provides examples of data exploration, cleaning, and filtering in Python.
This document outlines a roadmap for developing a business intelligence project through 16 steps organized into 6 stages: justification, planning, business analysis, design, construction, and deployment. The stages involve assessing business needs, planning the project, analyzing requirements and data, designing databases and applications, building extract/transform/load processes and a metadata repository, implementing the system, and evaluating results to improve future releases. The goal is to provide effective decision support and business analytics through a well-planned and executed intelligence initiative.
End-to-end pipeline agility - Berlin Buzzwords 2024Lars Albertsson
We describe how we achieve high change agility in data engineering by eliminating the fear of breaking downstream data pipelines through end-to-end pipeline testing, and by using schema metaprogramming to safely eliminate boilerplate involved in changes that affect whole pipelines.
A quick poll on agility in changing pipelines from end to end indicated a huge span in capabilities. For the question "How long time does it take for all downstream pipelines to be adapted to an upstream change," the median response was 6 months, but some respondents could do it in less than a day. When quantitative data engineering differences between the best and worst are measured, the span is often 100x-1000x, sometimes even more.
A long time ago, we suffered at Spotify from fear of changing pipelines due to not knowing what the impact might be downstream. We made plans for a technical solution to test pipelines end-to-end to mitigate that fear, but the effort failed for cultural reasons. We eventually solved this challenge, but in a different context. In this presentation we will describe how we test full pipelines effectively by manipulating workflow orchestration, which enables us to make changes in pipelines without fear of breaking downstream.
Making schema changes that affect many jobs also involves a lot of toil and boilerplate. Using schema-on-read mitigates some of it, but has drawbacks since it makes it more difficult to detect errors early. We will describe how we have rejected this tradeoff by applying schema metaprogramming, eliminating boilerplate but keeping the protection of static typing, thereby further improving agility to quickly modify data pipelines without fear.
"Financial Odyssey: Navigating Past Performance Through Diverse Analytical Lens"sameer shah
Embark on a captivating financial journey with 'Financial Odyssey,' our hackathon project. Delve deep into the past performance of two companies as we employ an array of financial statement analysis techniques. From ratio analysis to trend analysis, uncover insights crucial for informed decision-making in the dynamic world of finance."
Learn SQL from basic queries to Advance queriesmanishkhaire30
Dive into the world of data analysis with our comprehensive guide on mastering SQL! This presentation offers a practical approach to learning SQL, focusing on real-world applications and hands-on practice. Whether you're a beginner or looking to sharpen your skills, this guide provides the tools you need to extract, analyze, and interpret data effectively.
Key Highlights:
Foundations of SQL: Understand the basics of SQL, including data retrieval, filtering, and aggregation.
Advanced Queries: Learn to craft complex queries to uncover deep insights from your data.
Data Trends and Patterns: Discover how to identify and interpret trends and patterns in your datasets.
Practical Examples: Follow step-by-step examples to apply SQL techniques in real-world scenarios.
Actionable Insights: Gain the skills to derive actionable insights that drive informed decision-making.
Join us on this journey to enhance your data analysis capabilities and unlock the full potential of SQL. Perfect for data enthusiasts, analysts, and anyone eager to harness the power of data!
#DataAnalysis #SQL #LearningSQL #DataInsights #DataScience #Analytics
Build applications with generative AI on Google CloudMárton Kodok
We will explore Vertex AI - Model Garden powered experiences, we are going to learn more about the integration of these generative AI APIs. We are going to see in action what the Gemini family of generative models are for developers to build and deploy AI-driven applications. Vertex AI includes a suite of foundation models, these are referred to as the PaLM and Gemini family of generative ai models, and they come in different versions. We are going to cover how to use via API to: - execute prompts in text and chat - cover multimodal use cases with image prompts. - finetune and distill to improve knowledge domains - run function calls with foundation models to optimize them for specific tasks. At the end of the session, developers will understand how to innovate with generative AI and develop apps using the generative ai industry trends.
Orchestrating the Future: Navigating Today's Data Workflow Challenges with Ai...Kaxil Naik
Navigating today's data landscape isn't just about managing workflows; it's about strategically propelling your business forward. Apache Airflow has stood out as the benchmark in this arena, driving data orchestration forward since its early days. As we dive into the complexities of our current data-rich environment, where the sheer volume of information and its timely, accurate processing are crucial for AI and ML applications, the role of Airflow has never been more critical.
In my journey as the Senior Engineering Director and a pivotal member of Apache Airflow's Project Management Committee (PMC), I've witnessed Airflow transform data handling, making agility and insight the norm in an ever-evolving digital space. At Astronomer, our collaboration with leading AI & ML teams worldwide has not only tested but also proven Airflow's mettle in delivering data reliably and efficiently—data that now powers not just insights but core business functions.
This session is a deep dive into the essence of Airflow's success. We'll trace its evolution from a budding project to the backbone of data orchestration it is today, constantly adapting to meet the next wave of data challenges, including those brought on by Generative AI. It's this forward-thinking adaptability that keeps Airflow at the forefront of innovation, ready for whatever comes next.
The ever-growing demands of AI and ML applications have ushered in an era where sophisticated data management isn't a luxury—it's a necessity. Airflow's innate flexibility and scalability are what makes it indispensable in managing the intricate workflows of today, especially those involving Large Language Models (LLMs).
This talk isn't just a rundown of Airflow's features; it's about harnessing these capabilities to turn your data workflows into a strategic asset. Together, we'll explore how Airflow remains at the cutting edge of data orchestration, ensuring your organization is not just keeping pace but setting the pace in a data-driven future.
Session in https://budapestdata.hu/2024/04/kaxil-naik-astronomer-io/ | https://dataml24.sessionize.com/session/667627
Orchestrating the Future: Navigating Today's Data Workflow Challenges with Ai...
Big data Industry Process
1. Page 1 – Big Data Industry Process – Adil ZEAARAOUI
Big Data Industry Process
Definition:
Big data process is the set of activities: business understanding, data collection, data
exploration, data preprocessing, data mining, model evaluation and deployment; processed
together in order to extract hidden information from a mass of data.
Fig.1: General overview of big data process
Big data process activities:
During my experience in Data Science, i come up to resume the process of big data in the
following steps:
Step1: Understand the business
In this step, we are concerned to:
Well define the problem and its scope
Have a clear view of the goal
Draw the path to the objective
2. Page 2 – Big Data Industry Process – Adil ZEAARAOUI
Step2: Collect the data
Import and collect the data from different sources like: RDMS, datalake store,
datawarehouse...etc.
Step3: Understand and explore data
Before any kind of development, we must first explore our dataset. The exploration is
manifesting in :
Explore features
Distinguish categorical features from numerical ones
Do statistical analysis: min, max, mean, standard deviation, variance...etc.
Visualize data: missing values for each feature, unique values, how values are
distributed…etc.
Define business important features
Step4 : Pre-process data
This is the important step in big data; it can take up to 90% of the whole process. This step
intends to prepare data before mine it. We must do:
Correct wrong input values
Remove missing values
Fill the rest of missing values
Discretize continues features
Remove correlated features
Normalize features if required
Remove outliers if necessary
Etc.
Step4: Develop your model (Data mining)
After building a clean and “ready to process” dataset, it is time to build our model.
Transform our dataset if required
Apply our machine-learning algorithm
3. Page 3 – Big Data Industry Process – Adil ZEAARAOUI
Step5: Evaluate and deploy the model
Before deployment, we must validate and see how accurate is our model. So we must :
Evaluate and test the model
Review and enhance it
Deploy the model
Automate the system workflow