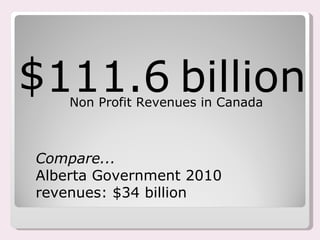
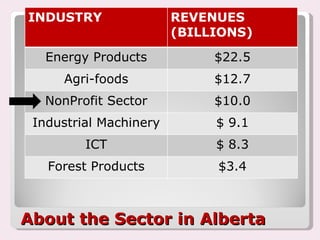
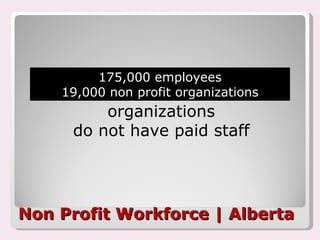
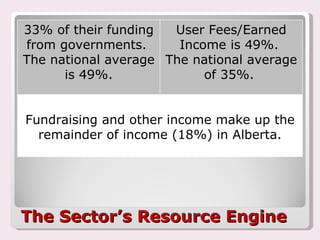
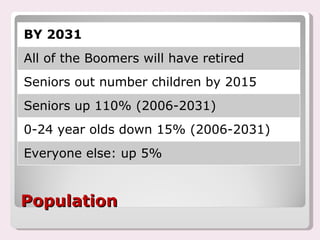
Information, trends, considerations and questions about the future of the non profit sector and its workforce.
About the Sector Revenue Sources Key Trends Implications & Questions Will there be a labour shortage? Strategies - Considerations Overview
ABOUT THE  SECTOR
111.6 billion $ Non Profit Revenues in Canada Compare... Alberta Government 2010 revenues: $34 billion
About the Sector in Alberta INDUSTRY REVENUES  (BILLIONS) Energy Products $22.5 Agri-foods $12.7 NonProfit Sector $10.0 Industrial Machinery $ 9.1 ICT $ 8.3 Forest Products $3.4
Non Profit Workforce | Alberta 54% of Non Profit organizations do not have paid staff 175,000 employees 19,000 non profit organizations
Non Profit Workforce | Alberta NOW CONSIDER... Hospitals, Universities and Colleges make up 1% of Alberta organizations but employ 40% of all paid staff. 8,740
Non Profit Workforce | Alberta BUT ALSO... 64% of staff are employed by 5% of non-profits. Excluding Hospitals, Universities, Colleges 8,550 105,000
Non Profit Workforce | Alberta 67,200 staff are employed by 856 non profits.  77% of the revenue. 23,100 staff are employed by 7,000 non profits 23% of the revenue split between those above and the 10,300 that have no staff.
We need to know more about the various subsectors Primary Activity Alberta Canada Sports and Recreation 26% 21% Religion 19% 19% Grantmaking, Fundraising & Voluntarism Promotion 11% 10% Arts and Culture 10% 9% Social Services 9% 12% Education and Research 8% 5% Development & Housing 5% 8% Business, Professional Associations and Unions 3% 5% Health 2% 3% Environment 2% 3% Law, Advocacy and Politics 2% 2% Hospitals, Universities and Colleges 1% 1% Other 2.4% 3%
Is there data? What are the differences between the 5% that have most the staff and the rest of the non profits? What are the differences across sub-sectors? What are the challenges for organizations of different sizes, revenues, geographic locations and missions? Are the challenges for small non profits more about filling capacity gaps than recruiting staff?
Revenue  Sources
The Sector’s Resource Engine 33% of their funding from governments.  The national average is 49%. User Fees/Earned Income is 49%.  The national average of 35%.  Fundraising and other income make up the remainder of income (18%) in Alberta.
What will fuel the sector? Government funding? Earned Income/User Fees? Fundraising? Consolidations and Mergers? Social Innovation? Social Enterprise? Efficiencies? Fewer NPOs?
Key  Trends
Population BY 2031 All of the Boomers will have retired Seniors out number children by 2015 Seniors up 110% (2006-2031) 0-24 year olds down 15% (2006-2031) Everyone else: up 5%
Immigration Immigration to drive pop. growth In 2003, one in ten immigrants spoke English or French (compared to one in three in 1980) By 2017, 19 to 23% of the population will be a visible minority. In 2031, 50% of the population in Vancouver and Toronto will be immigrants.
Workforce In 20 years the participation rate in the Alberta workforce will fall from 72% to 63% Labour Force Participation
1981 One Senior Five  Workers 2005 One Senior Four Workers 2031 One Senior Two Workers
Implications and Questions?
Implications & Questions Tax revenues will decrease unless there are significant new revenues or cost savings found. Payments to Seniors will increase. Health Spending will increase. Payments to children's benefits, child-care allowances and education funding will decrease.
Implications & Questions Competition will drive wages up in some professions. Work will become more flexible and employee focused. Workplaces will be increasingly multicultural. Boomers will be in demand to offset workforce shortages, but to what extent? Will education keep pace with talent requirements of employers?
Will there be  a shortage or  won’t there?
Sounds like there will be Past 50 years: Canada’s workforce grew by 200% Next 50 years: 11 percent   http://www.working.com
Or maybe not... 2/3rds of job openings over the next 10 years will require post-secondary education. HRSDC projects the labour supply will be adequate to meet the demand. “
Anticipated Shortages, 10 years Senior managers,  HR managers,  human resource and business services professionals Managers in health, education, social and community services. Health care professionals Managers in Public Administration University Professors hrsdc.gc.ca
Challenges and Strategies
Attraction/Retention Strategies Affiliation with a good cause.  Status as community leader.  Connections to larger networks. Recognition. Altruism.
Attraction/Retention Strategies Optimal Salaries & Benefits Flexible Work Hours and Days Work from Home Access to Technology Tools Extra Perks
Leadership Crisis? Aging of leadership and the lack of succession plans, resulting in the dissipation of entire networks and the loss of sector knowledge
Targeted Strategies Needed Sector-wide strategies are likely not sufficient. Specific strategies for specific segments could make more sense. Issues are bigger than workforce.
Funding/Funders Results –based funding Rethinking thin funding Sector Investment Investing in innovation and change Core funding is critical So is project funding
Governments Fund full costs Pay market wages Increase flexibility Lighten admin burdens
NonProfits Do more of less Get organized to address sustainability issues & promote sector value Shared space, shared services, shared staff, consolidations, mergers, and social innovations ....
Major Sources Statistics Canada Imagine Canada Government of Alberta Centre for Public Policy Volunteer Alberta United Way Globe and Mail HRSDC

Big Change Trends

  • 1.
    Information, trends, considerationsand questions about the future of the non profit sector and its workforce.
  • 2.
    About the SectorRevenue Sources Key Trends Implications & Questions Will there be a labour shortage? Strategies - Considerations Overview
  • 3.
    ABOUT THE SECTOR
  • 4.
    111.6 billion $Non Profit Revenues in Canada Compare... Alberta Government 2010 revenues: $34 billion
  • 5.
    About the Sectorin Alberta INDUSTRY REVENUES (BILLIONS) Energy Products $22.5 Agri-foods $12.7 NonProfit Sector $10.0 Industrial Machinery $ 9.1 ICT $ 8.3 Forest Products $3.4
  • 6.
    Non Profit Workforce| Alberta 54% of Non Profit organizations do not have paid staff 175,000 employees 19,000 non profit organizations
  • 7.
    Non Profit Workforce| Alberta NOW CONSIDER... Hospitals, Universities and Colleges make up 1% of Alberta organizations but employ 40% of all paid staff. 8,740
  • 8.
    Non Profit Workforce| Alberta BUT ALSO... 64% of staff are employed by 5% of non-profits. Excluding Hospitals, Universities, Colleges 8,550 105,000
  • 9.
    Non Profit Workforce| Alberta 67,200 staff are employed by 856 non profits. 77% of the revenue. 23,100 staff are employed by 7,000 non profits 23% of the revenue split between those above and the 10,300 that have no staff.
  • 10.
    We need toknow more about the various subsectors Primary Activity Alberta Canada Sports and Recreation 26% 21% Religion 19% 19% Grantmaking, Fundraising & Voluntarism Promotion 11% 10% Arts and Culture 10% 9% Social Services 9% 12% Education and Research 8% 5% Development & Housing 5% 8% Business, Professional Associations and Unions 3% 5% Health 2% 3% Environment 2% 3% Law, Advocacy and Politics 2% 2% Hospitals, Universities and Colleges 1% 1% Other 2.4% 3%
  • 11.
    Is there data?What are the differences between the 5% that have most the staff and the rest of the non profits? What are the differences across sub-sectors? What are the challenges for organizations of different sizes, revenues, geographic locations and missions? Are the challenges for small non profits more about filling capacity gaps than recruiting staff?
  • 12.
  • 13.
    The Sector’s ResourceEngine 33% of their funding from governments. The national average is 49%. User Fees/Earned Income is 49%. The national average of 35%. Fundraising and other income make up the remainder of income (18%) in Alberta.
  • 14.
    What will fuelthe sector? Government funding? Earned Income/User Fees? Fundraising? Consolidations and Mergers? Social Innovation? Social Enterprise? Efficiencies? Fewer NPOs?
  • 15.
  • 16.
    Population BY 2031All of the Boomers will have retired Seniors out number children by 2015 Seniors up 110% (2006-2031) 0-24 year olds down 15% (2006-2031) Everyone else: up 5%
  • 17.
    Immigration Immigration todrive pop. growth In 2003, one in ten immigrants spoke English or French (compared to one in three in 1980) By 2017, 19 to 23% of the population will be a visible minority. In 2031, 50% of the population in Vancouver and Toronto will be immigrants.
  • 18.
    Workforce In 20years the participation rate in the Alberta workforce will fall from 72% to 63% Labour Force Participation
  • 19.
    1981 One SeniorFive Workers 2005 One Senior Four Workers 2031 One Senior Two Workers
  • 20.
  • 21.
    Implications & QuestionsTax revenues will decrease unless there are significant new revenues or cost savings found. Payments to Seniors will increase. Health Spending will increase. Payments to children's benefits, child-care allowances and education funding will decrease.
  • 22.
    Implications & QuestionsCompetition will drive wages up in some professions. Work will become more flexible and employee focused. Workplaces will be increasingly multicultural. Boomers will be in demand to offset workforce shortages, but to what extent? Will education keep pace with talent requirements of employers?
  • 23.
    Will there be a shortage or won’t there?
  • 24.
    Sounds like therewill be Past 50 years: Canada’s workforce grew by 200% Next 50 years: 11 percent http://www.working.com
  • 25.
    Or maybe not...2/3rds of job openings over the next 10 years will require post-secondary education. HRSDC projects the labour supply will be adequate to meet the demand. “
  • 26.
    Anticipated Shortages, 10years Senior managers, HR managers, human resource and business services professionals Managers in health, education, social and community services. Health care professionals Managers in Public Administration University Professors hrsdc.gc.ca
  • 27.
  • 28.
    Attraction/Retention Strategies Affiliationwith a good cause. Status as community leader. Connections to larger networks. Recognition. Altruism.
  • 29.
    Attraction/Retention Strategies OptimalSalaries & Benefits Flexible Work Hours and Days Work from Home Access to Technology Tools Extra Perks
  • 30.
    Leadership Crisis? Agingof leadership and the lack of succession plans, resulting in the dissipation of entire networks and the loss of sector knowledge
  • 31.
    Targeted Strategies NeededSector-wide strategies are likely not sufficient. Specific strategies for specific segments could make more sense. Issues are bigger than workforce.
  • 32.
    Funding/Funders Results –basedfunding Rethinking thin funding Sector Investment Investing in innovation and change Core funding is critical So is project funding
  • 33.
    Governments Fund fullcosts Pay market wages Increase flexibility Lighten admin burdens
  • 34.
    NonProfits Do moreof less Get organized to address sustainability issues & promote sector value Shared space, shared services, shared staff, consolidations, mergers, and social innovations ....
  • 35.
    Major Sources StatisticsCanada Imagine Canada Government of Alberta Centre for Public Policy Volunteer Alberta United Way Globe and Mail HRSDC

Editor's Notes

  • #6 Energy Products $22.5 billion Forest Products: $3.4 billion : $8.3 billion Industrial Machinery and Metal Fabrication: $9.1
  • #17 Age Range 2006 - 2031 65-69 590,000 1,204,000 70-74 489,000 1,075,000 75-79 386,000 813,000 15-19 2,164,000 1,762,000 20-24 2,252.000 1,931,000
  • #19 In 20 years the participation rate in the Alberta workforce will fall from 72% to 63%.
  • #22 Net will be $38 billion per year by 2020 and will continue to grow. * * Pierre Fortin is a professor of economics at the Université du Québec à Montréal, and an associate of the Canadian Institute for Advanced Research
  • #30 tickets, tuition breaks, special access to learning opportunities)