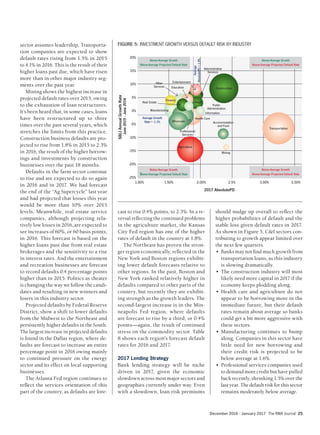
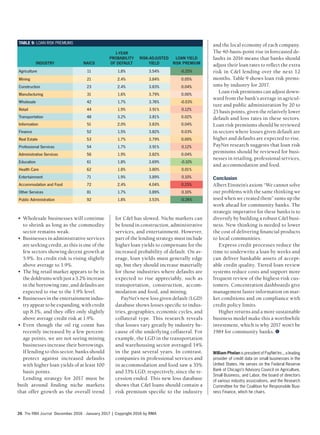
Benefits-of-Financial-Technology-for-Banks_RMA Jan 2017
1. An RMA Publication
December 2016•January 2017 | rmahq.org
THE ECONOMY
AT A GLANCE
By all indications,
the U.S. economy
continues to
improve p. 50
By adopting new
technology, processes,
and business applications,
banks can compete
successfully in commercial
and industrial lending p. 18
An RMA Publication
December 2016•January 2017 | rmahq.org
THE ECONOMY
AT A GLANCE
By all indications,
the U.S. economy
continues to
improve p. 50
By adopting new
technology, processes,
and business applications,
banks can compete
successfully in commercial
and industrial lending p. 18
Exclusive RMA Study
Conducted by PayNet,Inc.
2. The RMA Journal December 2016 · January 2017 | Copyright 2016 by RMA18
BANKS
NEEDN’T
FEAR A
1984
SCENARIO
CREDITRISK
GeorGe orwell’s famous book 1984, written in 1948, describes a future of government
control by an elite few who prosecute thought-crime. Absent serious new thinking,
community banking faces a 1984 future. But by adopting new technology, processes,
and business applications, community banks can take this future off the table.
The problems are well known: Declining return on equity (ROE) turns off inves-
tors, makes the best technology unaffordable, and fails to attract the top financial
minds. A shrinking share of financial services has lowered revenues by 17% since
BY WILLIAM PHELAN
3. December 2016 · January 2017 The RMA Journal 19
C&I lending is one of the highest return
businesses (adjusted for risk) for a bank,
and it is far larger than most banks realize.
private-company credit represents one
of the largest credit markets in the U.S.
Why then have community banks
turned away from the higher-return and
less risky business of C&I lending? The
answer is that C&I lending is hard to do
well. But community banks can get back
into the C&I business by using technol-
ogy to make the difficult processes of
underwriting and loan administration
easier and less costly—and, in doing so,
increase their ROE.
The beauty of this approach is that
technology enables community banks to
focus more on what makes them unique
and for which there are no substitutes:
relationship banking that provides im-
portant financial services to key sectors
of the economy, with decisions based on
personal knowledge of customers’ cred-
itworthiness and a keen understanding
of business conditions in the communi-
ties served.
C&I lending is hard because of its
diversity and the loan sizes involved.
Corporate credit underwriting today
requires 28 separate tasks to arrive at
a loan decision. These 28 tasks require
collecting information for the credit
application, reviewing the financial
information, doing data entry and cal-
culations, conducting industry analysis,
evaluating borrower capability, and esti-
mating the value of collateral.
A time-series analysis of these 28 tasks
reveals a two- to three-week process at
best and, in some cases, more than four
to eight weeks to arrive at one credit deci-
sion. Different players in the bank play a
role in this process: the loan officer, credit
analyst, and credit committee. In addi-
tion, it costs $4,000 to $6,000 to under-
write each credit application. With these
costs, banks are unable to lend profitably
unless the loan exceeds $500,000, which
various sources cite as the rising average
loan size among banks. Table 1 shows
these costs in detail.
The corporate credit underwriting
process is not a detriment to middle
market and corporate lending activity,
but when applied to smaller C&I credits,
it is clearly a disincentive to the bank
and the loan officer.
Loan review is another process that
makes C&I banking unattractive at the
moment because it adds significant work
for the credit administration function. An
effective loan review program provides
senior management and the board of
directors with a timely and objective as-
sessment of the overall credit quality of
the portfolio. Appropriate grading of ad-
versely classified loans enables the bank
2003 while GDP has increased 50%.
Profit margins for bank products are ac-
tually higher than in 2002, so this is not
a product issue. Leverage is down and
we won’t see it increase anytime soon.
The strategic issue is that banks are
not getting enough of businesses’ spend
on financial services and products, and
they are not getting paid for their risks.
This article will show how community
banks can use technology, the very tool
being used so effectively against them
by competitors, to solidify commercial
and industrial (C&I) lending as a key
business function delivering less risk
and higher returns.
A Return to C&I Lending
Banks have lost their way in the C&I
business. Today, C&I lending represents
about 25% of all loans, down from over
40% in 1950. The community bank of
today is primarily a construction and de-
velopment (C&D) or commercial real es-
tate (CRE) bank. Indeed, C&D and CRE
make up about 50% of all lending activity
at community banks. Larger average loan
balances for CRE lending ($243,000 per
small business loan relative to $13,000
for C&I loans) mean that community
banks face much higher concentration
risk than at any time in the past. Regula-
tors have pushed banks to rely less on
C&D and CRE, so banks must rediscover
their roots in the C&I business.
C&I lending is one of the highest re-
turn businesses (adjusted for risk) for a
bank, and it is far larger than most banks
realize. In his new RMA-published book
Investing in Banks, Rick Parsons shows
that C&I lending delivers a higher ROE
for banks than C&D or CRE lending,
citing the risk-adjusted ROE of 8.80%
for C&I lending versus 6.30% for CRE.
Research by Mark Zoff of PayNet, Inc.
shows C&I clearly outperforming C&D
and CRE lending pre- and post-financial
crisis. Had banks maintained their share
of C&I lending, they would find $2.6
billion in additional net income between
2008 and 2016, at a higher risk-adjusted
return. At $4.4 trillion in trade payables,
term loans, and working capital loans,
TABLE 1: CORPORATE CREDIT UNDERWRITING COST PER APPLICATION
PEOPLE TASK TIME (HRS) TOTAL COST ($)
Loan Officer Credit Application 6 $415
Credit Analyst Reviews 19 $1,200
Credit Analyst Data Entry and Calculations 46 $2,800
Credit Analyst Industry Risk Analysis 16 $1,300
Credit Analyst Borrower Capability 2 $115
Credit Analyst Valuation and Liquidity of Collateral 10 $725
TOTAL 99 $6,555
ShutterStock.com
4. The RMA Journal December 2016 · January 2017 | Copyright 2016 by RMA20
An express underwriting process can re-
duce the time to underwrite a loan from
the typical two to eight weeks down to
just a few days. Banks are also finding
financial technology useful for lowering
the cost of the loan review by 39% (and
even up to 53%) while at the same time
increasing the frequency of the loan re-
view cycle from annually to four times
a year for the highest-risk accounts.
Finally, some community banks are us-
ing financial technology to conduct more
intensive analysis of concentrations in
order to identify hot spots in their local
market and ensure exposures remain
within policy limits.
New Thinking
Financial technology can benefit loan un-
derwriting by speeding the collection and
analysis of borrower characteristics. The
28-task corporate credit process can be
used as the basis for creating an express
credit process with the following steps:
1. The credit application is submitted and
entered into an electronic application
(branch or direct source).
2. Information sources are accessed via
pre-set application programming in-
terfaces (API).
3. Credit data, including financial state-
ments, payment history, public re-
cords, business demographics, and
to take timely steps to minimize credit
losses. Identifying trends that affect the
ability to collect on loans in the portfo-
lio—and recognizing segments of the
portfolio that are or have the potential
to become problem areas—is needed.
The key to an effective loan review
system is accurate loan classification or
credit grading. Here again, the corporate
credit process makes accurate risk rat-
ings a major challenge for banks because
of the sheer number of C&I credits in
a robust C&I business. Analysis shows
that one loan review involves 15 sepa-
rate steps, ranging from collecting and
spreading financial statements to con-
ducting cash flow analysis and adjust-
ing risk ratings. Many departments are
involved in this process, including the
lending, credit, and audit groups. One
loan review can take a bank up to two
days to complete at a cost of over $1,000
per loan, as shown in Table 2.
To conduct loan reviews annually, a
bank with 1,000 commercial customers
will incur more than $1 million in costs.
In some cases, regulators are requiring
more frequent loan reviews. That can
double this cost—just when banks are
trying to cut costs to boost profitability.
Smart community banks are using
financial technology to streamline loan
underwriting and loan administration.
industry trends, are combined into a
credit package.
4. The credit analysis is conducted.
5. Decision and review rules are checked.
6.Risk ratings are assigned.
With technology, the 28-task corpo-
rate credit process, which typically takes
30 to 60 days to complete, can be done
in four to eight days using a method that
reduces the costs of collecting informa-
tion and frees up the credit department
to conduct analysis. The cost per credit
application can be reduced by over 40%,
which lowers the threshold of profitabil-
ity for smaller loan amounts of $150,000
to $200,000. Credit analysts must be
trained on ways to mix traditional and
nontraditional financial information in
their analyses. External validations must
be conducted annually to ensure these
systems are operating as planned, but
this step can be done by the bank’s ven-
dor. Analysis of loan quality shows that
this method delivers safe credits that are
acceptable risks for the bank.
Loan review is another area where
technology can improve capabilities by
allowing for more frequent reviews and
a substantial cost reduction. Financial
technology applied to loan review em-
ploys a tiered approach to weed out the
high-risk accounts for full review each
quarter. This new process uses an algo-
rithmic-derived probability of default on
each borrower each quarter. The steps
are relatively simple but effective:
1.Borrowers are sorted by probabil-
ity of default to find the highest-risk
accounts.
2. A risk threshold is established (for ex-
ample, to cull out the accounts with a
TABLE 3: LOAN REVIEW TIERED APPROACH
PROBABILITY OF DEFAULT
TRENDING OVER TIME OTHER SORT FEATURES
LOAN
REVIEW
TYPE
PROBABILITY
OF DEFAULT
GENERAL
PORTFOLIO
MIX
High
Probability of Default
+ Big Negative Migration
+ Accounts with Large Exposures, in Certain
States/Regions and in Certain Industries
Full Review Approx. 5%
Medium
Probability of Default
+ Big Negative Migration
+ Accounts with Large Exposures, in Certain
States/Regions and in Certain Industries
Medium
Review
> 5% Approx. 5%
Low
Probability of Default
Light Review
≤ 5%
≤ 1%
Approx. 90%
Approx. 40%
TABLE 2: LOAN REVIEW COST PER CUSTOMER
PEOPLE TASK TIME (HRS) TOTAL COST ($)
Loan Officer Credit Application 8 $625
Credit Analyst Reviews 4 $250
Administration Data Entry and Calculations 4 $150
Sales Industry Risk Analysis 2 $60
TOTALS 18 $1,085
5. December 2016 · January 2017 The RMA Journal 21
the South and the Corn Belt. Table 5
provides a representative view.
As part of this solution, exposure and
commitments can be tracked over time
and measured against risk-based capi-
tal to determine if the bank is operat-
ing within policy limits or has become
overexposed, as illustrated in Figure 1.
Facts and order are always the answer
toanuncertainOrwellianfuture.Thecur-
rentC&Ilendingactivity,loandelinquen-
cies, and borrower defaults are apparent
facts of the unfolding business cycle.
The Business Cycle
“Malaise in animal spirits” is an apt phrase
this author recently heard from a senior
policy maker to describe the current C&I
credit markets. The business cycle remains
in an expansionary/low credit risk phase,
but it is wavering at the moment.
TABLE 4: LOAN REVIEW COST ANALYSIS
PORTFOLIO COST ANALYSIS
Portfolio Mix Borrower Count
Loan Review
Type Freq Per Yr Cost Per Account Aggregate Portfolio Cost
All 100% 1,000 Full 1 $1,000 $1,000,000
TOTALS 1,000 $1,000,000
EXISTING
PORTFOLIO COST ANALYSIS
Portfolio Mix Borrower Count
Loan Review
Type Freq Per Yr Cost Per Acount Aggregate Portfolio Cost
Low Risk 90% 900 Light 1 $400 $360,000
Medium
Risk
5% 50 Medium 1 $1,000 $50,000
High Risk 5% 50 Full 4 $1,000 $200,000
TOTALS 100% 1,000 $610,000
Aggregate Portfolio Savings $390,000
39%
PROPOSED
TABLE 5: CONCENTRATION RISK ANALYSIS, BY NAICS
SUMMARY (NAICS)
NO. OF
BORROWERS $ OUTSTANDING $ COMMITMENT
$ OUTSTANDING/
RISK-BASED
CAPITAL
$
POLICY LIMITS
PROBABILITY
OF DEFAULT
PROBABILITY
OF DEFAULT $
1,000 $2,682,562 $3,219,075 76.9% $3,862,889 1.87% $50,187
Agriculture & Animal Husbandry (11) 50 $328,458 $394,182 9.4% $473,019 1.96% $6,443
Transportation Services (48) 45 $162,023 $194,428 4.6% $233,314 1.78% $2,880
Construction (23) 44 $116,654 $139,985 3.3% $167,982 2.37% $2,760
Healthcare & Social Services (62) 43 $127,315 $152,778 3.7% $183,333 1.73% $2,198
Realty, Rental & Leasing (53) 42 $150,873 $181,048 4.3% $217,258 1.33% $2,009
Professional & Technical Services (54) 41 $71,638 $85,965 2.1% $103,158 2.37% $1,696
probability of default in excess of 5%).
3.The accounts with the highest prob-
ability of default are sent for full loan
review.
4.Low-risk accounts are sent to the
credit committee for sign-off in a “lite
review” process.
Table 3 outlines this process for a risk
threshold of 5%.
A risk threshold of 5% results in a 39%
lower cost of loan review and more fre-
quent quarterly reviews of the highest-
risk accounts, as shown in Table 4.
Moreover, concentration risk can be
managed using financial technology.
Tier 1 and risk-based capital can be ar-
rayed against exposures by industry, ge-
ography, and borrower size to measure
compliance with credit policy limits.
This information is particularly power-
ful for industries and geographies that
are under financial stress, such as energy
in the Bakken region or agriculture in
LOAN REVIEW
is another area
where technology
can improve
capabilities by
allowing for more
frequent reviews
and a substantial
cost reduction.
6. The RMA Journal December 2016 · January 2017 | Copyright 2016 by RMA22
period a year earlier. Even taking into
account a seasonal adjustment versus the
prior year, the decline in small business
investment offers further evidence that
the economy is not as strong as the stock
market would indicate.
Another sign of a teetering business
The trend in small business invest-
ment continued to decline in August, the
last month for which monthly analyses
were complete. Specifically, investment
activity declined in the three months
ending in August compared to the prior
three months and the same three-month
cycle is the amount of loans past due.
Loansseverelypastdueedgedupfivebasis
points since December, but the definitive
five-basis-point jump in loans moderately
past due over the past three months can
flow through to severe past-dues over the
nextquarter.SeeFigure2formoredetails.
Lending Activity
The Thomson Reuters/PayNet Small
Business Lending Index (SBLI) mea-
sures the amount of new credit taken
by U.S. small businesses for investment
in durable goods, for working capital,
or for business expansions. The SBLI
decreased significantly in July to 123.1,
but then increased to 133.7 in August.
The rolling three-month index was down
year-over-year for three consecutive
months after no year-over-year declines
at all for six years. All signs indicate the
probability of small business investment
continues to underperform. Figure 3
presents a longer history.
Lending Activity by Sector
The fastest-growing sectors of the small
business economy remain 1) construc-
tion; 2) arts, entertainment, and recre-
ation; and 3) administrative and support
and waste management and remediation
services. While construction remains
positive with an 8.0% increase in invest-
ment year-over-year, its pace of growth
slowed from 9.4% in the prior month.
Arts, entertainment, and recreation also
exhibited a slowdown, falling from 8.2%
in May to 8.1% in June. Industry sectors
showing the largest decreases are min-
ing, quarrying, and oil and gas extrac-
tion (-13.5%) and agriculture, forestry,
fishing, and hunting (-14.5%). For the
big groups, the trend continues to shift
mainly to decreases: wholesale trade
(-3.7%), transportation and warehousing
(-6.6%), and accommodation and food
services (-8.7%).
Geographically, Florida (7.6%), Geor-
gia (3.4%), Michigan (2.5%), and New
York (2.2%) show the largest year-over-
year increases among the most populated
states. However, a general slowdown has
occurred in the major states.
FIGURE 2: PAYNET SMALL BUSINESS CREDIT CYCLETM
SBLIORIGINATIONSINDEX
140
130
120
110
100
90
80
70
60
SBDI 91-180 DAY DELINQUENCY INDEX
1.6% 1.4% 1.2% 1.0% 0.8% 0.6% 0.4% 0.2% 0.0%
1Q10
EXPANSION
1Q09
1Q11
1Q12
1Q05
1Q08
1Q13
1Q14
1Q07
1Q06 1Q15
1Q162Q16
RECOVERY
CONTRACTION
RECESSION
FIGURE 1: TRACKING CONCENTRATION EXPOSURE
$60
$50
$40
$30
$20
$10
$0
ENERGY SECTOR
$MILLIONS
60%
50%
40%
30%
20%
10%
0%
EXPOSURE%TORBC
6/15 7/15 8/15 9/15 10/15 11/15 12/15 1/16 2/16 3/16 4/16 5/16 6/16
28 28
26 25 25 25 25
23
35
51
53 54 56
26 26 24 24 2423 23 23 2322 25
36
$ OUTSTANDING
$ UNFUNDED
POLICY LIMIT
EXPOSURE AS A % OF RBC
24
7. December 2016 · January 2017 The RMA Journal 23
• Florida has slowed the least, its rate of
lending activity falling only 2%—from
9.6% in June 2015 to 7.6% in June 2016.
• Georgia’s pace of lending activity and
business investment showed substan-
tial slowing, down from 9.4% to 3.4%.
• Michigan, although positive now at
2.5%, has fallen from 5.6% last year.
• New York exhibits the same trend,
slowing from 6.7% to 2.2%.
• Pennsylvania has seen lending activ-
ity nearly grind to a halt, up only 0.2%,
down from 7.7% last year.
• Ohio has shifted from a positive in-
crease of 2.4% last year to a decrease
of 1.2% this year.
• California’s lending activity has taken
a dive from 8.5% to -3.4% over the past
year.
• Texas has also fallen dramatically,
down from 7.7% to -5.7%.
• The worst-performing of the large
states is Illinois, where lending activ-
ity declined from 1.2% to -6.8%.
North Carolina remains the only
major state with a healthy increase in
lending activity: 7.7% this year versus
0.4% last year.
Credit Risk
Credit risk has remained unusually low
since the Great Recession ended, for
several reasons: The strongest businesses
with higher credit quality survived; regu-
lators are conducting more frequent and
intense exams; fewer start-up businesses
are forming; and businesses are not tak-
ing big risks. This observation begs the
question, is credit risk in a low-risk phase
for the foreseeable future?
The most recent data shows credit
risk will remain low as long as the con-
ditions for moderate risk taking remain
in place. That said, credit risk stands at
levels that are consistent with prevailing
interest rates—lower interest rates equate
to lower systemic delinquencies. These
delinquency rates are appropriate for this
stage of the business cycle, but rising loan
delinquencies indicate a changing cycle.
The Thomson Reuters/PayNet Small
Business Delinquency Index (SBDI) mea-
sures the delinquency rate of borrowers
with credit exposures of $1 million or
less. The SBDI 31-to-90-days past due
bottomed at 1.15% in 2013. It remained
around 1.21% for a considerable amount
of time, but is clearly on the rise now.
Loan delinquencies for the smallest busi-
nesses reached 1.32% in August 2016, its
highest level since December 2012. Com-
pared to August 2015, one year ago, delin-
quencies are up 13 basis points, which is
the largest year-over-year increase since
December 2009. The cycle’s low has been
reached, as shown in Figure 4, and we are
now witnessing the formation of the next
phase of the business cycle.
The SBDI 91-to-180-days past due
reached 0.31% in August 2016, its high-
est level since November 2014. The index
has gone 12 months without a decrease in
delinquenciesandisup6basispointsfrom
one year ago, showing the largest year-
over-year increase since February 2010.
Credit Risk by Sector
As shown in Table 6, the SBDI 31-to-90-
days past due for the transportation sector
increased 14 basis points to 1.81% in July,
its 17th consecutive month of increase
and its highest level since September
FIGURE 3: THOMSON REUTERS/PAYNET SMALL BUSINESS LENDING INDEX (SBLI)
(JANUARY 2005 - AUGUST 2016)
150
140
130
120
110
100
90
80
70
60
2005 2006 2007 2008 2009 2010 2011 2012 2013 2014 2015 2016
INDEXVALUE
FIGURE 4: THOMSON REUTERS/PAYNET SMALL BUSINESS DELINQUENCY INDEX (SBDI)
31 - 90 DAYS PAST DUE (JANUARY 2005 - AUGUST 2016)
4%
3.5%
3%
2.5%
2%
1.5%
1%
0.5%
0%
2005 2006 2007 2008 2009 2010 2011 2012 2013 2014 2015 2016
INDEXVALUE
8. The RMA Journal December 2016 · January 2017 | Copyright 2016 by RMA24
through June, only two large states,
New York and California, showed no-
ticeably lower loans past due—down
0.28% and 0.09%, respectively. North
Carolina and Florida, where small busi-
nesses are still expanding, showed little
or no material rise in loans past due
among their small businesses. Two
states showing the largest decreases
in investment, Texas and Illinois, also
had the largest increases in loans past
due. Higher delinquency rates in Texas
(up 0.28%) and Georgia (0.23%) reflect
the greater financial stress among local
small businesses, but these rises pale in
2011. Every other segment increased by
at least 3 basis points from June 2016.
The SBDI 91-to-180-days past due for the
transportation sector also increased, by 2
basis points to 0.54% in July, its 11th con-
secutive month of increase and its highest
level since September 2011. Agriculture
delinquency was flat, but every other
segment increased at least 1 basis point.
Regional View
The loans past due at the state level
reflect the broader trend toward less
investment and rising financial stress
at the national level. From January
comparison to the highs reached during
the height of the Great Recession.
Default Outlook
Given the sluggish economy, rising
loans past due, and general malaise,
credit risk will likely rise in 2016-17.
Business defaults reached 1.5%, the
lowest level during this business cycle,
in 2014 and 2015. With lower borrow-
ing and investment, we’d expect lower
loans past due. However, the opposite
appears under way. Even with falling
borrowings, we are seeing higher loan
delinquencies now, as mentioned above.
Another factor pointing to rising de-
faults is that business cycle lows appear
to have been reached as financial stress
is rising after 10 years of sub-par GDP
growth. AbsolutePD forecasts a slight
rise in defaults in 2016 and 2017—to
1.8% and 1.9%, respectively.
Defaults are forecast to rise in the
major industry sectors in 2016 as the
consumer goes on hold, commodities
continue to lag, and no other industry
TABLE 7: FORECAST DEFAULT RATES BY NAICS INDUSTRY SEGMENTS
INDUSTRY SEGMENT FORECAST DEFAULT RATES
2016 2017
Transportation 4.1% 3.2%
Information 2.0% 2.0%
Mining 4.2% 2.4%
Retail 1.8% 1.9%
Construction 2.3% 2.4%
Professional Services 1.9% 1.7%
Health Care 1.7% 1.8%
Administrative Services 1.9% 1.9%
Accommodation and Food 1.8% 2.4%
Manufacturing 1.7% 1.6%
Agriculture 2.1% 1.8%
Wholesale 1.4% 1.7%
Finance 1.5% 1.5%
Other Services 1.5% 1.7%
Real Estate 1.6% 1.7%
Entertainment 1.3% 1.9%
Education 1.1% 1.8%
Public Administration 1.2% 1.8%
All Industries 1.8% 1.9%
TABLE 8: FORECAST DEFAULT RATES BY FEDERAL RESERVE DISTRICT
FEDERAL RESERVE DISTRICT FORECAST DEFAULT RATES
2016 2017
Dallas 3.1% 2.3%
Atlanta 2.3% 2.1%
St. Louis 2.0% 2.0%
Kansas City 1.8% 1.8%
Richmond 1.8% 1.8%
Philadelphia 1.5% 1.8%
New York 1.6% 1.7%
San Francisco 1.6% 1.8%
Chicago 1.5% 1.7%
Cleveland 1.6% 1.7%
Boston 1.4% 1.8%
Minneapolis 1.5% 1.5%
All 1.8% 1.9%
TABLE 6: SMALL BUSINESS DELINQUENCY INDEX 31-90 DAYS PAST DUE
SEGMENT JUL-17 JUN-17 MoM CHANGE JUL-16 YoY CHANGE
SBDI National - Retail 1.21% 1.18% 0.03% 1.15% 0.06%
SBDI National - General 1.23% 1.17% 0.06% 1.17% 0.06%
SBDI National - Health Care 1.28% 1.23% 0.05% 1.13% 0.15%
SBDI National - Construction 1.94% 1.88% 0.06% 1.64% 0.30%
SBDI National - Agriculture 0.68% 0.65% 0.03% 0.43% 0.25%
SBDI National - Transportation 1.81% 1.67% 0.14% 0.90% 0.91%
SBDI National - Overall 1.33% 1.27% 0.06% 1.20% 0.13%
9. December 2016 · January 2017 The RMA Journal 25
sector assumes leadership. Transporta-
tion companies are expected to show
default rates rising from 1.5% in 2015
to 4.1% in 2016. This is the result of their
higher loans past due, which have risen
more than in other major industry seg-
ments over the past year.
Mining shows the highest increase in
projected default rates over 2015, owing
to the exhaustion of loan restructures.
It’s been heard that, in some cases, loans
have been restructured up to three
times over the past several years, which
stretches the limits from this practice.
Construction business defaults are pro-
jected to rise from 1.8% in 2015 to 2.3%
in 2016, the result of the higher borrow-
ings and investments by construction
businesses over the past 18 months.
Defaults in the farm sector continue
to rise and are expected to do so again
in 2016 and in 2017. We had forecast
the end of the “Ag Supercycle” last year
and had projected that losses this year
would be more than 10% over 2015
levels. Meanwhile, real estate service
companies, although projecting rela-
tively low losses in 2016, are expected to
see increases of 60%, or 60 basis points,
in 2016. This forecast is based on the
higher loans past due from real estate
brokerages and the sensitivity to a rise
in interest rates. And the entertainment
and recreation businesses are forecast
to record defaults 0.4 percentage points
higher than in 2015. Politics as theater
is changing the way we follow the candi-
dates and resulting in new winners and
losers in this industry sector.
Projected defaults by Federal Reserve
District, show a shift to lower defaults
from the Midwest to the Northeast and
persistently higher defaults in the South.
The largest increase in projected defaults
is found in the Dallas region, where de-
faults are forecast to increase an entire
percentage point in 2016 owing mainly
to continued pressure on the energy
sector and its effect on local supporting
businesses.
The Atlanta Fed region continues to
reflect the services orientation of this
part of the country, as defaults are fore-
cast to rise 0.4% points, to 2.3%. In a re-
versal reflecting the continued problems
in the agriculture market, the Kansas
City Fed region has one of the higher
rates of default in the country at 1.8%.
The Northeast has proven the stron-
ger region economically, reflected in the
New York and Boston regions exhibit-
ing lower default forecasts relative to
other regions. In the past, Boston and
New York ranked relatively higher in
defaults compared to other parts of the
country, but recently they are exhibit-
ing strength as the growth leaders. The
second-largest increase is in the Min-
neapolis Fed region, where defaults
are forecast to rise by a third, or 0.4%
points—again, the result of continued
stress on the commodity sector. Table
8 shows each region’s forecast default
rates for 2016 and 2017.
2017 Lending Strategy
Bank lending strategy will be niche
driven in 2017, given the economic
slowdown across most major sectors and
geographies currently under way. Even
with a slowdown, loan risk premiums
should nudge up overall to reflect the
higher probabilities of default and the
stable loss given default rates in 2017.
As shown in Figure 5, C&I sectors con-
tributing to growth appear limited over
the next few quarters.
• Banks may not find much growth from
transportation loans, as this industry
is slowing dramatically.
• The construction industry will most
likely need more capital in 2017 if the
economy keeps plodding along.
• Health care and agriculture do not
appear to be borrowing more in the
immediate future, but their default
rates remain about average so banks
could get a bit more aggressive with
these sectors.
• Manufacturing continues to bump
along. Companies in this sector have
little need for new borrowing and
their credit risk is projected to be
below average at 1.6%.
• Professional services companies used
to demand more credit but have pulled
back recently, shrinking 1.5% over the
last year. The default risk for this sector
remains moderately below average.
FIGURE 5: INVESTMENT GROWTH VERSUS DEFAULT RISK BY INDUSTRY
20%
15%
10%
5%
0%
-5%
-10%
-15%
-20%
-25%
1.00% 1.50% 2.00% 2.5% 3.00% 3.50%
2017 AbsolutePD
Average Growth
Rate = -1.3%
Above-Average Growth
Below-Average Projected Default Rate
Below-Average Growth
Below-Average Projected Default Rate
SBLIAnnualGrowthRate
June2015-June2016
Construction
Above-Average Growth
Above-Average Projected Default Rate
Below-Average Growth
Above-Average Projected Default Rate
Average
AbsolutePD=1.9%
Transportation
Mining
Accommodation
and Food
Agriculture
Professional
Services
Wholesale
Manufacturing
Real Estate
Other
Services
Entertainment
Education
Administrative
Services
Retail
Health Care
Finance
Public
Administration
Information
10. The RMA Journal December 2016 · January 2017 | Copyright 2016 by RMA26
for C&I has slowed. Niche markets can
be found in construction, administrative
services, and entertainment. However,
part of the lending strategy must include
higher loan yields to compensate for the
increased probability of default. On av-
erage, loan yields must generally edge
up, but they should increase materially
for those industries where defaults are
expected to rise appreciably, such as
transportation, construction, accom-
modation and food, and mining.
PayNet’s new loss given default (LGD)
database shows losses specific to indus-
tries, geographies, economic cycles, and
collateral type. This research reveals
that losses vary greatly by industry be-
cause of the underlying collateral. For
example, the LGD in the transportation
and warehousing sector averaged 14%
in the past several years. In contrast,
companies in professional services and
in accommodation and food saw a 35%
and 33% LGD, respectively, since the re-
cession ended. This new loss database
shows that C&I loans should contain a
risk premium specific to the industry
• Wholesale businesses will continue
to shrink as long as the commodity
sector remains weak.
• Businesses in administrative services
are seeking credit, as this is one of the
few sectors showing decent growth at
5.9%. Its credit risk is rising slightly
above average to 1.9%.
• The big retail market appears to be in
the doldrums with just a 3.2% increase
in the borrowing rate, and defaults are
expected to rise to the 1.9% level.
• Businesses in the entertainment indus-
try appear to be expanding, with credit
up 8.1%, and they offer only slightly
above average credit risk at 1.9%.
• Even though the oil rig count has
recently increased by a few percent-
age points, we are not seeing mining
businesses increase their borrowings.
If lending to this sector, banks should
protect against increased defaults
with higher loan yields of at least 100
basis points.
Lending strategy for 2017 must be
built around finding niche markets
that offer growth as the overall trend
and the local economy of each company.
The 40-basis-point rise in forecasted de-
faults in 2016 means that banks should
adjust their loan rates to reflect the extra
risk in C&I lending over the next 12
months. Table 9 shows loan risk premi-
ums by industry for 2017.
Loan risk premiums can adjust down-
ward from the bank’s average in agricul-
ture and public administration by 20 to
25 basis points, given the relatively lower
default and loss rates in these sectors.
Loan risk premiums should be reviewed
in sectors where losses given default are
higher and defaults are expected to rise.
PayNet research suggests that loan risk
premiums should be reviewed for busi-
nesses in retailing, professional services,
and accommodation and food.
Conclusion
Albert Einstein’s axiom “We cannot solve
our problems with the same thinking we
used when we created them” sums up the
work ahead for community banks. The
strategic imperative for these banks is to
diversify by building a robust C&I busi-
ness. New thinking is needed to lower
the cost of delivering financial products
to local communities.
Express credit processes reduce the
time to underwrite a loan by weeks and
can deliver bankable assets of accept-
able credit quality. Tiered loan review
systems reduce costs and support more
frequent review of the highest-risk cus-
tomers. Concentration dashboards give
management faster information on mar-
ket conditions and on compliance with
credit policy limits.
Higher returns and a more sustainable
business model make this a worthwhile
investment, which is why 2017 won’t be
1984 for community banks.
William Phelan is president of PayNet Inc., a leading
provider of credit data on small businesses in the
United States. He serves on the Federal Reserve
Bank of Chicago’s Advisory Council on Agriculture,
Small Business, and Labor, the board of directors
of various industry associations, and the Research
Committee for the Coalition for Responsible Busi-
ness Finance, which he chairs.
TABLE 9: LOAN RISK PREMIUMS
INDUSTRY NAICS
1-YEAR
PROBABILITY
OF DEFAULT
RISK-ADJUSTED
YIELD
LOAN YIELD
RISK PREMIUM
Agriculture 11 1.8% 3.54% -0.25%
Mining 21 2.4% 3.84% 0.05%
Construction 23 2.4% 3.83% 0.04%
Manufacturing 31 1.6% 3.79% 0.00%
Wholesale 42 1.7% 3.76% -0.03%
Retail 44 1.9% 3.91% 0.12%
Transportation 48 3.2% 3.81% 0.02%
Information 51 2.0% 3.83% 0.04%
Finance 52 1.5% 3.82% 0.03%
Real Estate 53 1.7% 3.79% 0.00%
Professional Services 54 1.7% 3.91% 0.12%
Administrative Services 56 1.9% 3.82% 0.04%
Education 61 1.8% 3.69% -0.10%
Health Care 62 1.8% 3.80% 0.01%
Entertainment 71 1.9% 3.89% 0.10%
Accommodation and Food 72 2.4% 4.04% 0.25%
Other Services 81 1.7% 3.89% 0.10%
Public Administration 92 1.8% 3.53% -0.26%