Downloaded 271 times


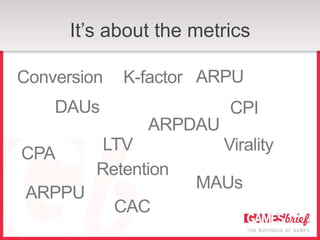


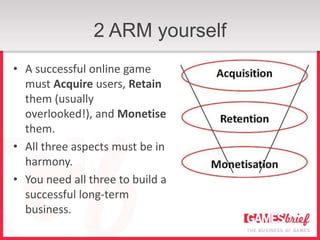


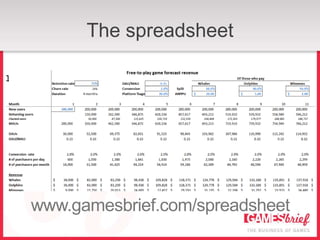

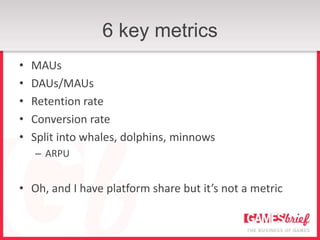
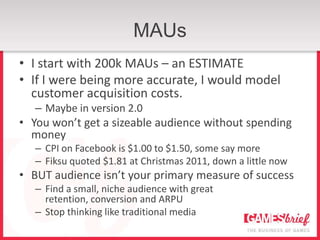
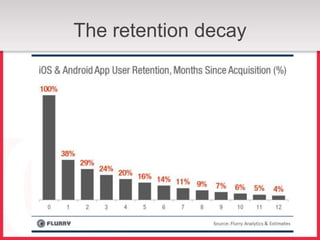
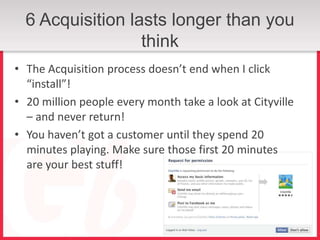
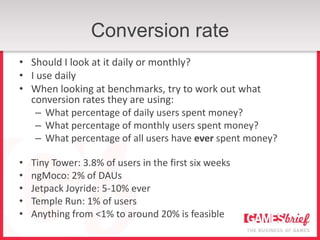
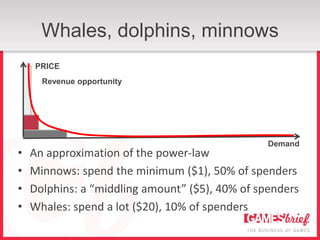
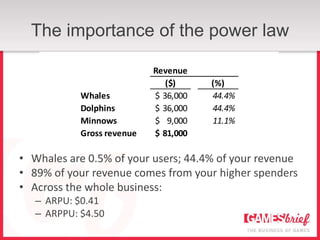

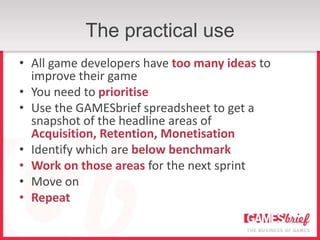
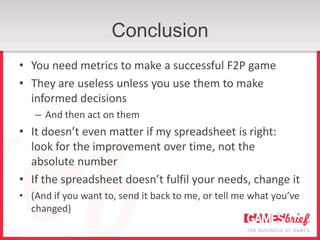


Nicholas Lovell presented on the importance of metrics for social games. He discussed key metrics like MAUs, DAUs/MAUs, retention rates, conversion rates, and the importance of the power law distribution for user spending. He emphasized that metrics should be used to prioritize improvements to acquisition, retention, and monetization in order to build a successful free-to-play game business. He provided a sample spreadsheet to illustrate how to model these metrics and identify areas for improvement.