Download as PDF, PPTX


The document outlines the importance and methodology of consumer insights, highlighting various components, tools, and statistical data that demonstrate their significance in marketing and business strategies. It discusses consumer insight characteristics, capabilities, and benefits such as improved customer satisfaction, reduced marketing costs, and effective inventory planning. Additionally, it emphasizes the need for robust data collection, skilled personnel, and defined roles within organizations to successfully leverage consumer insights.
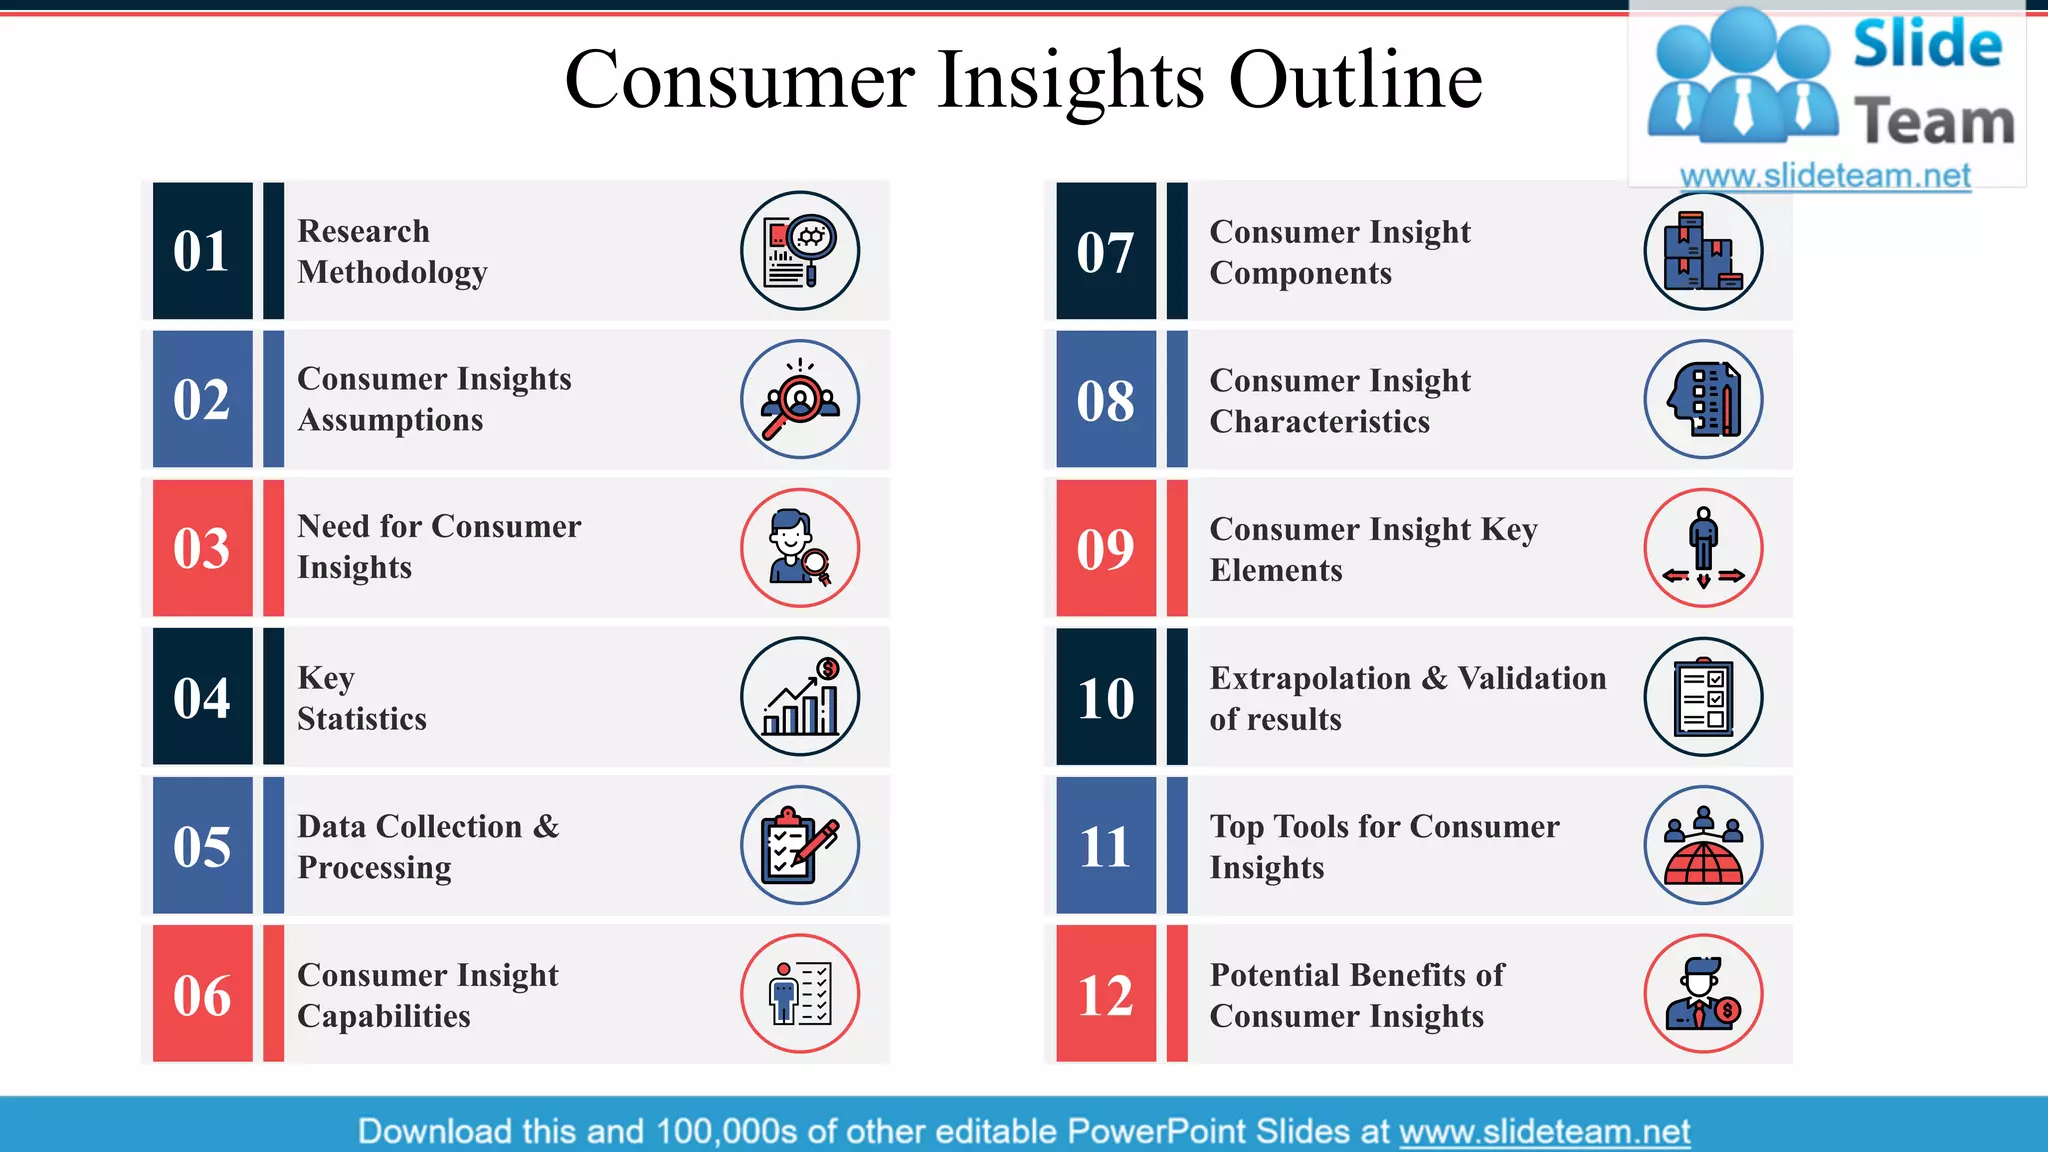
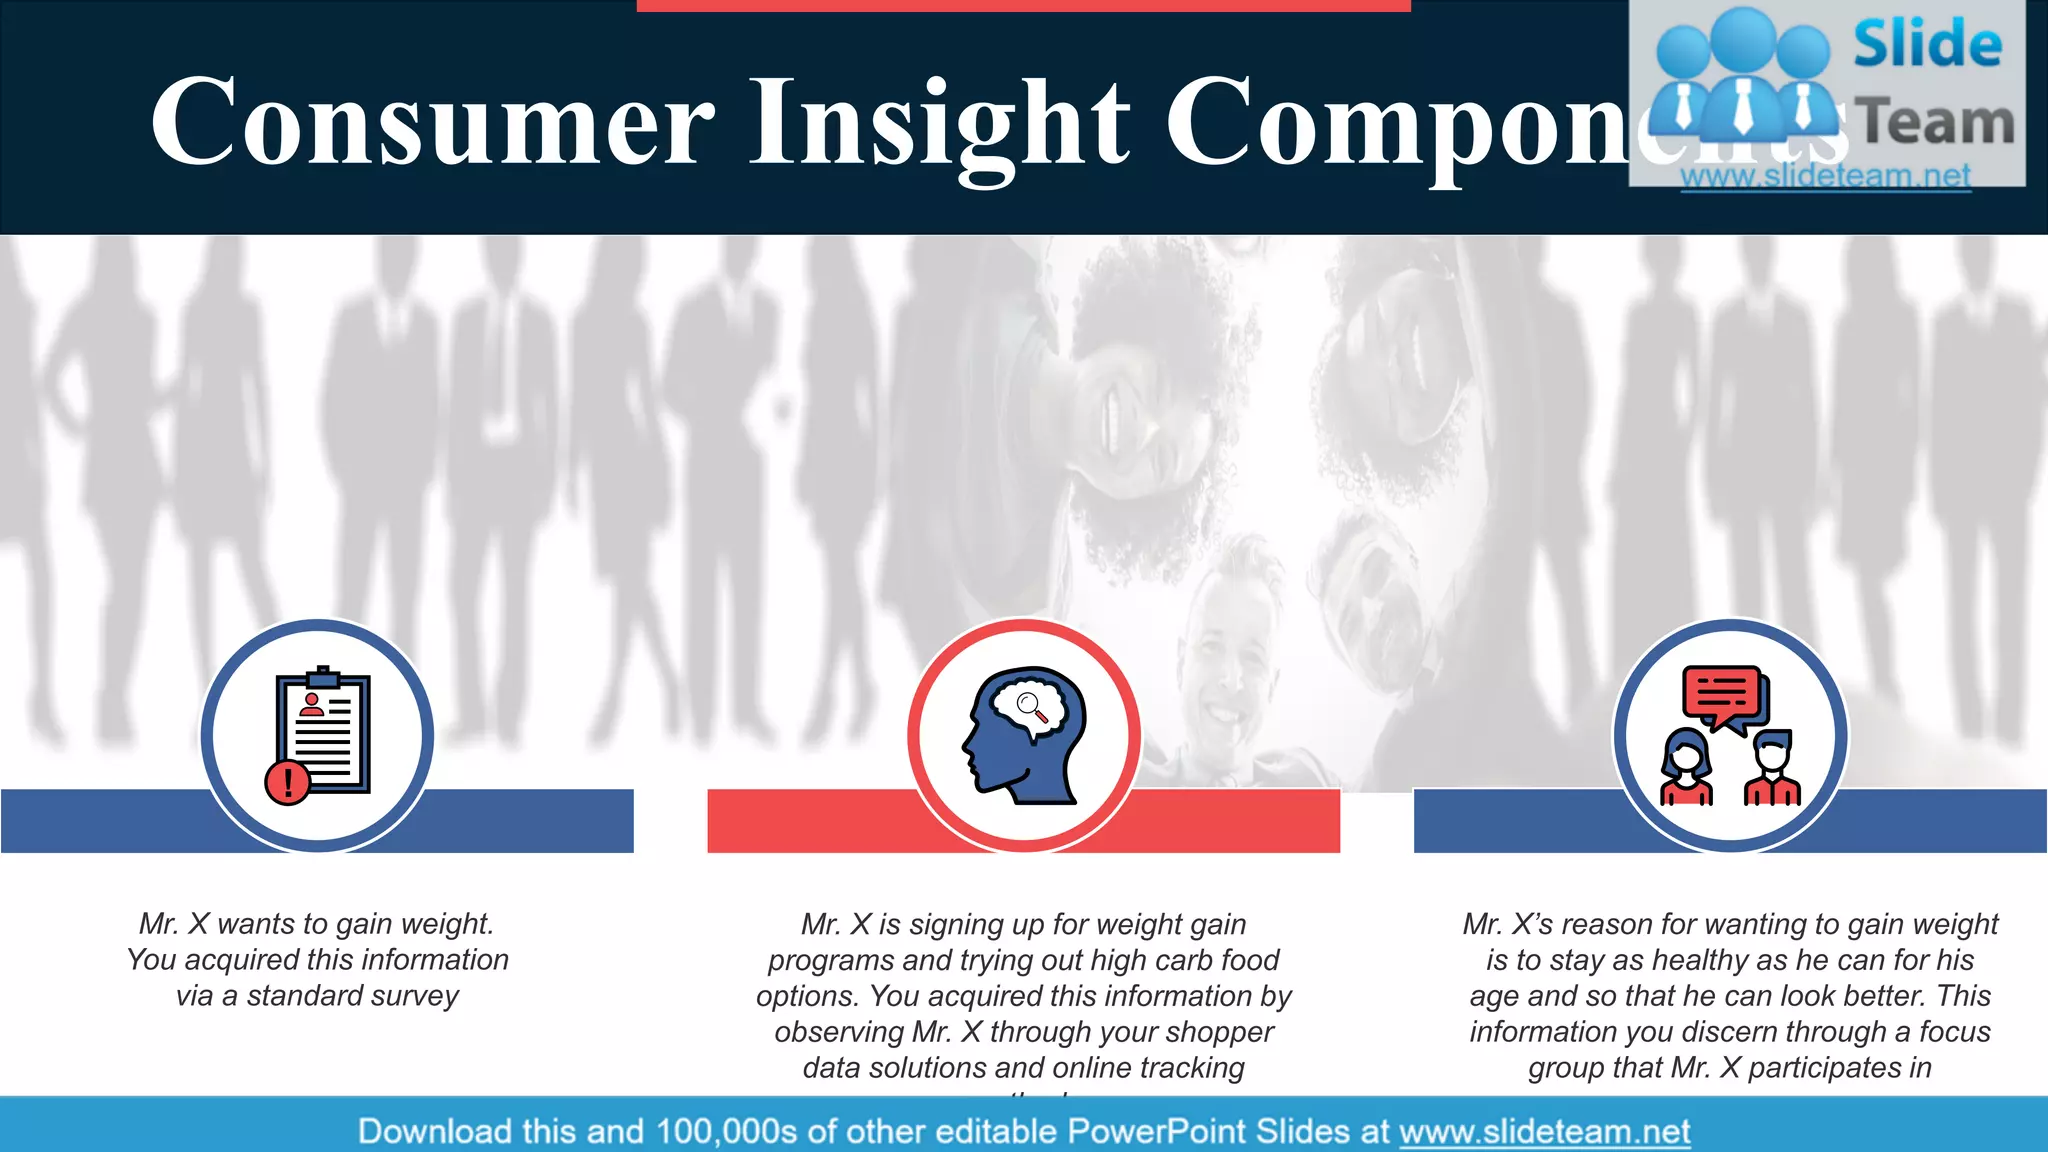
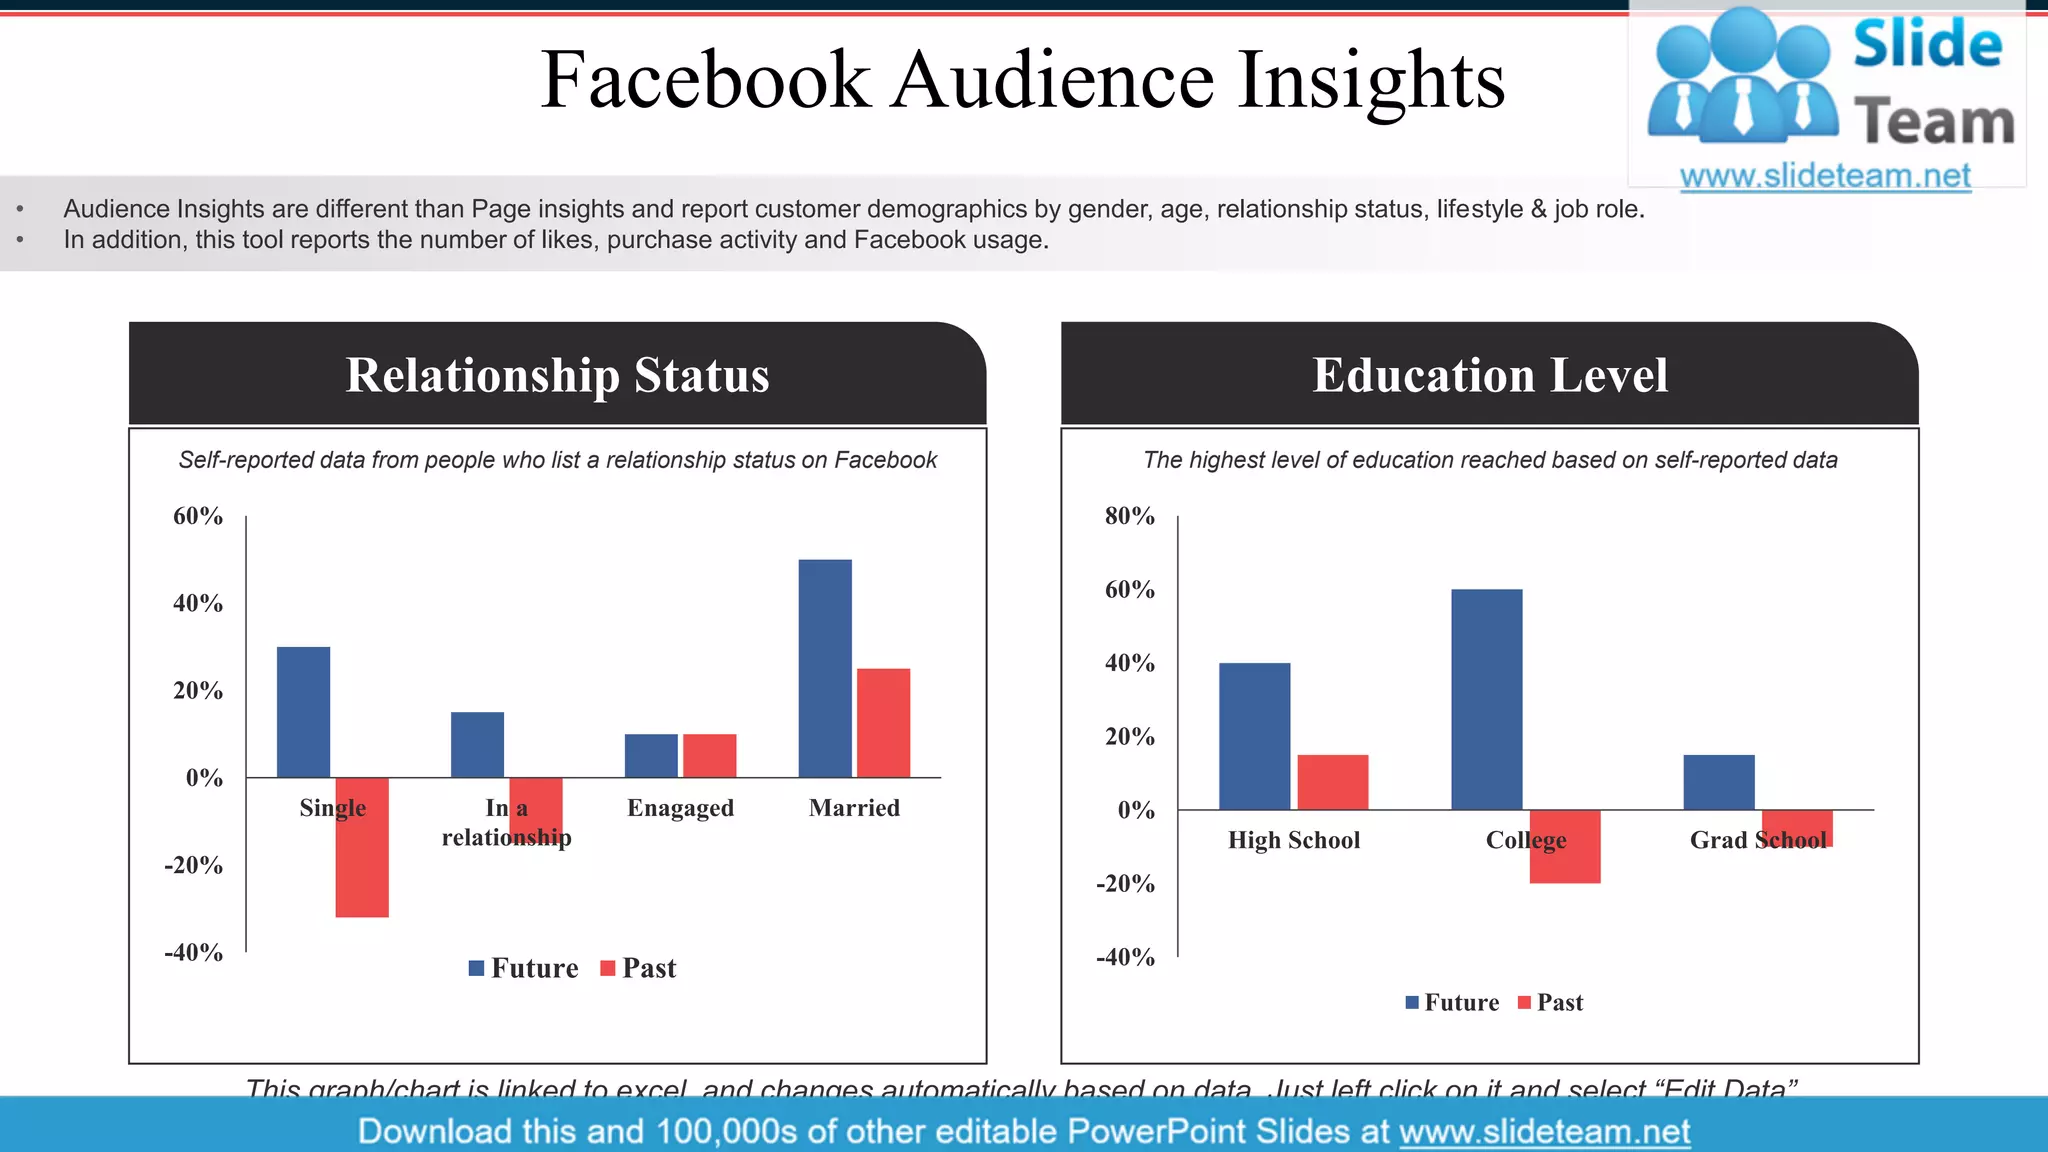
Overview of behavioral analysis and the components of consumer insights.
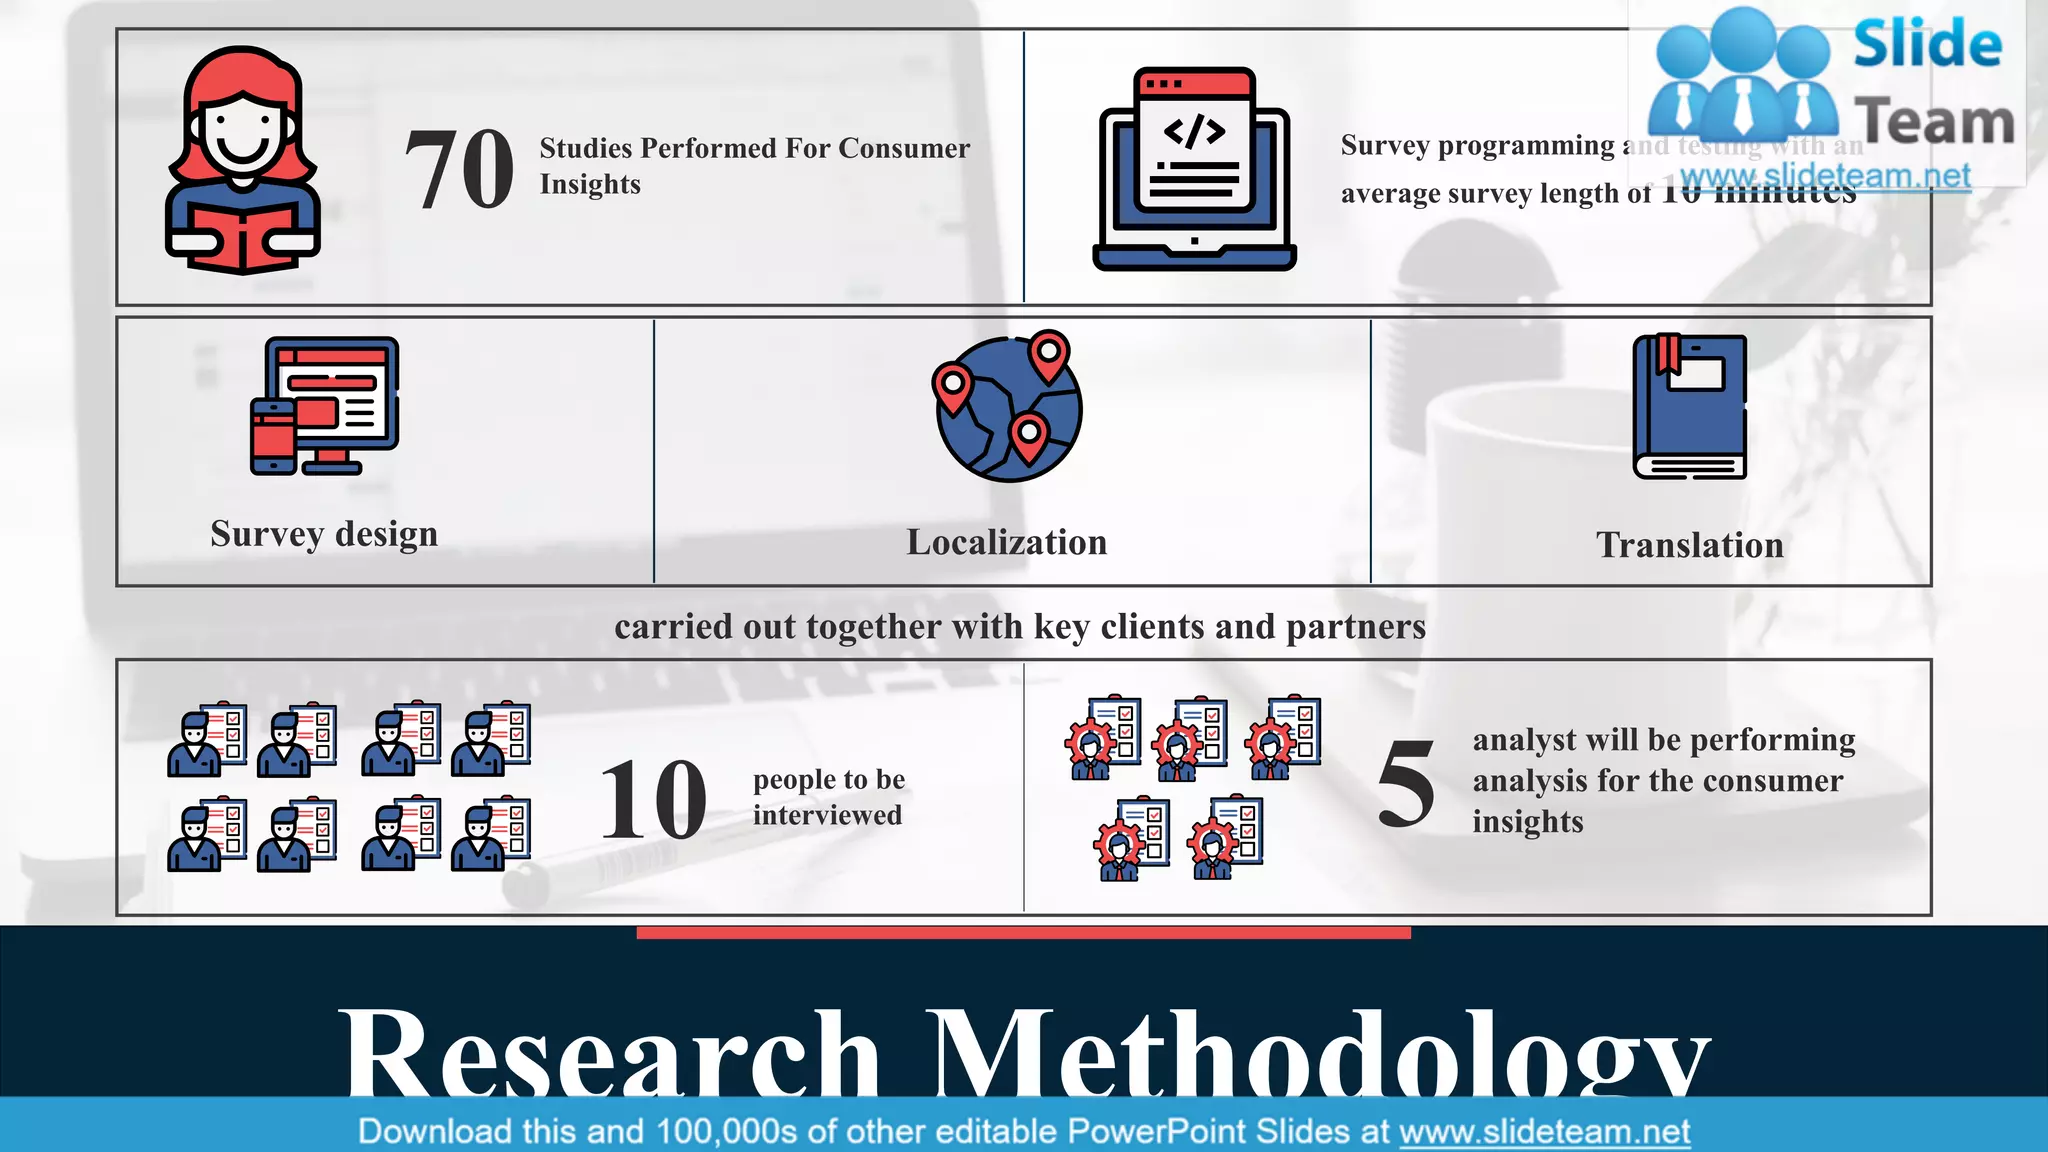
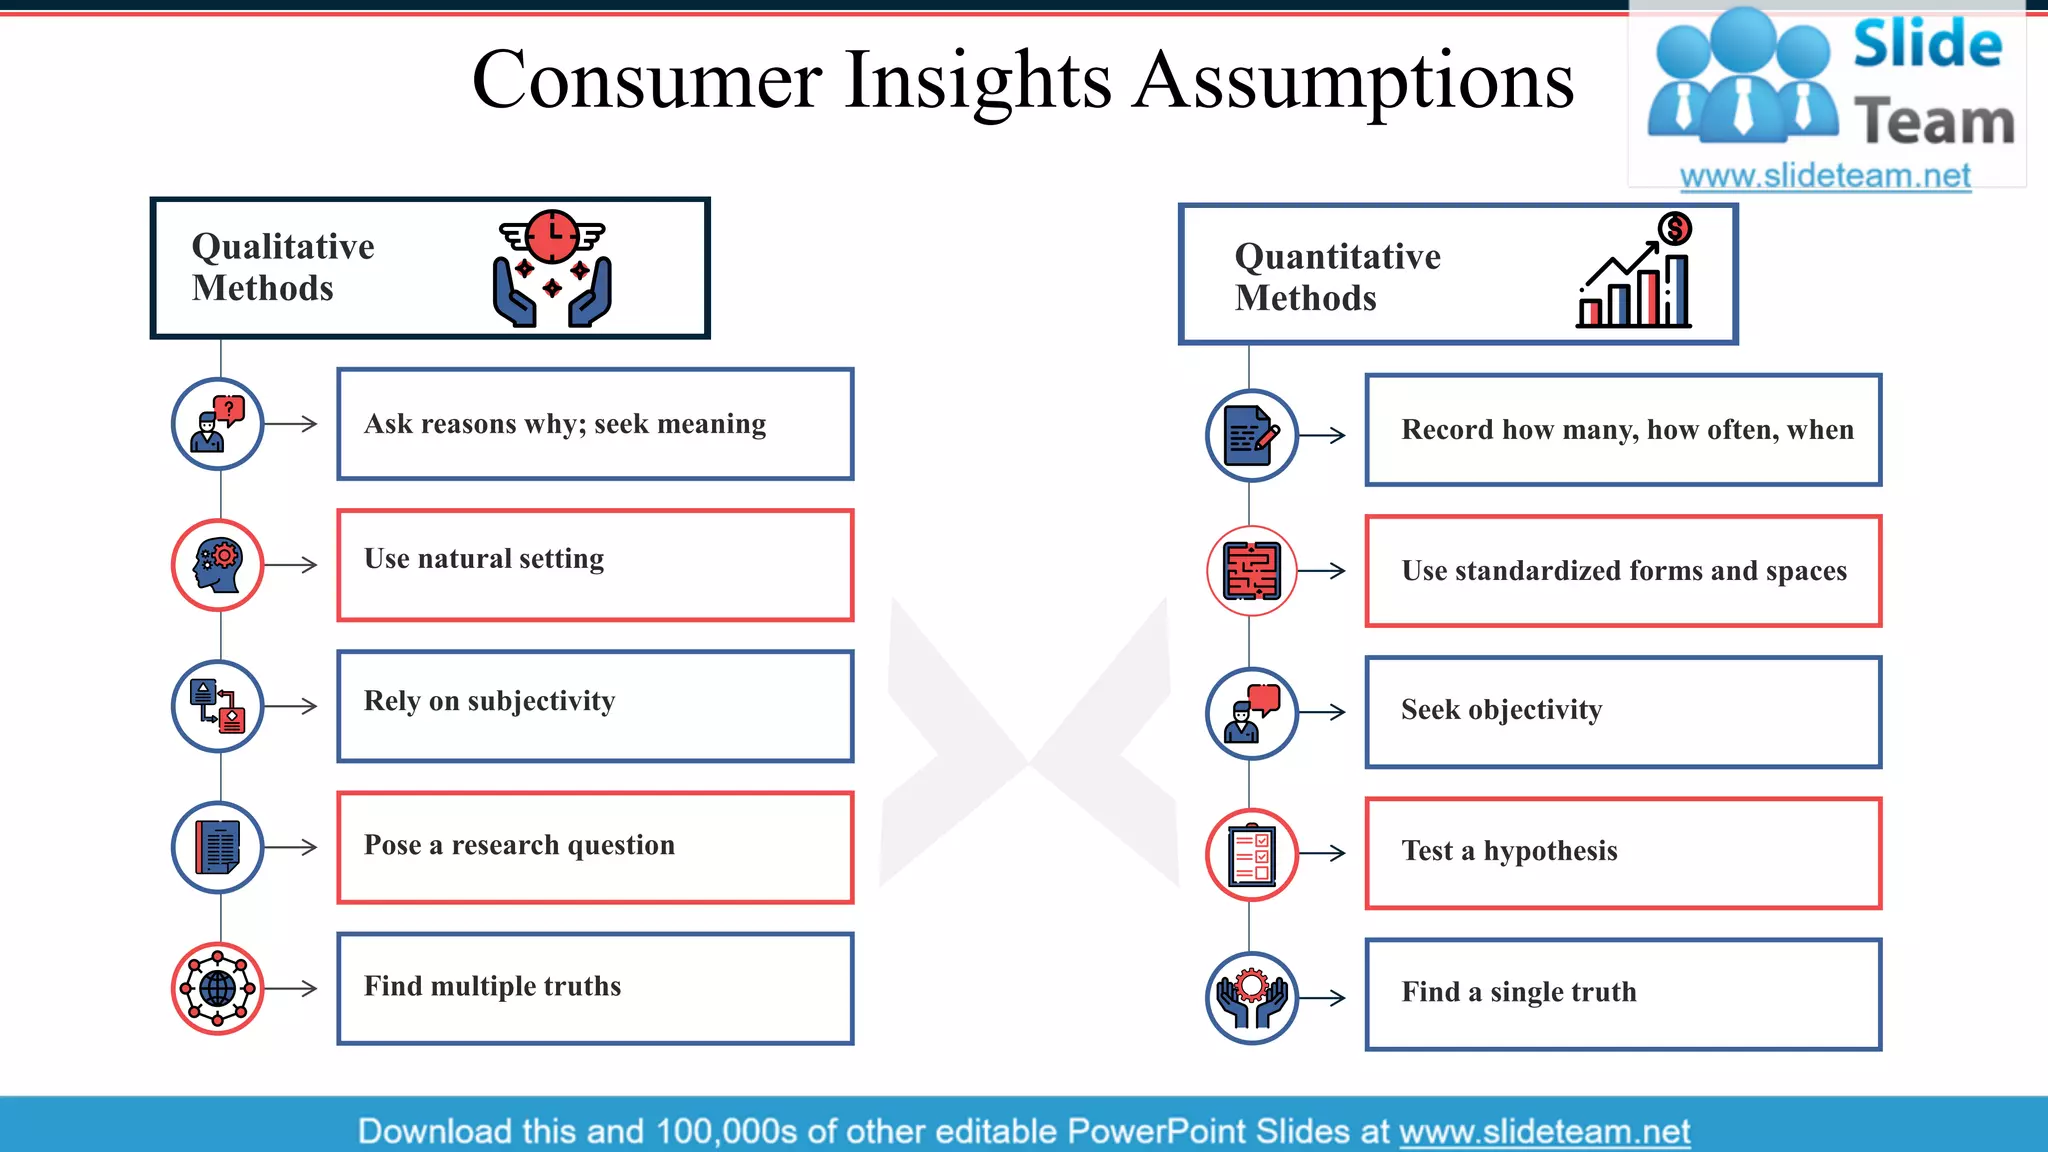
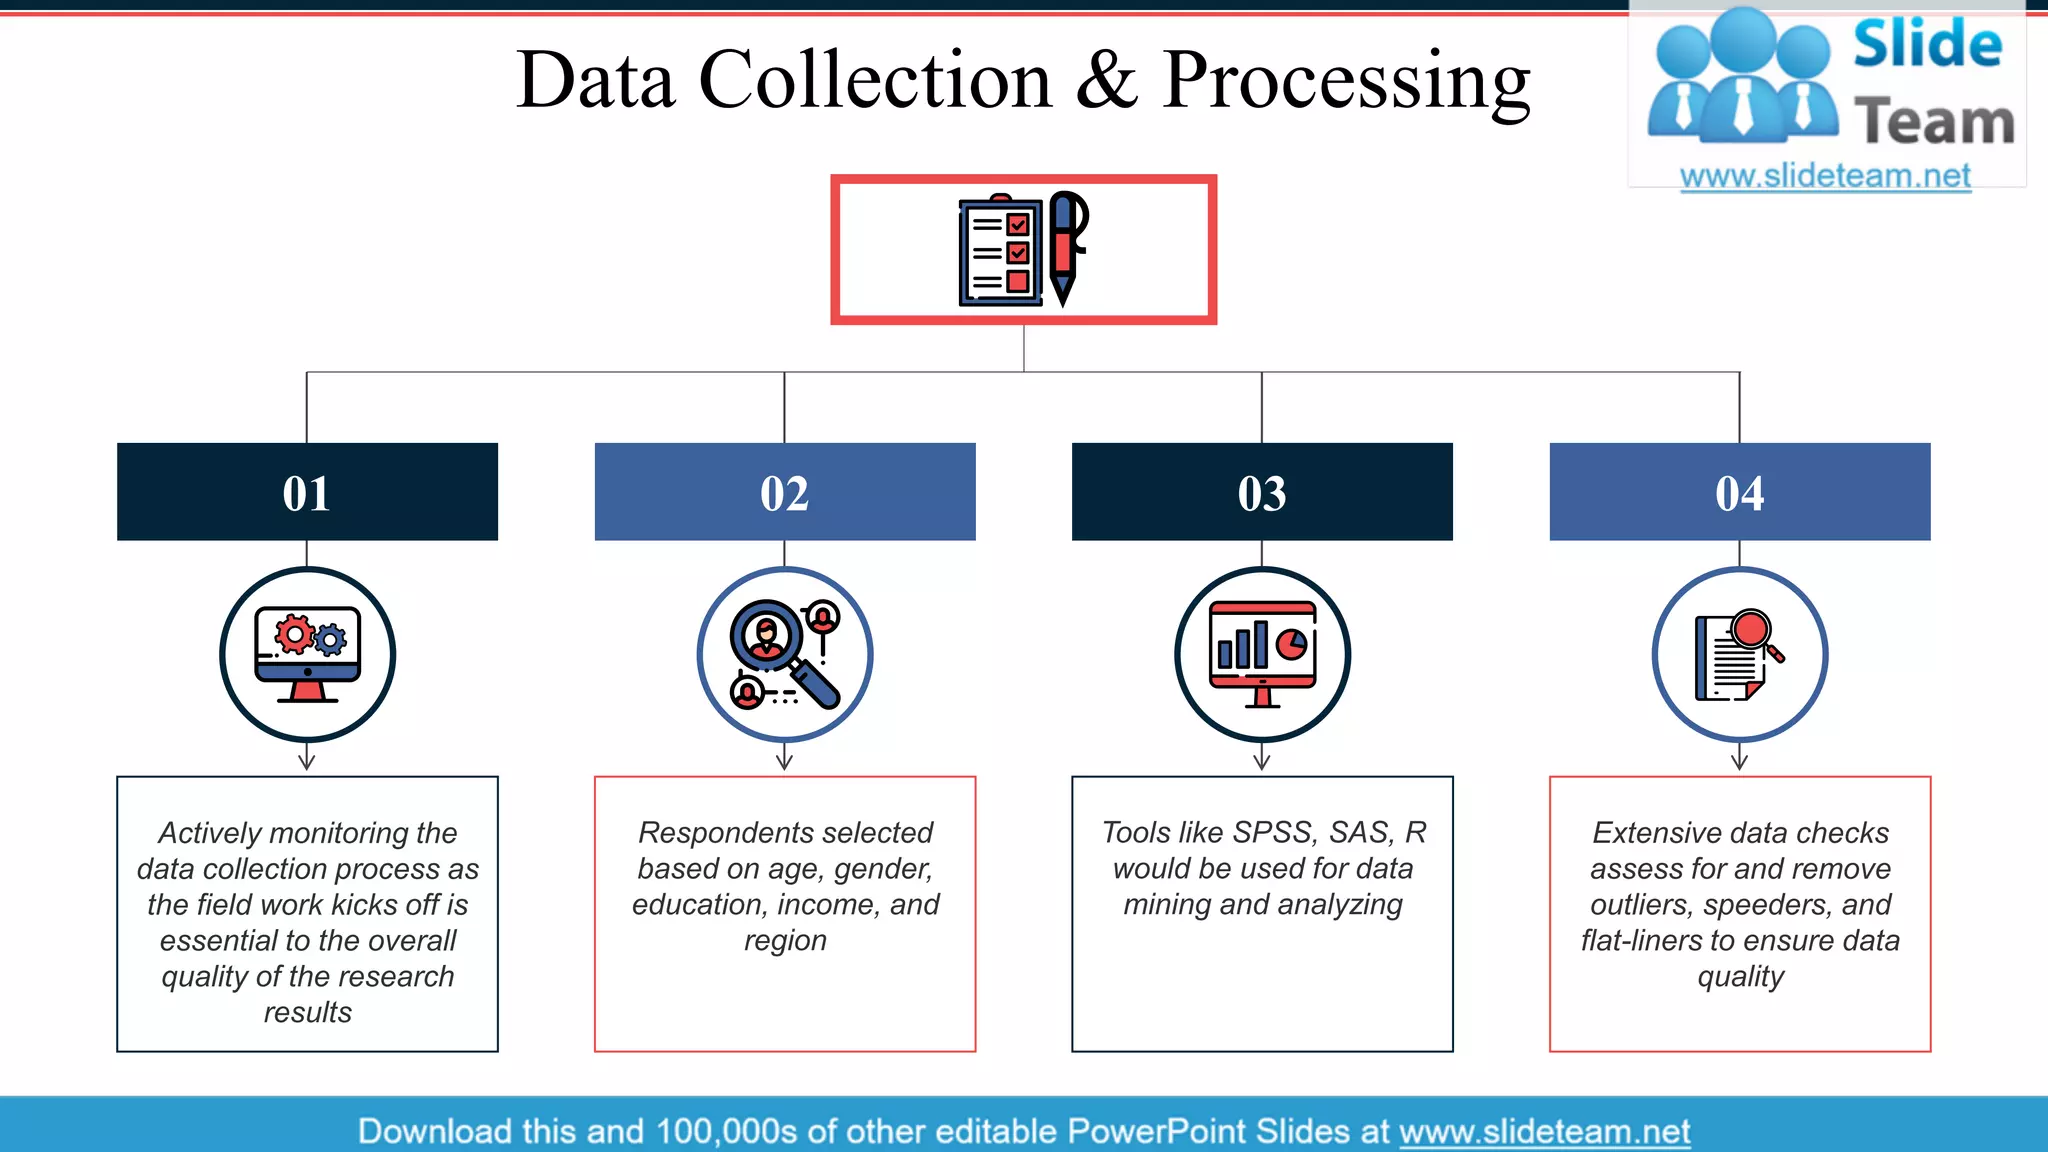
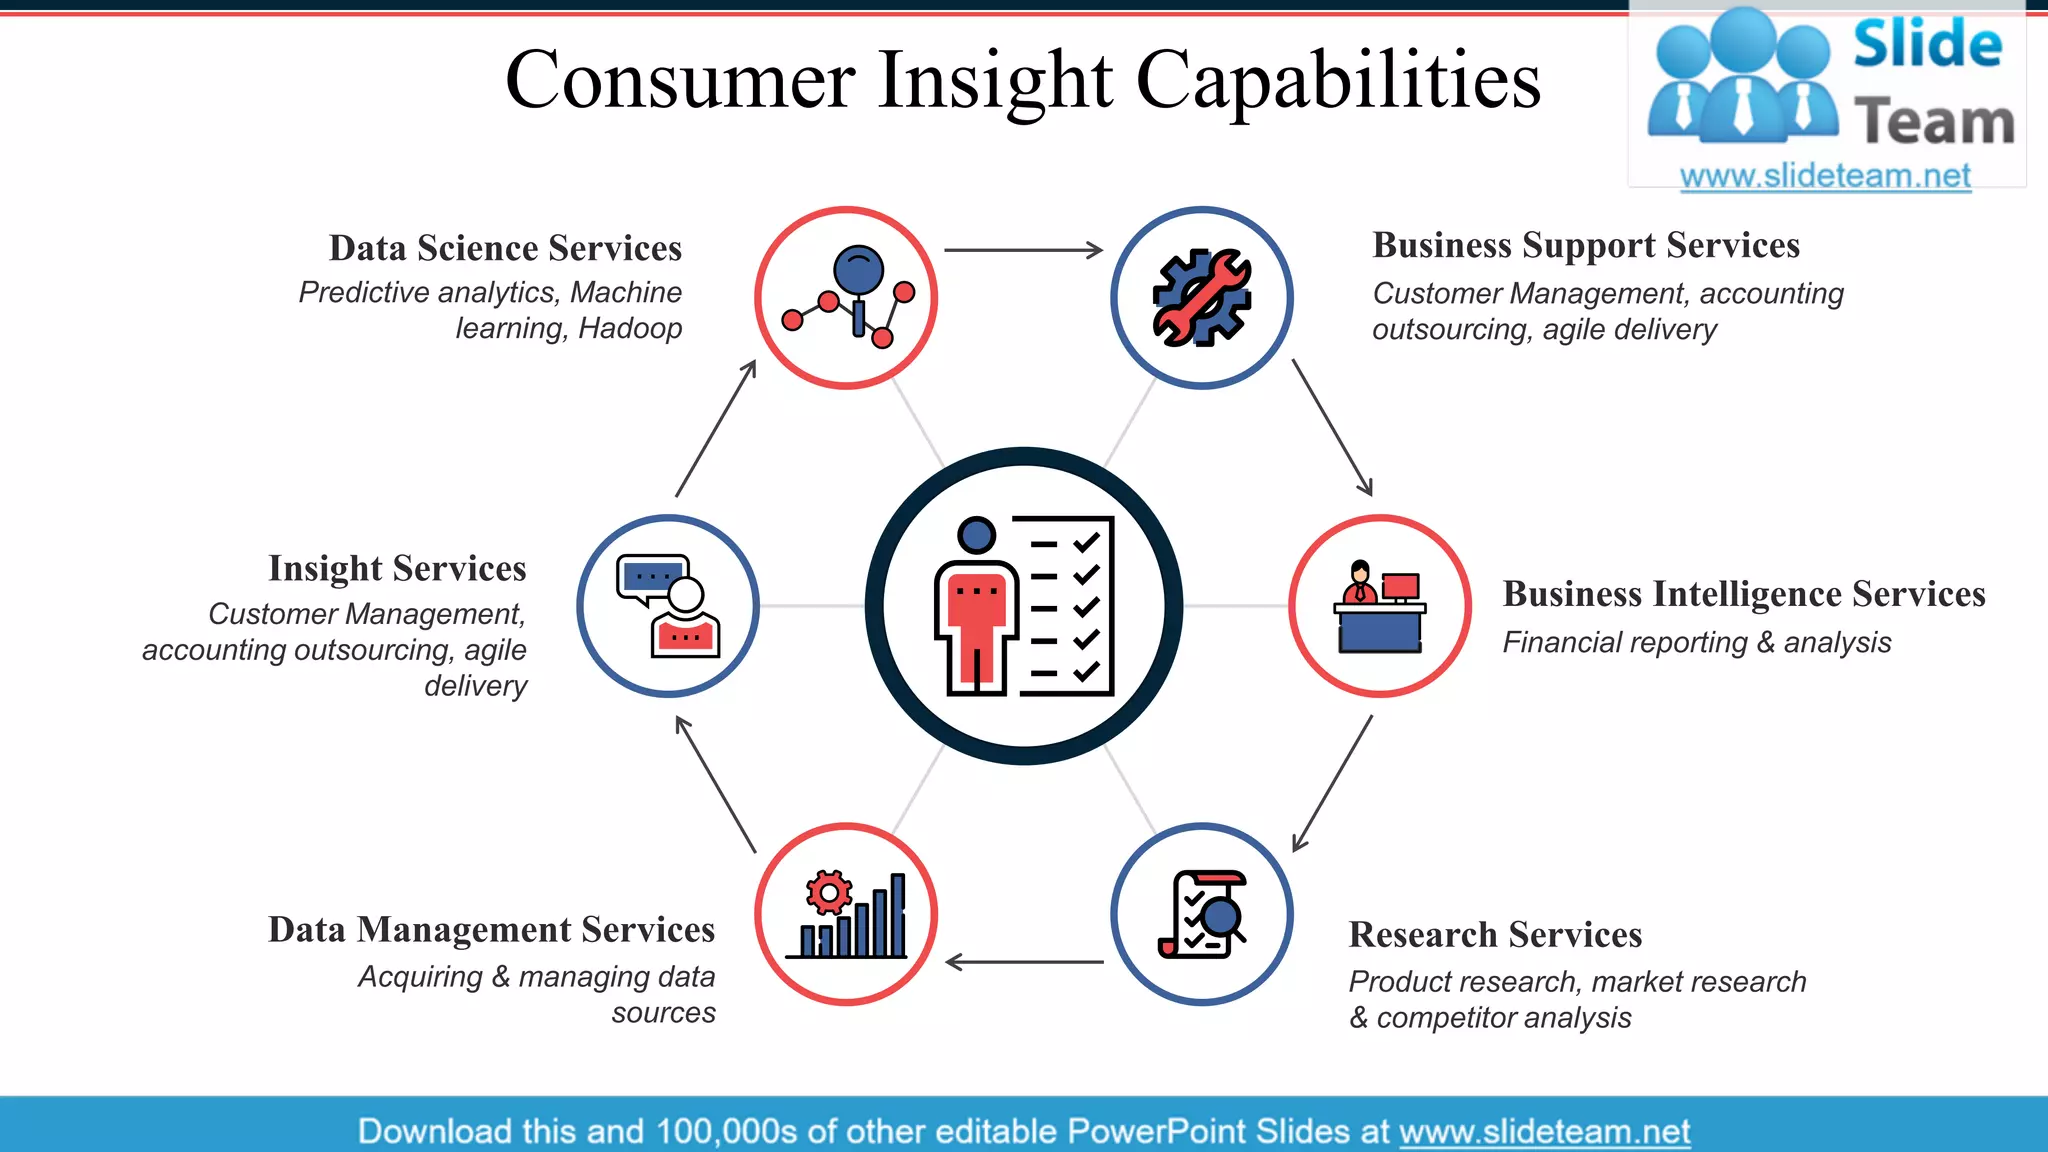
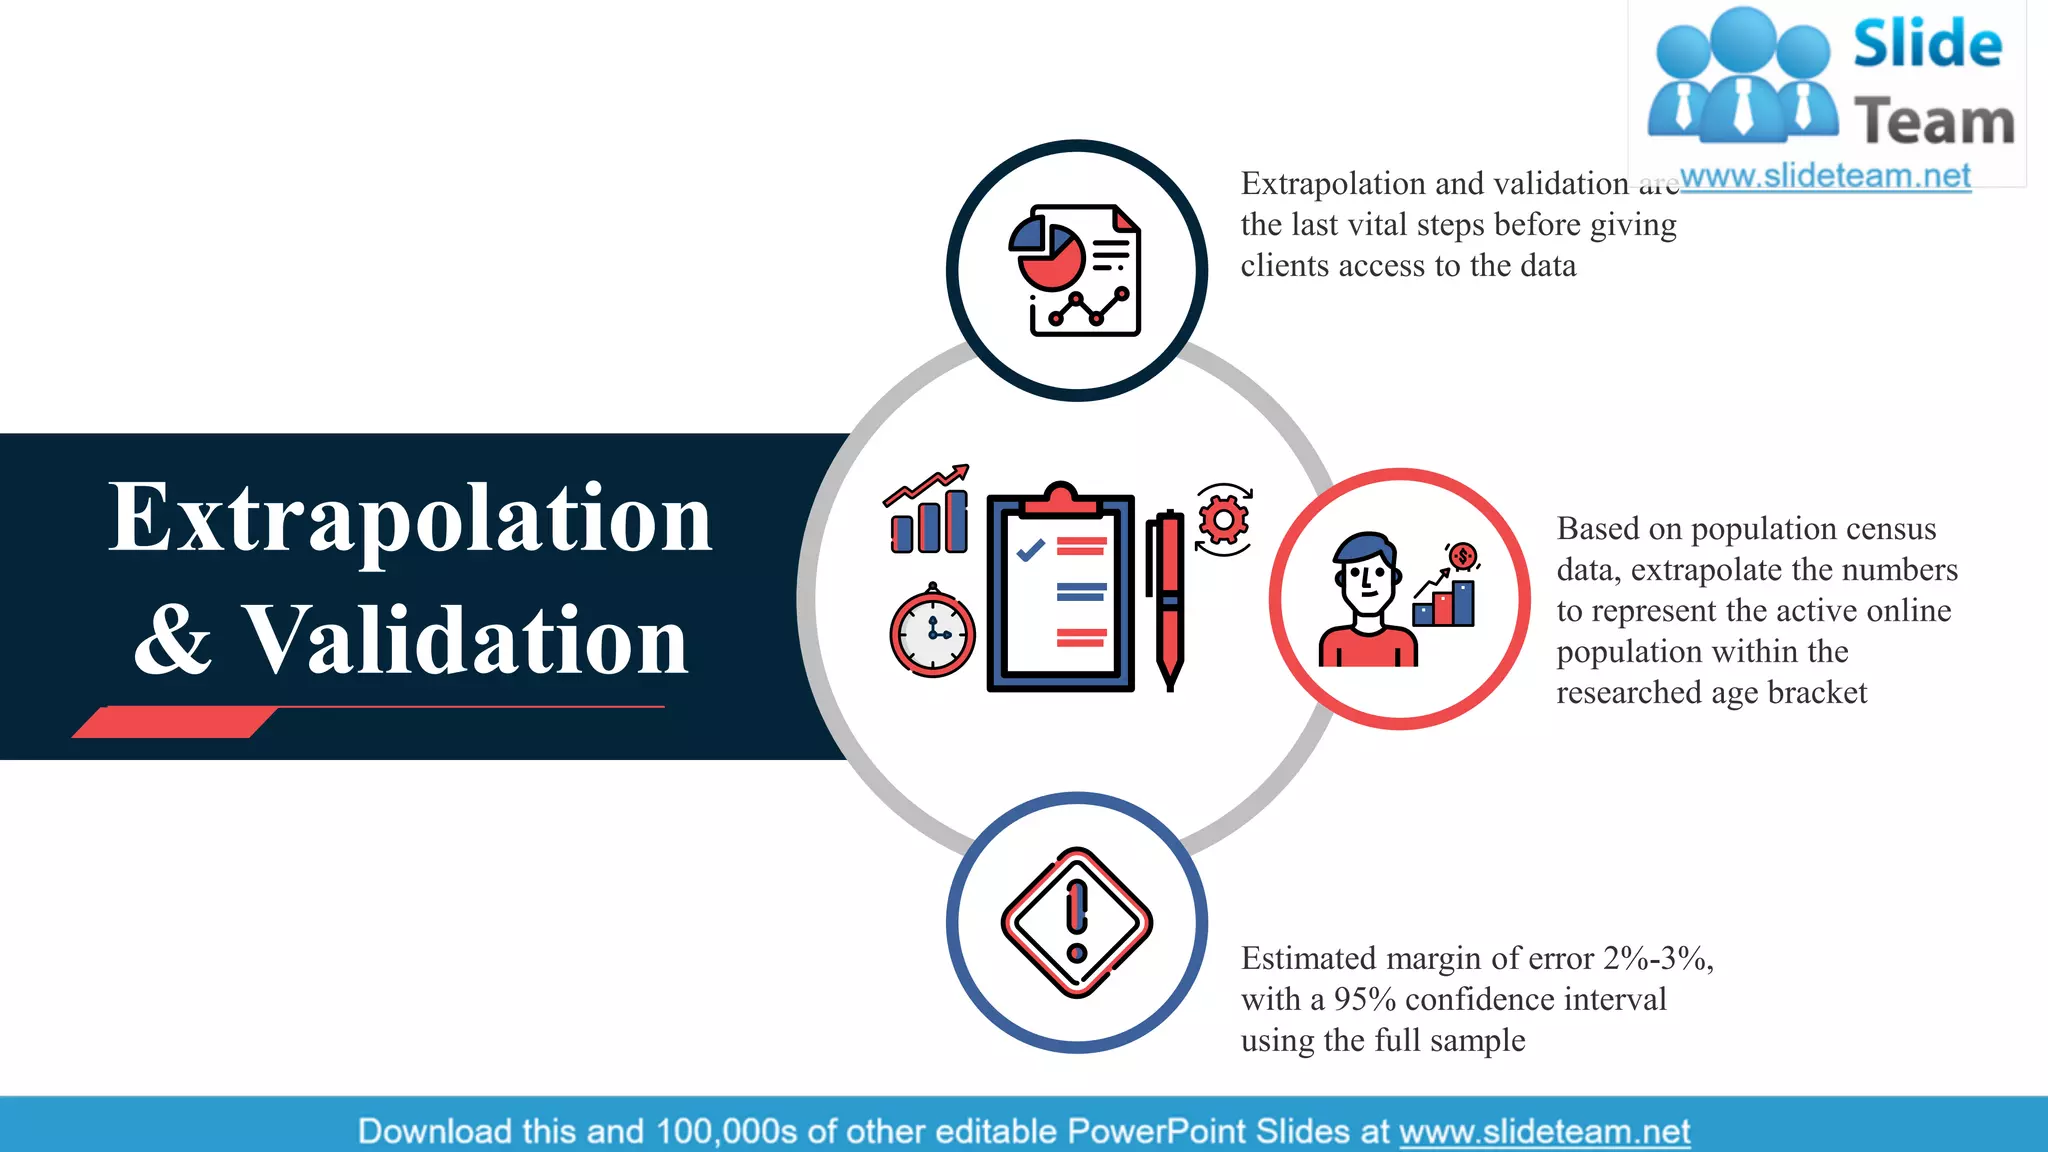
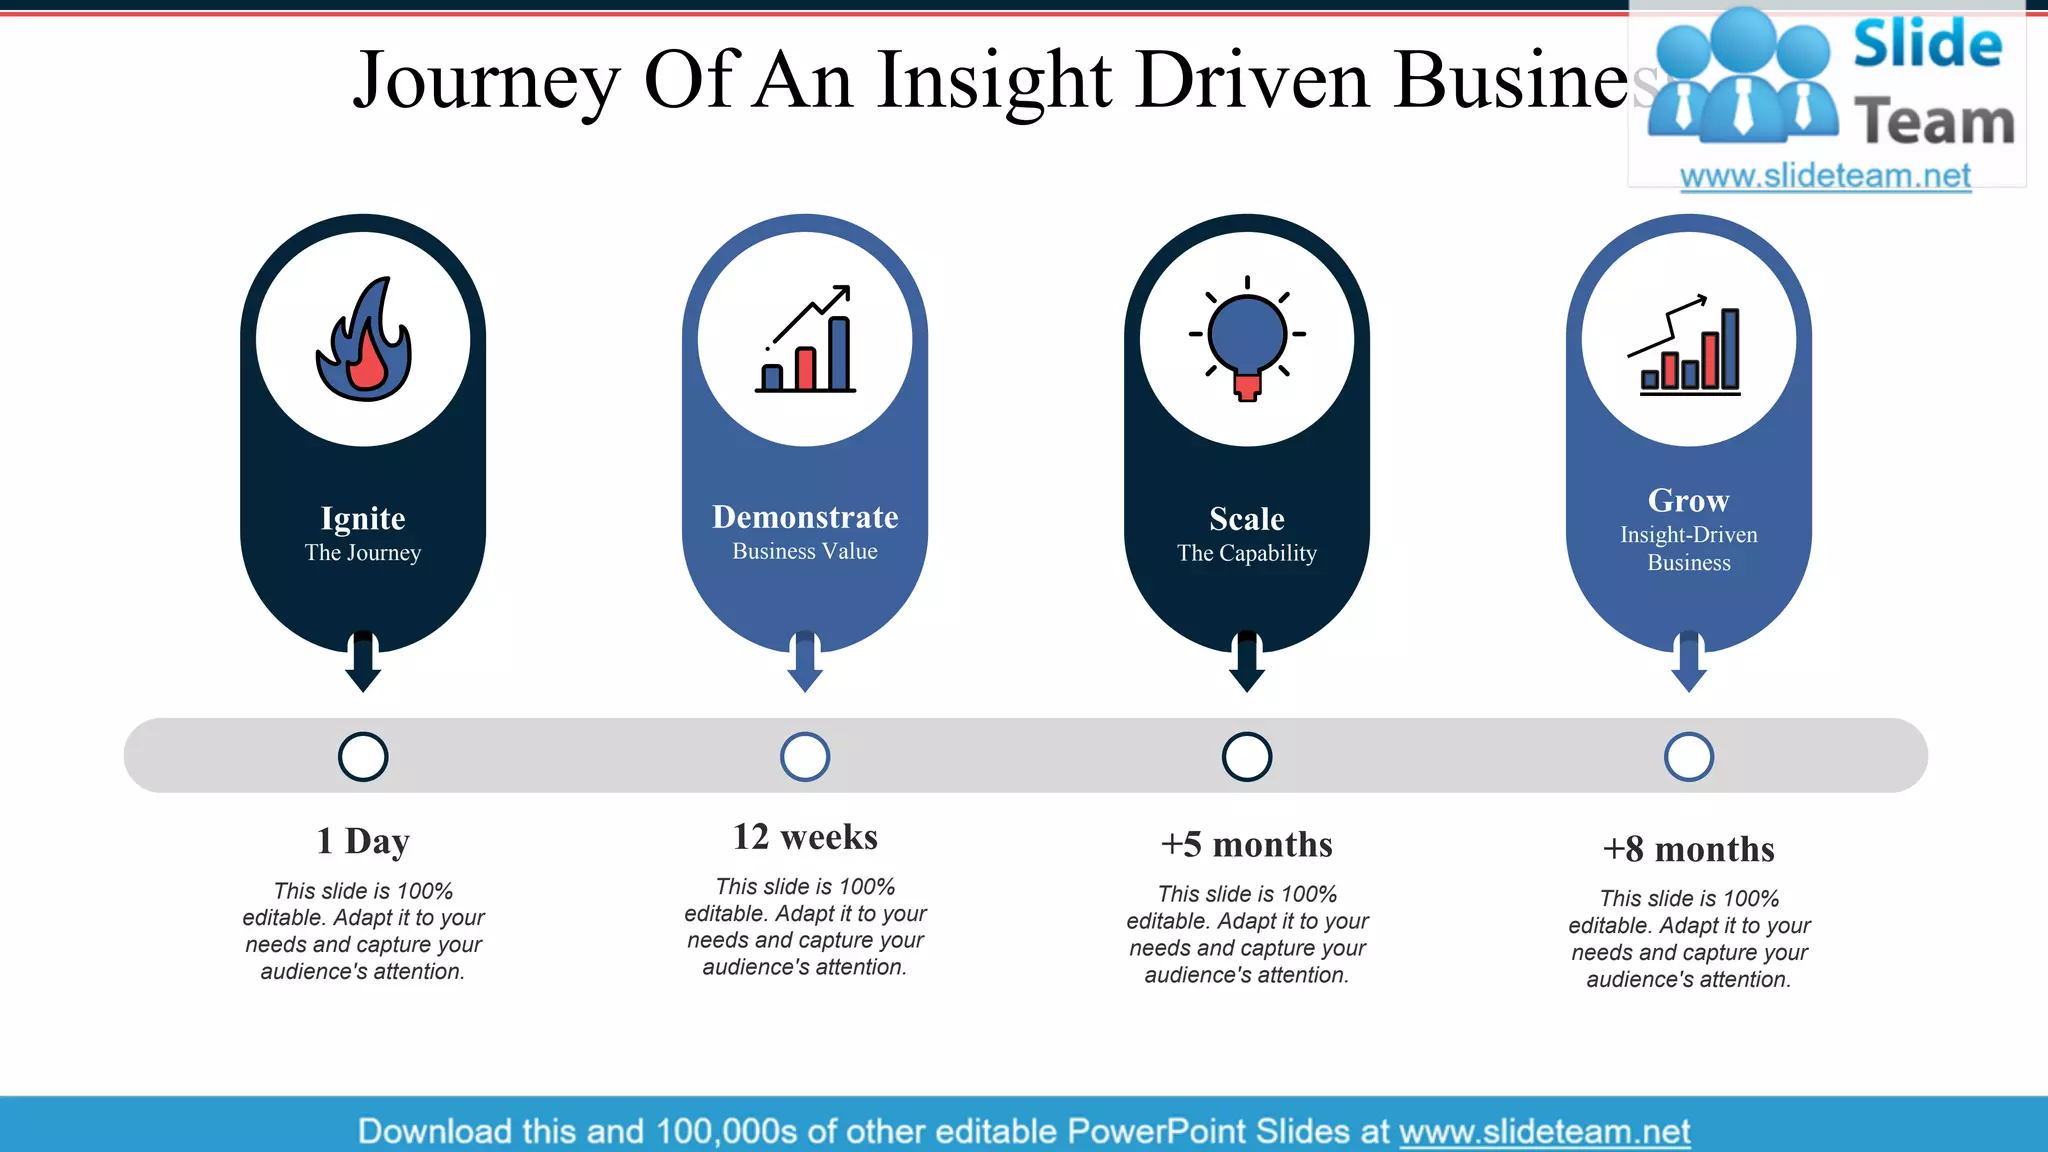
Detailing the methodology for consumer insights covering interviews, surveys, data processing, and statistical tools.Describes methods for data collection and processing, including tools for analytics and various consumer insight capabilities.
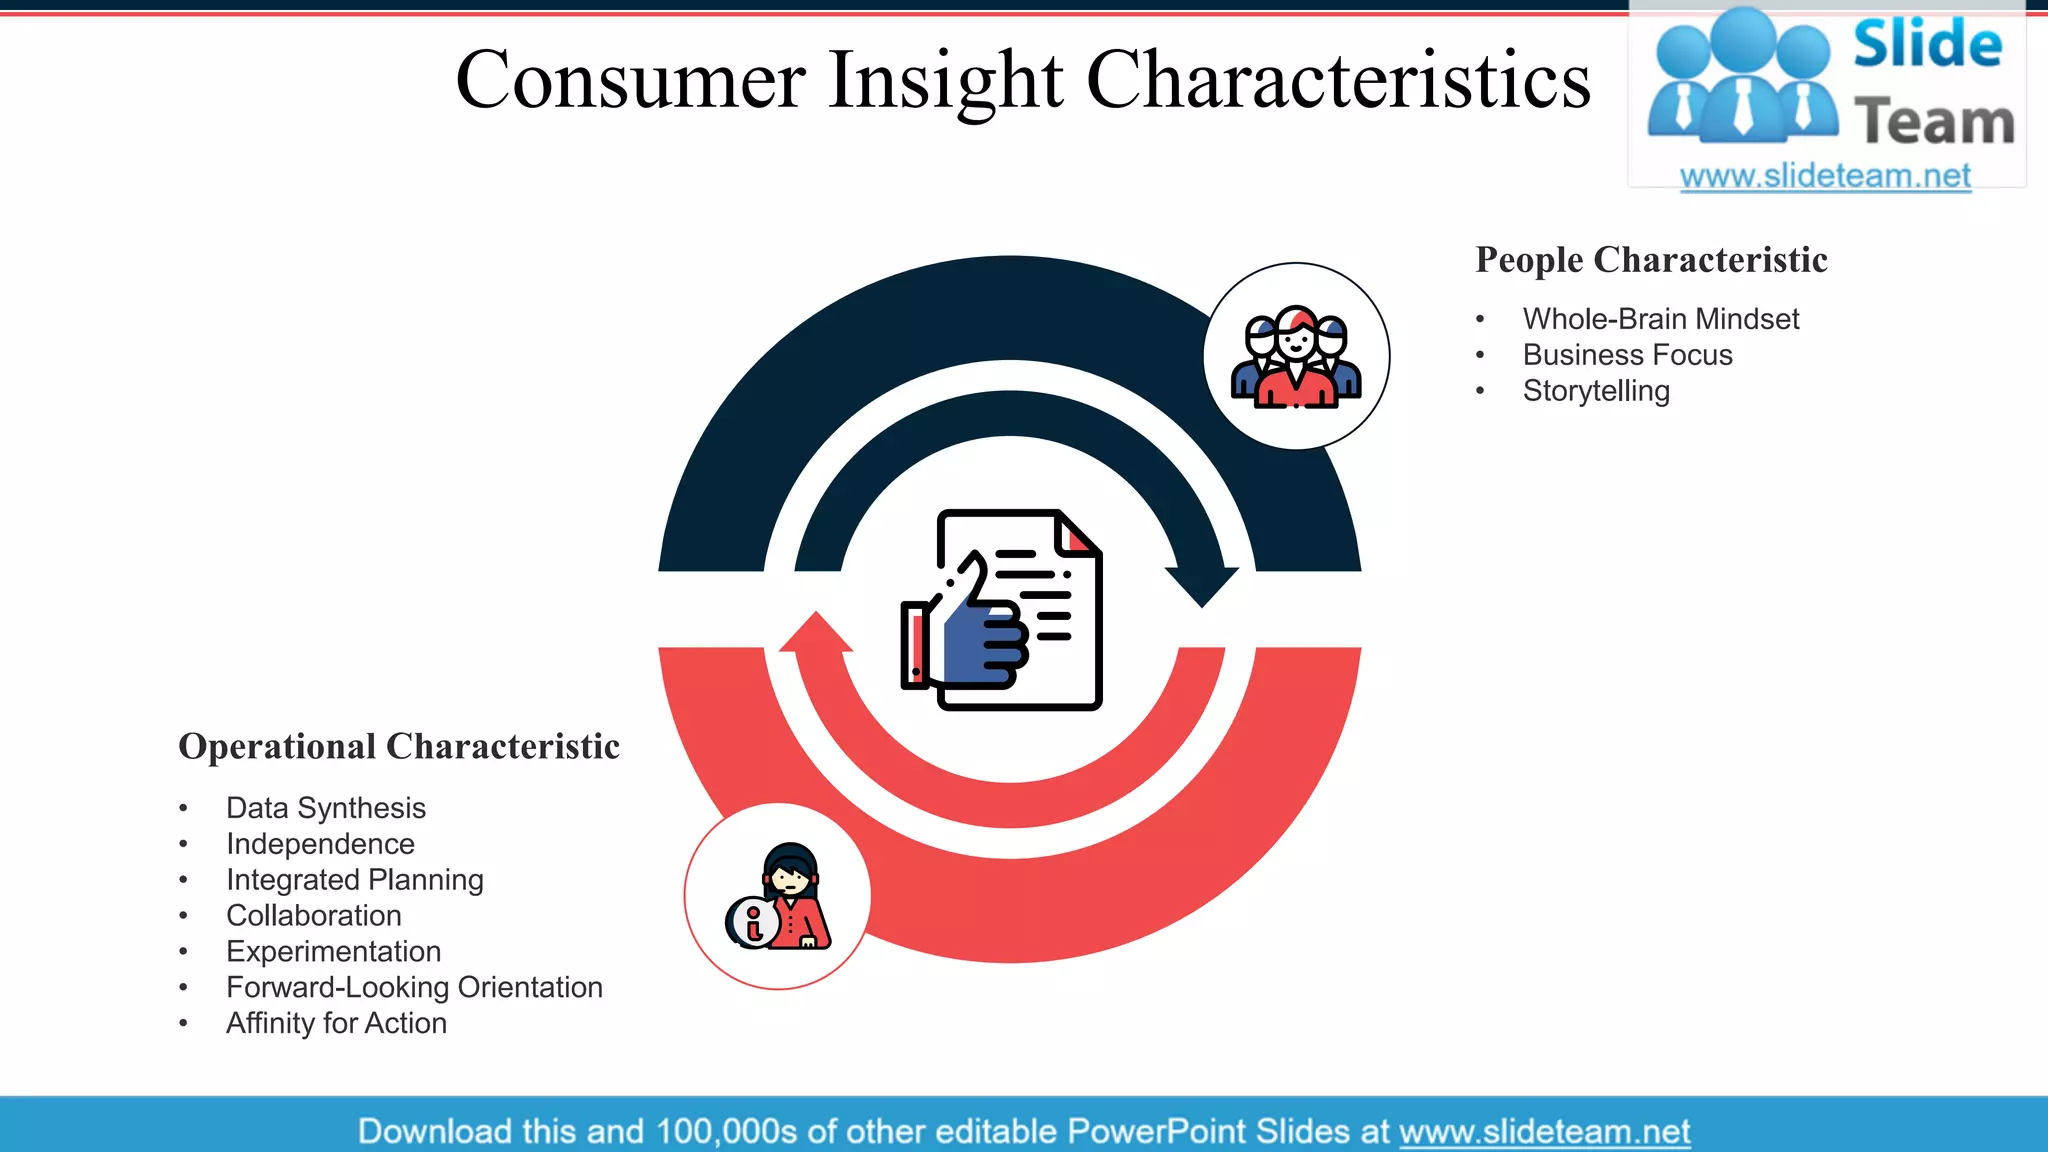
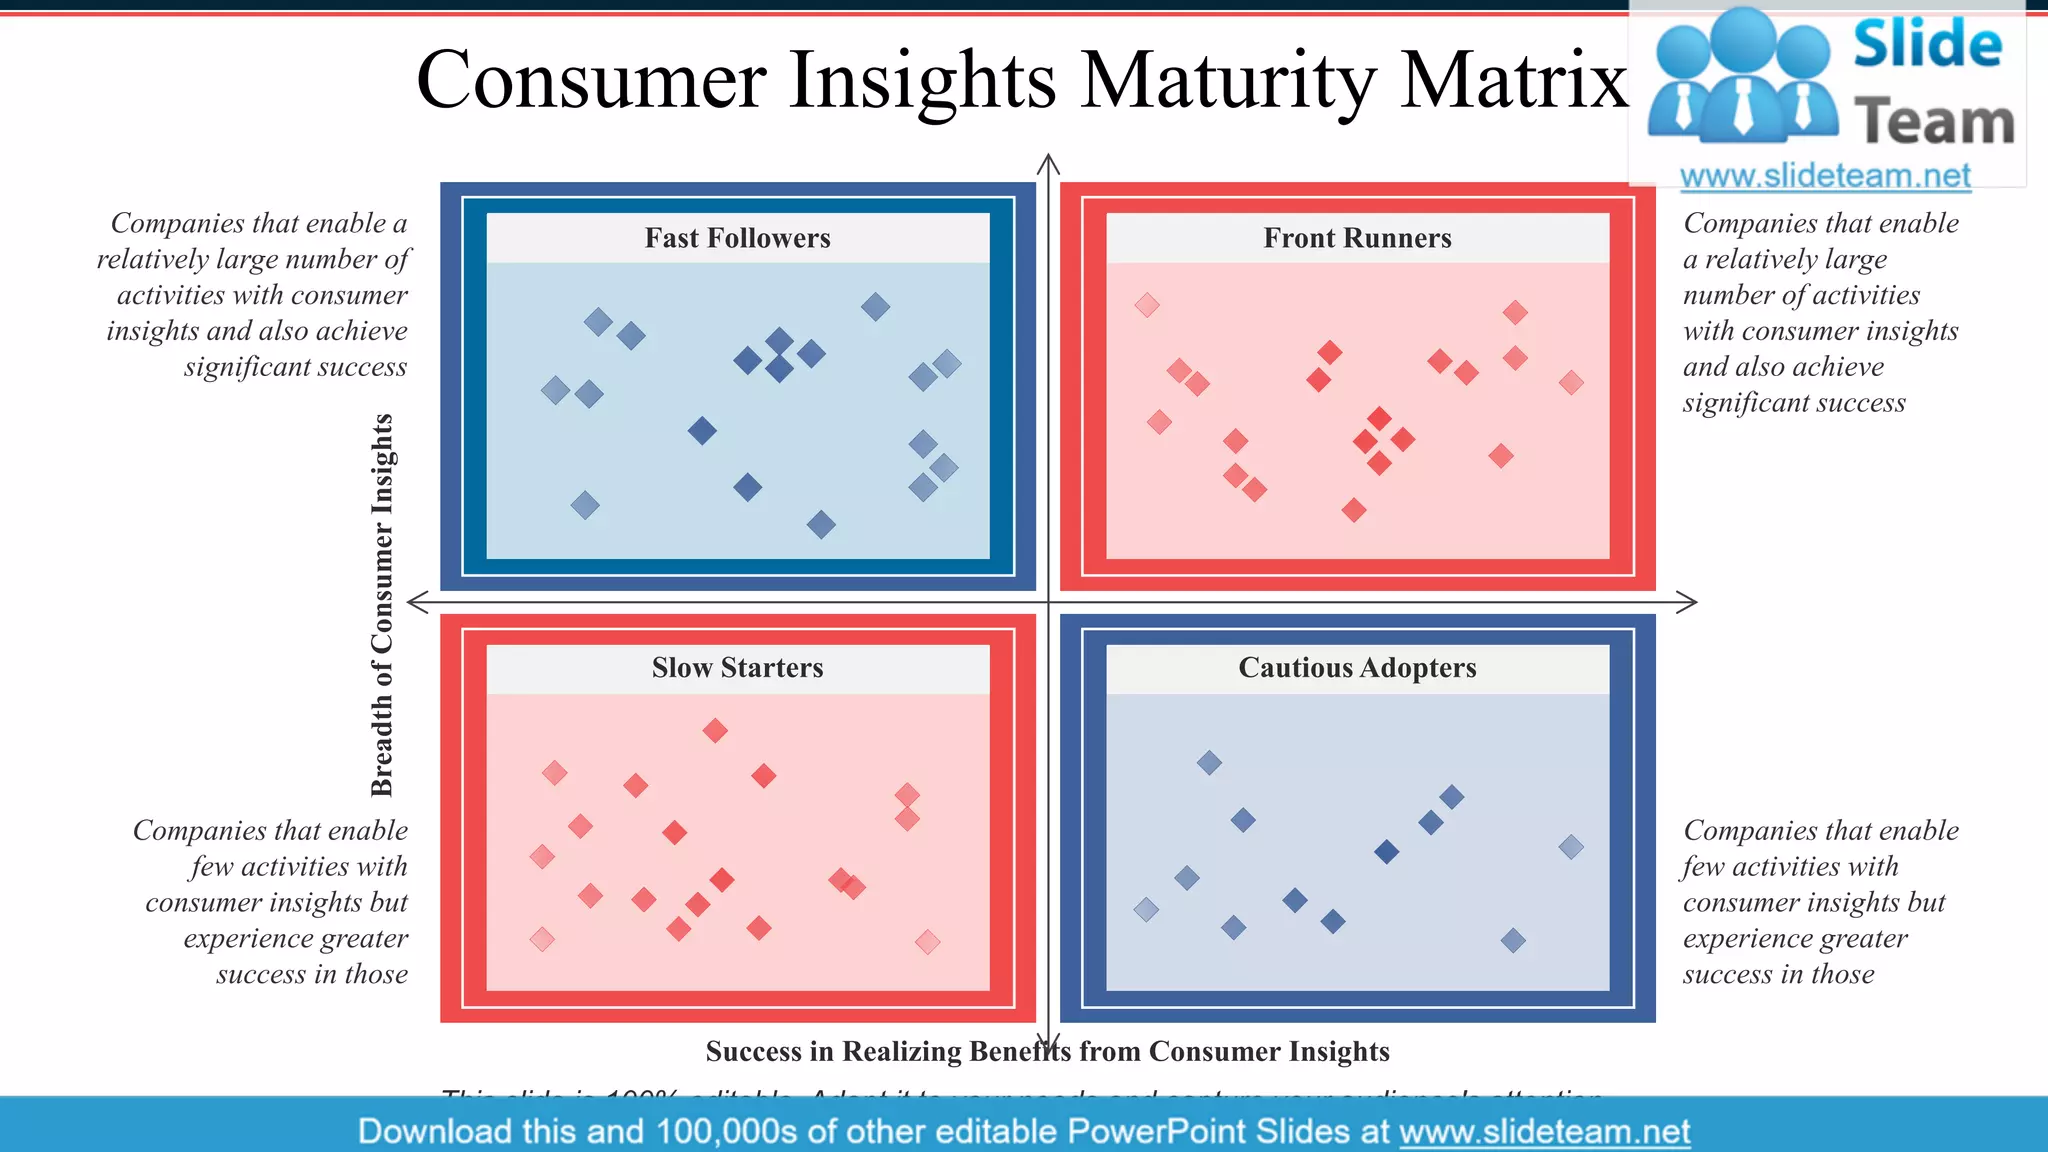
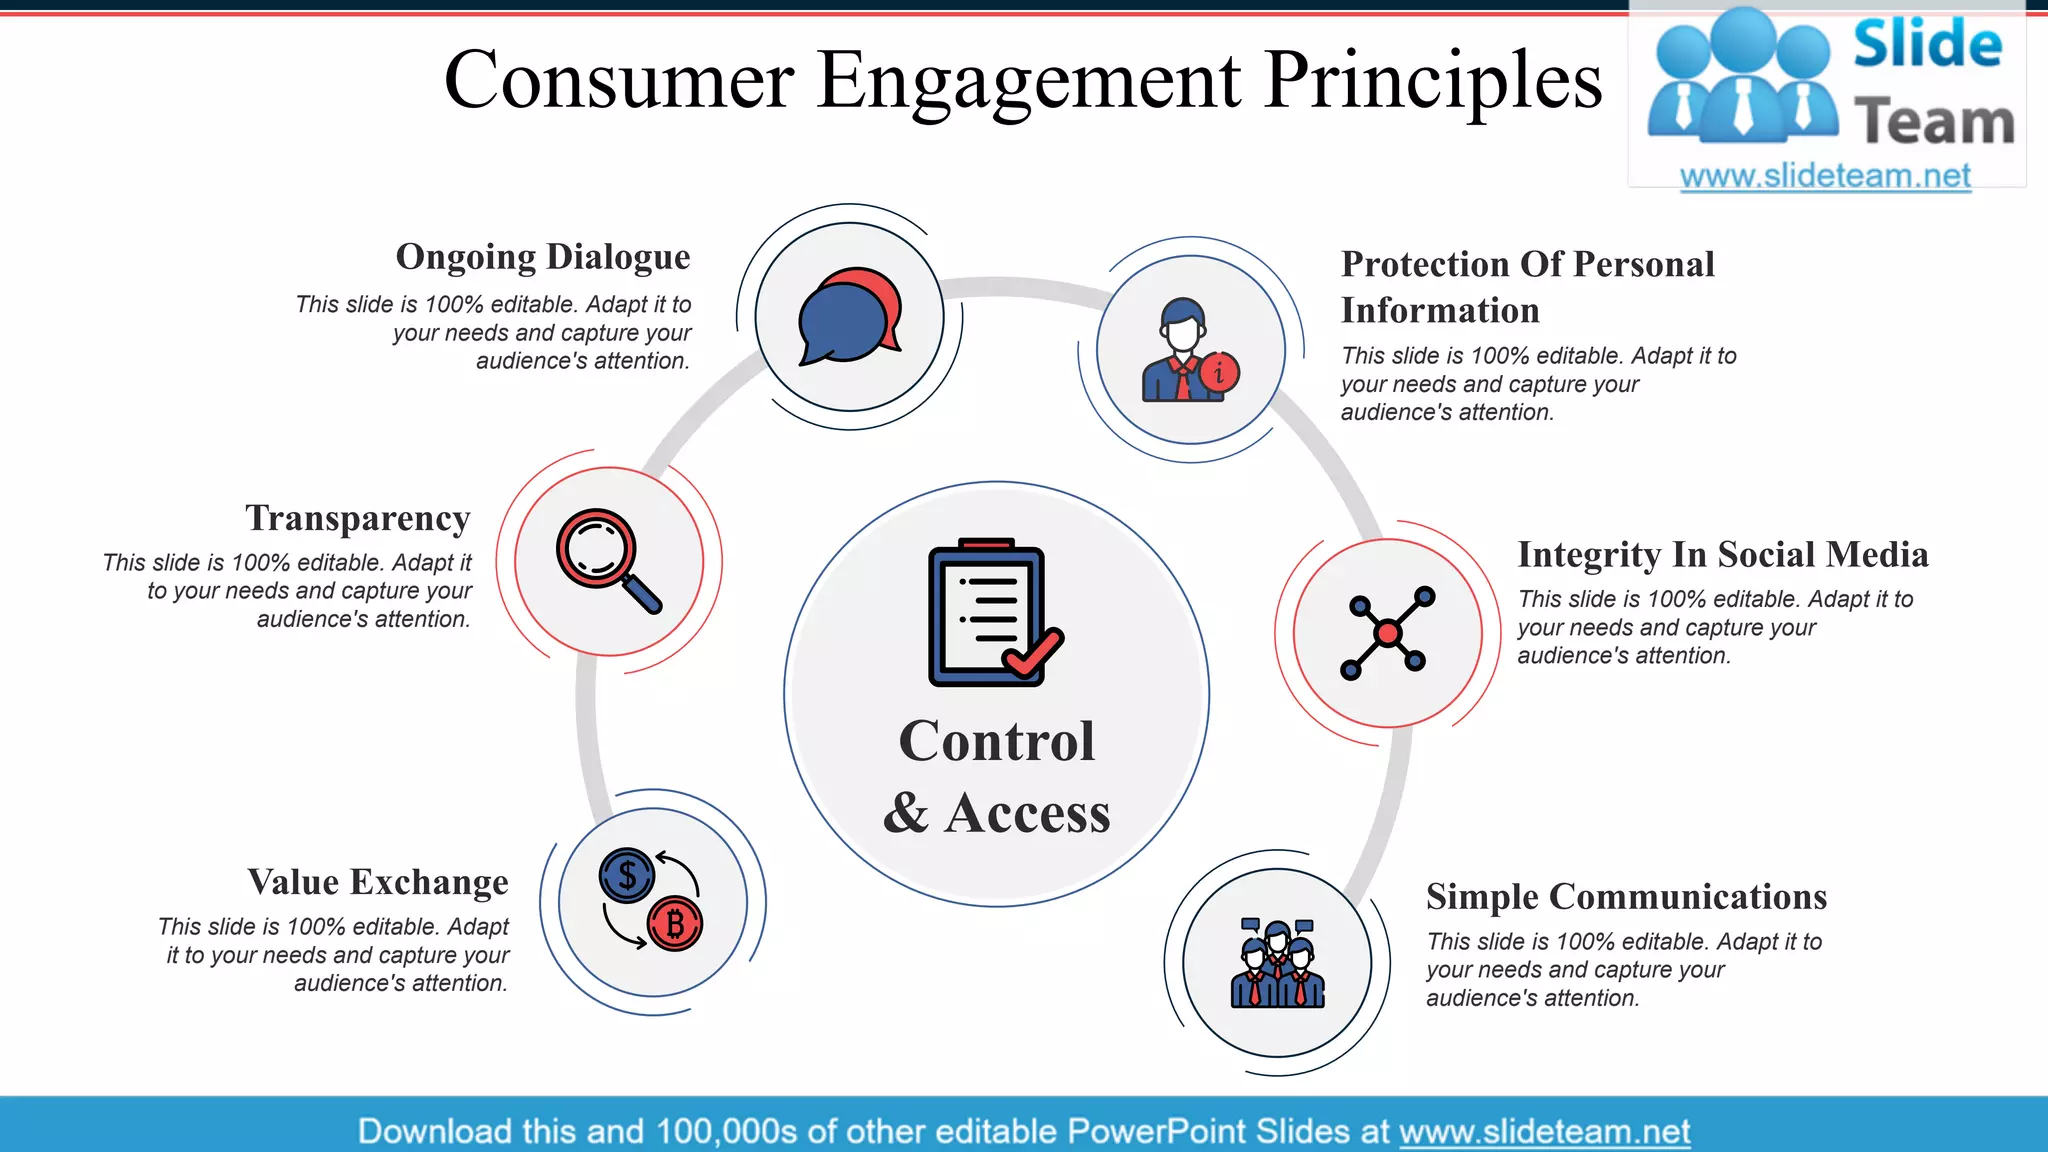
Exploration of consumer insight components and characteristics that shape insights effectively.
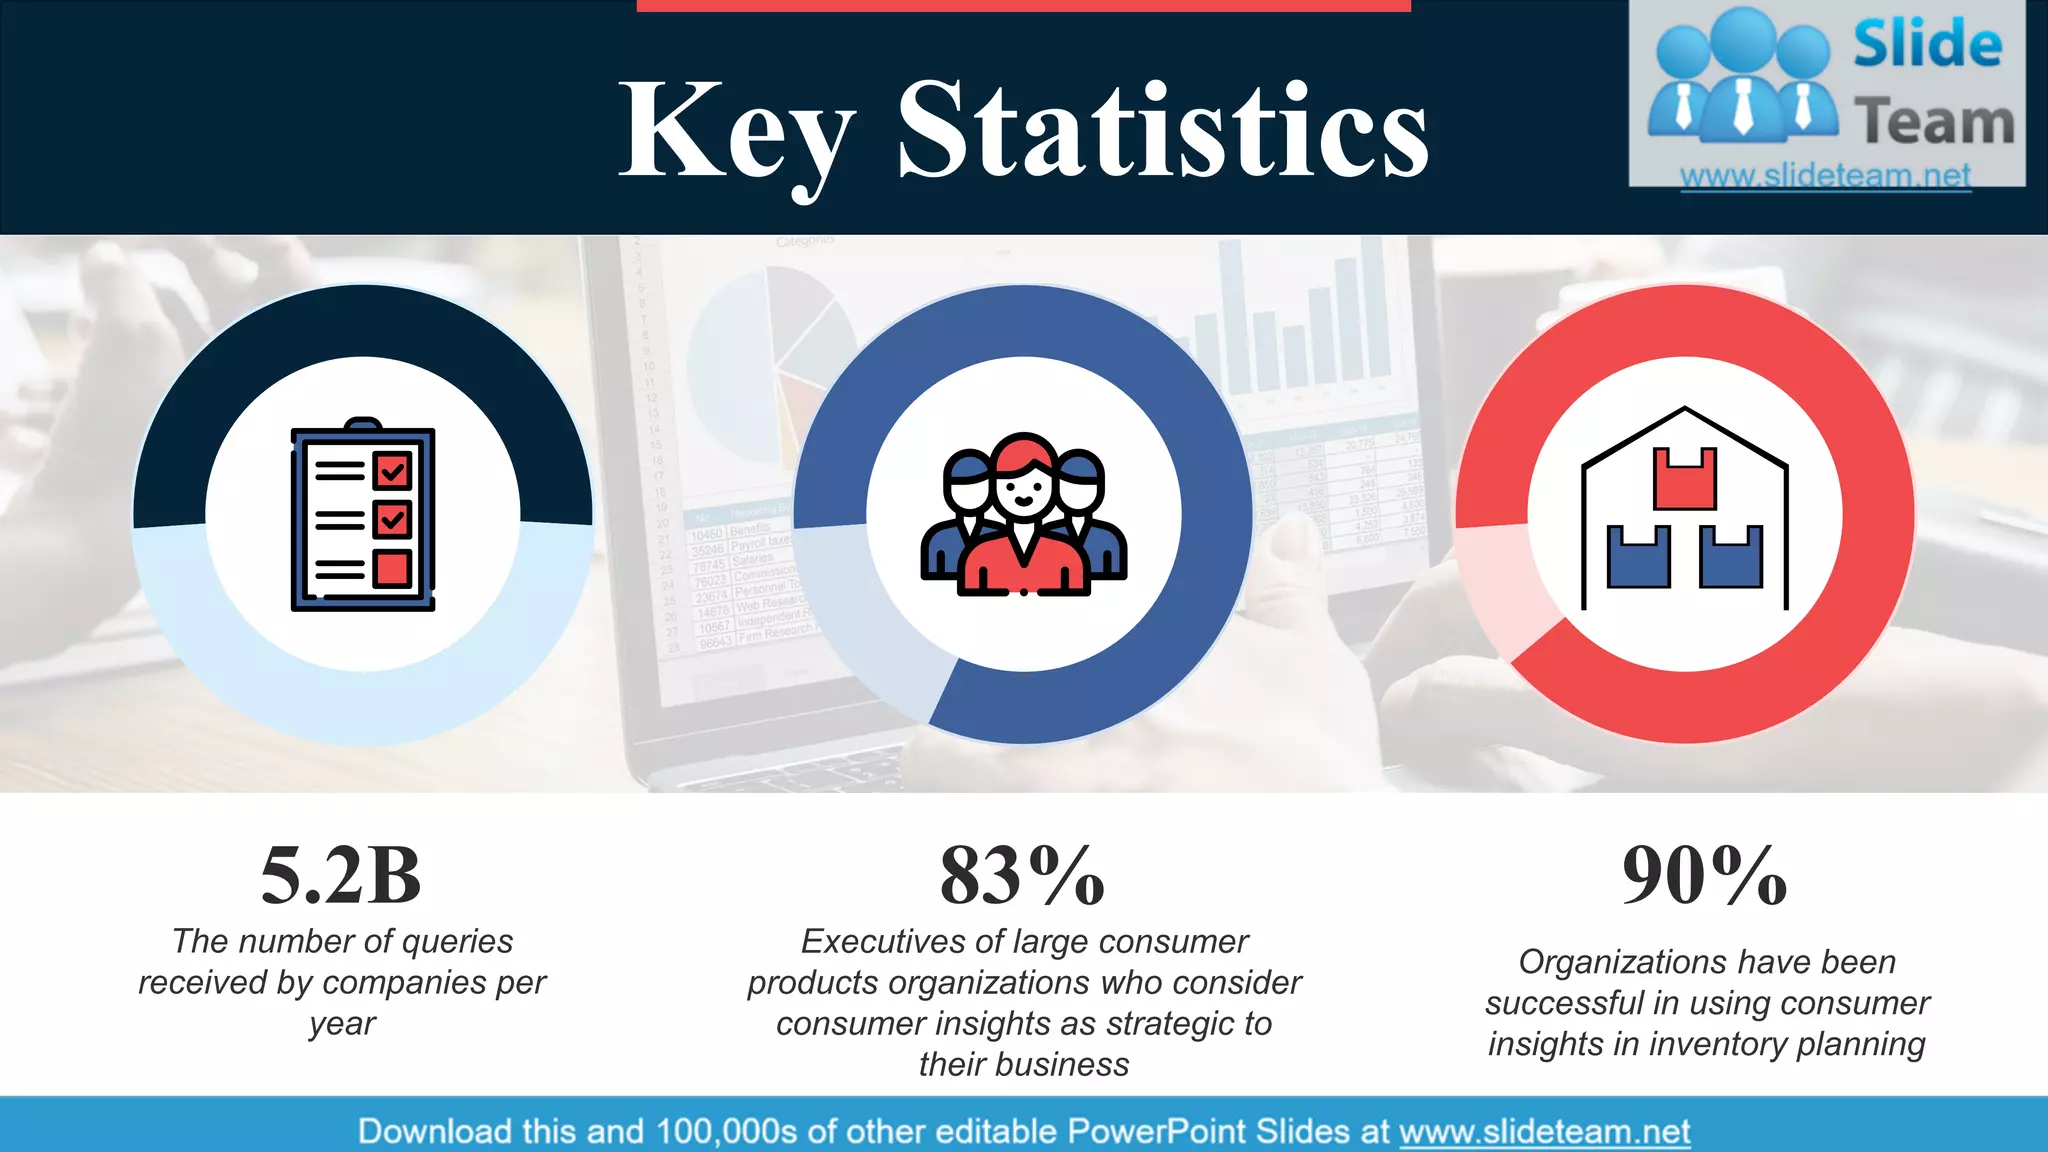
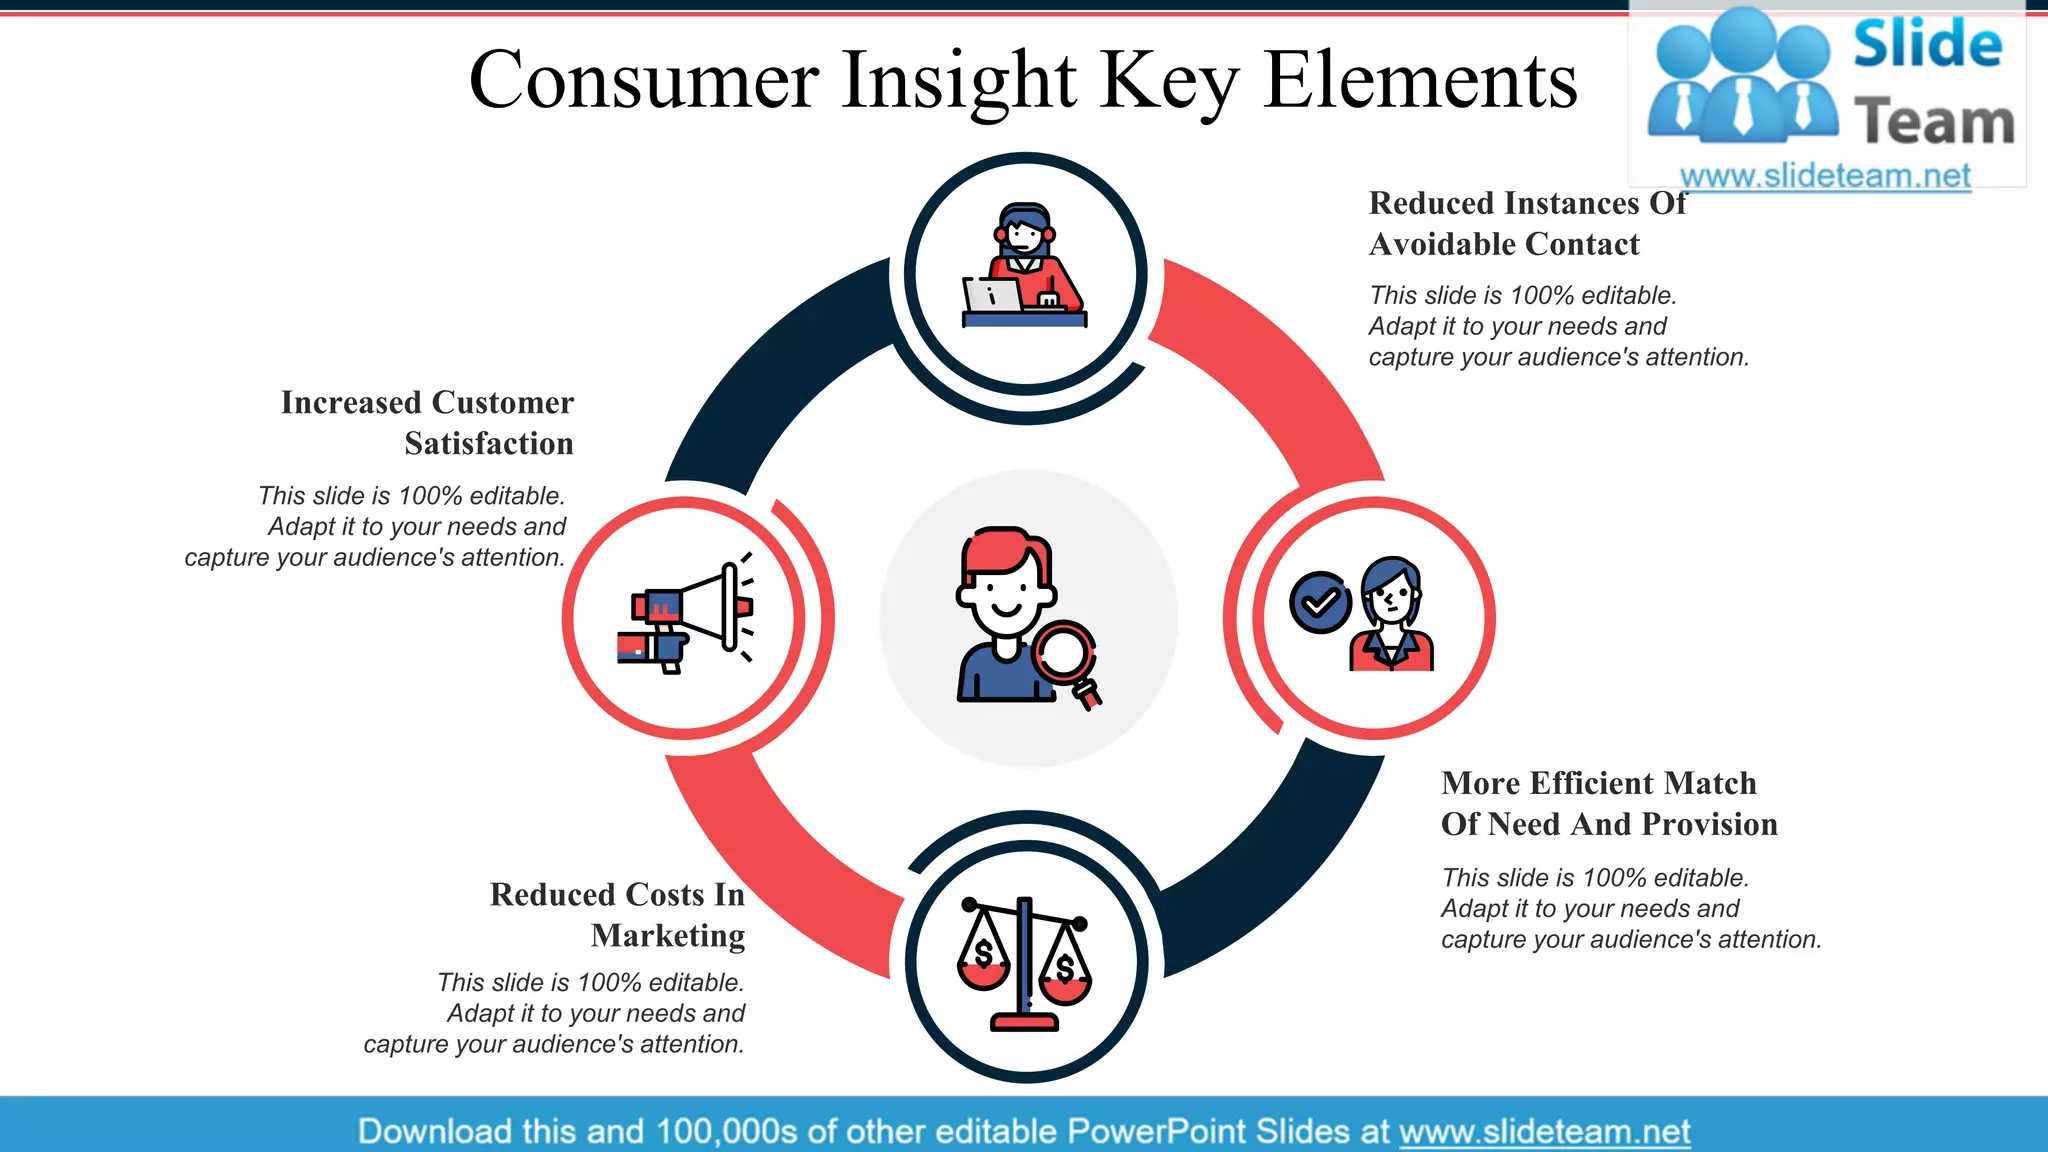
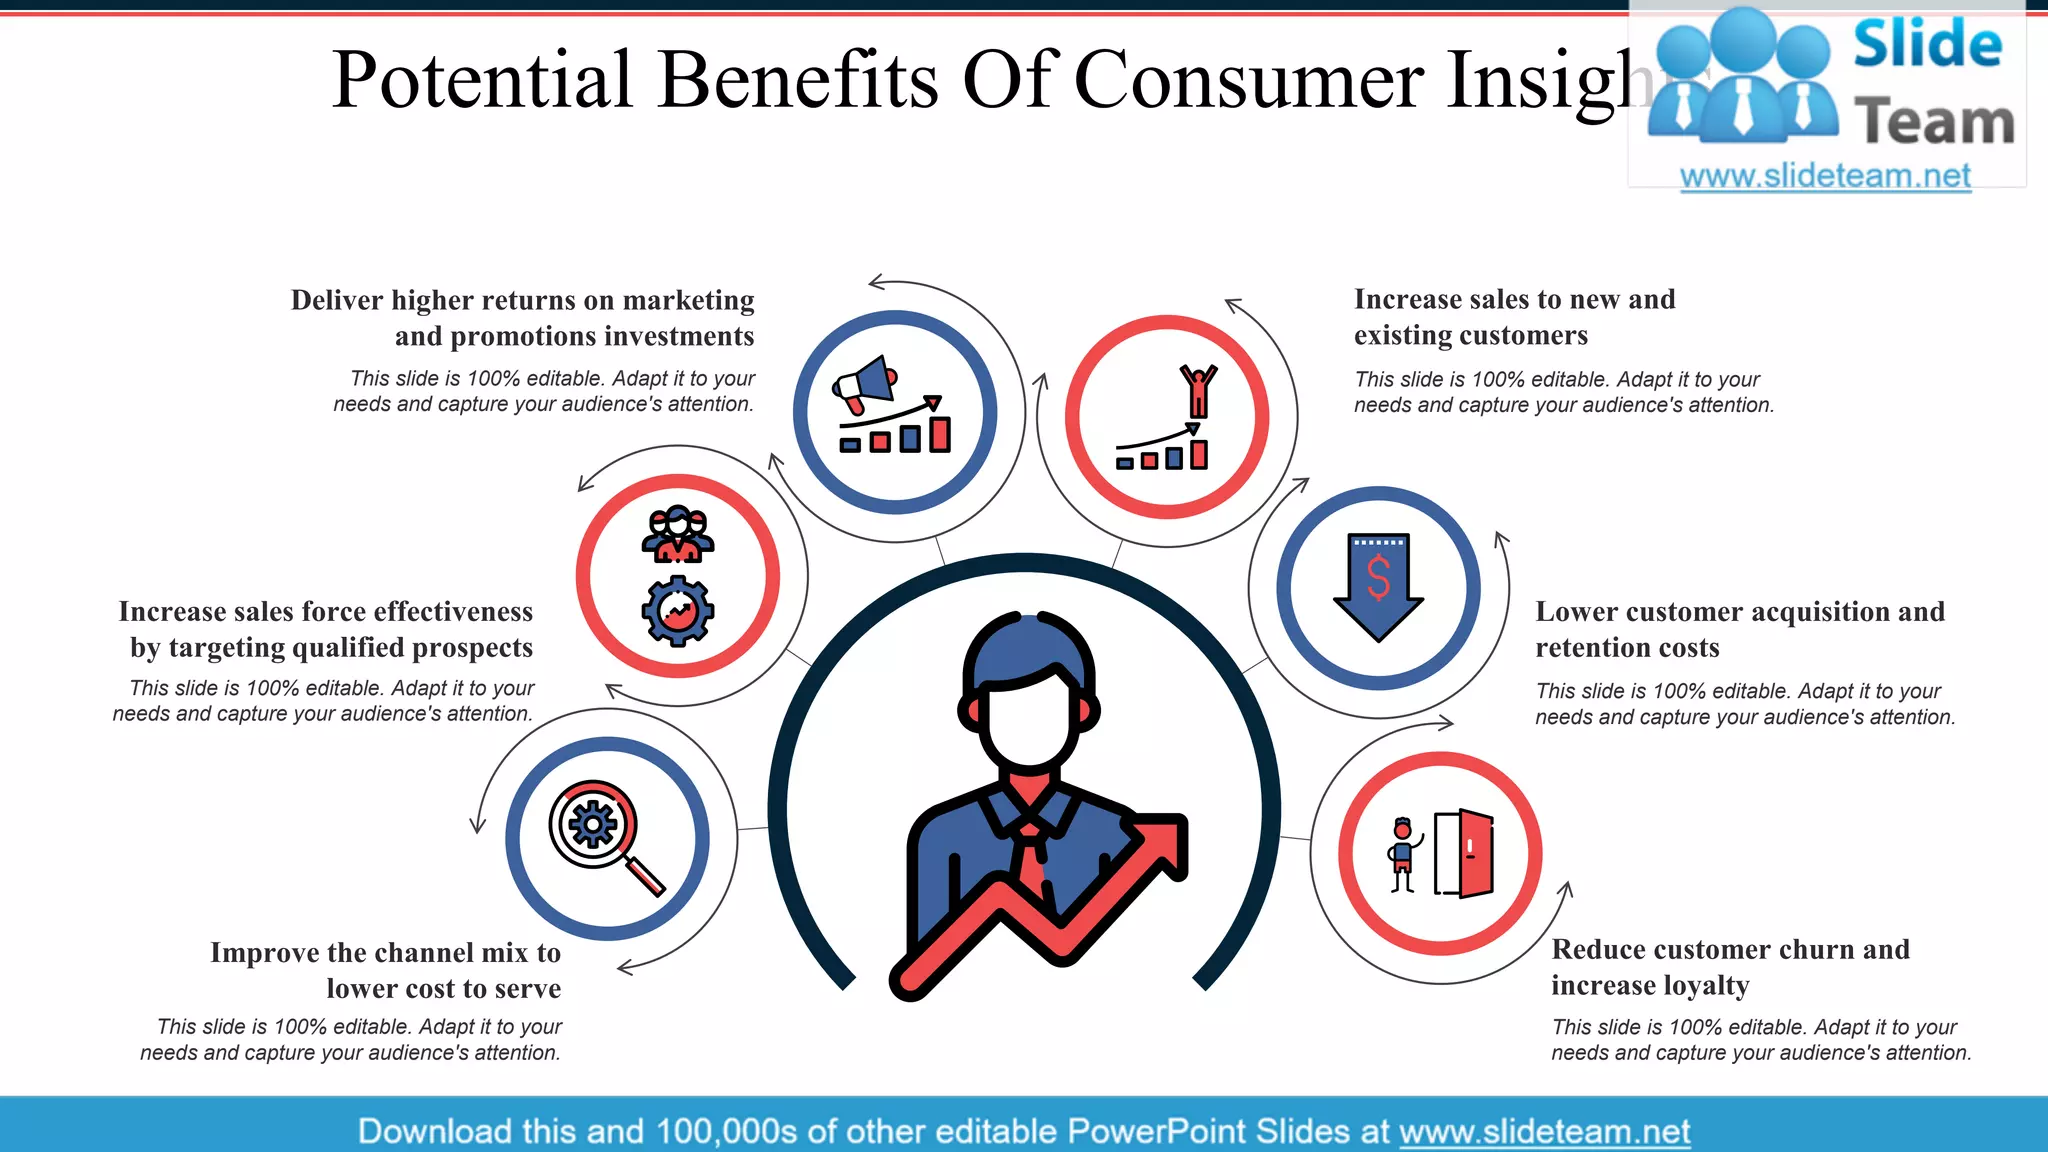
Outlining the advantages of consumer insights including customer satisfaction and efficiency in marketing strategies.
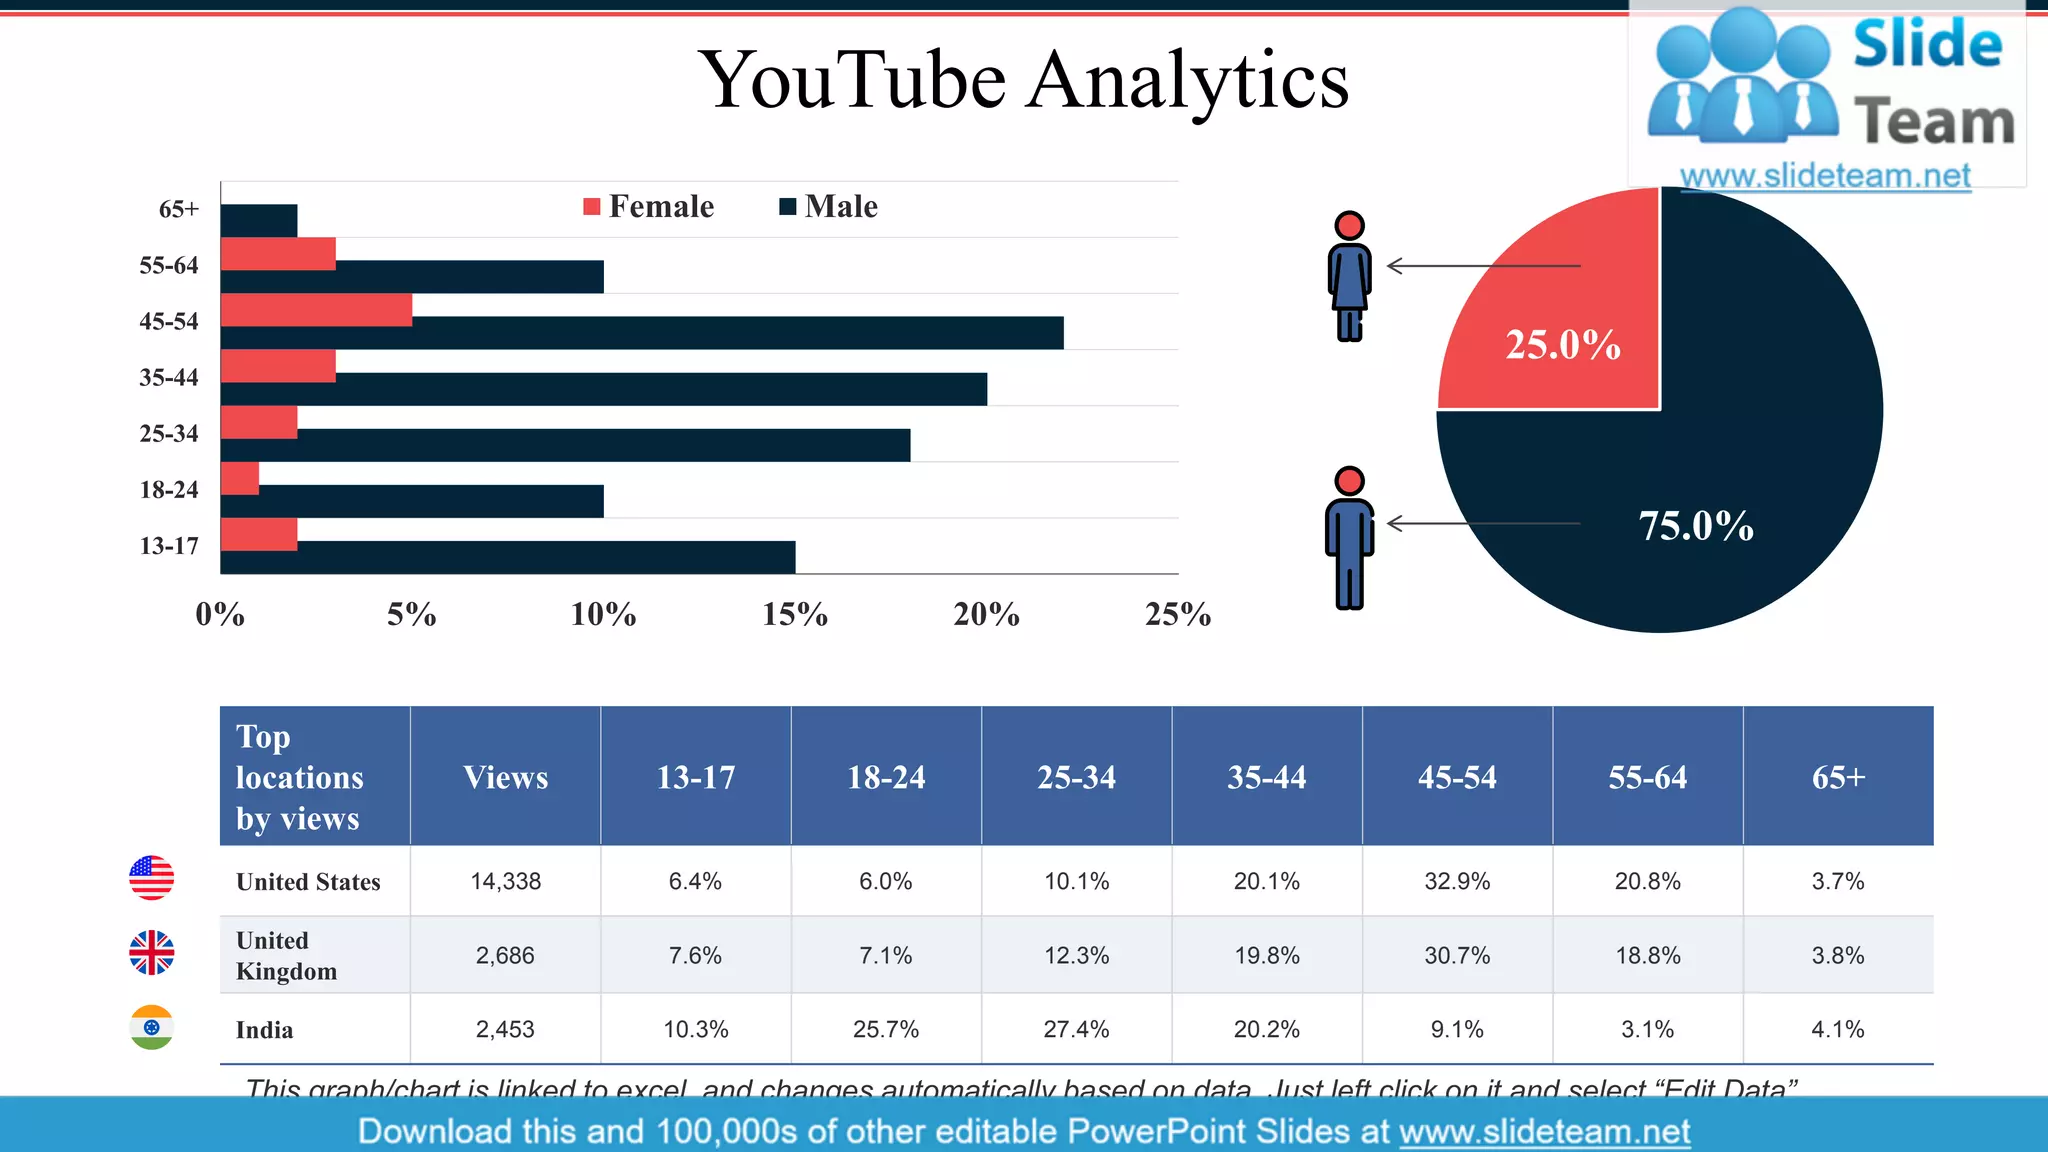
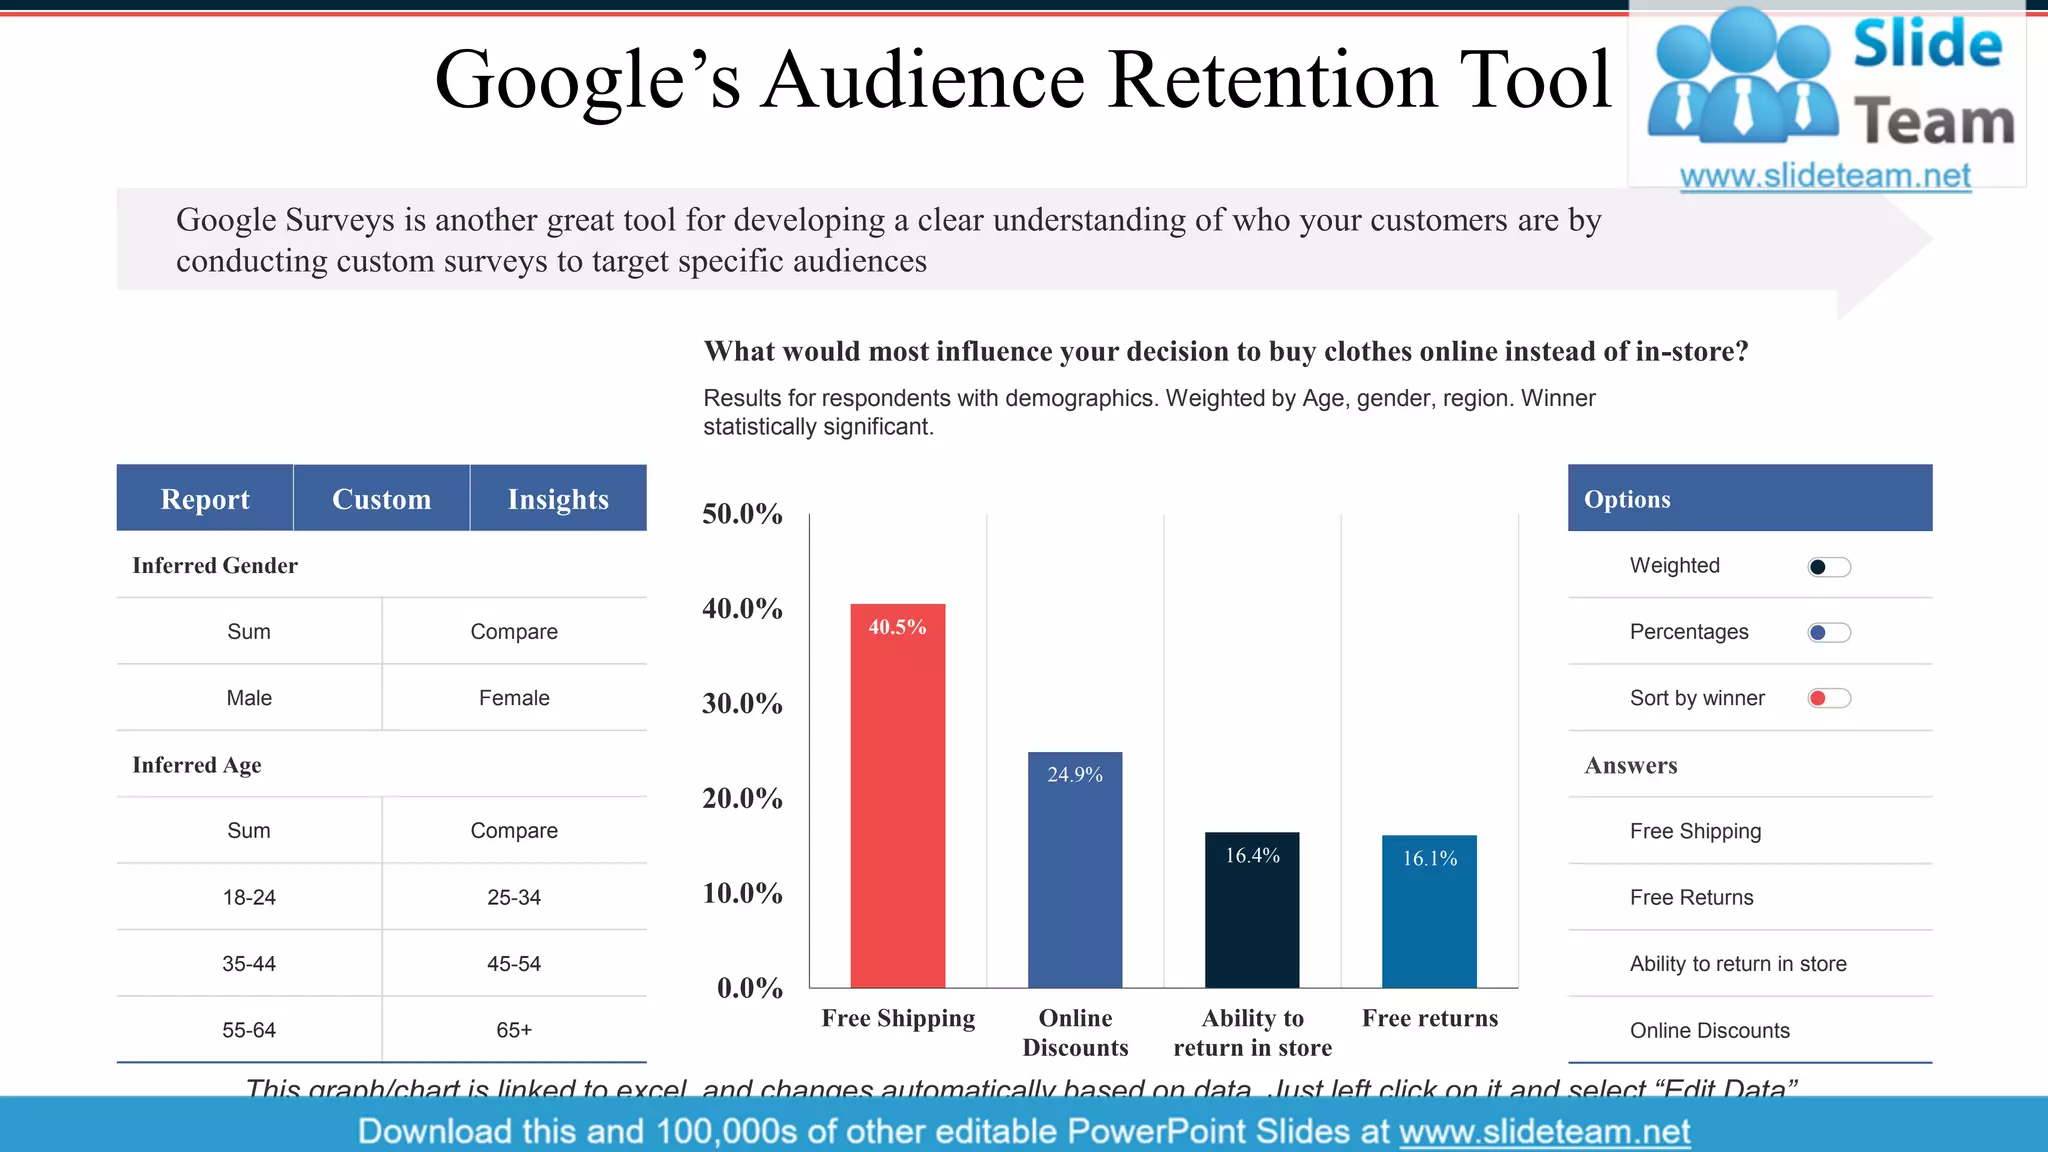
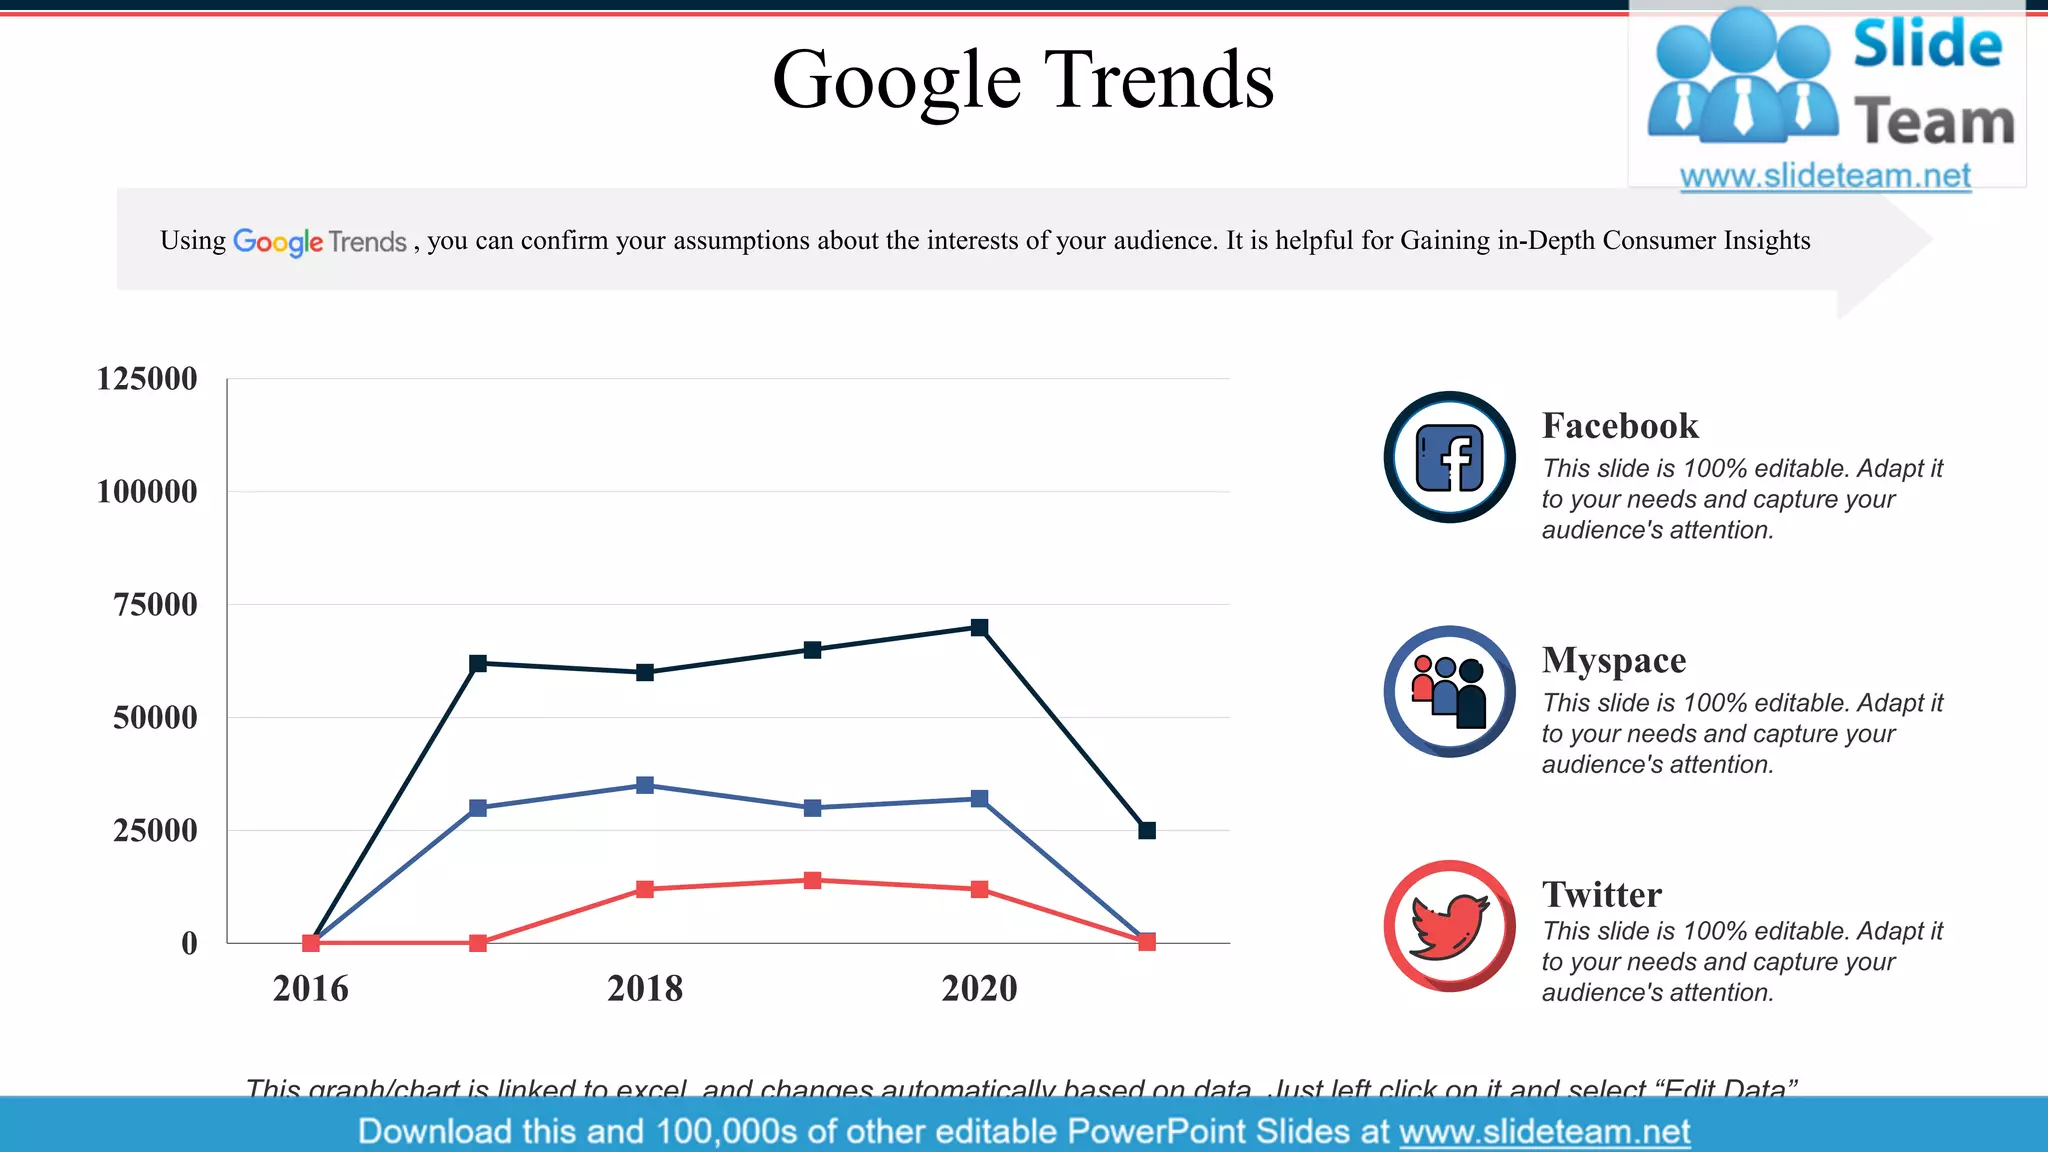
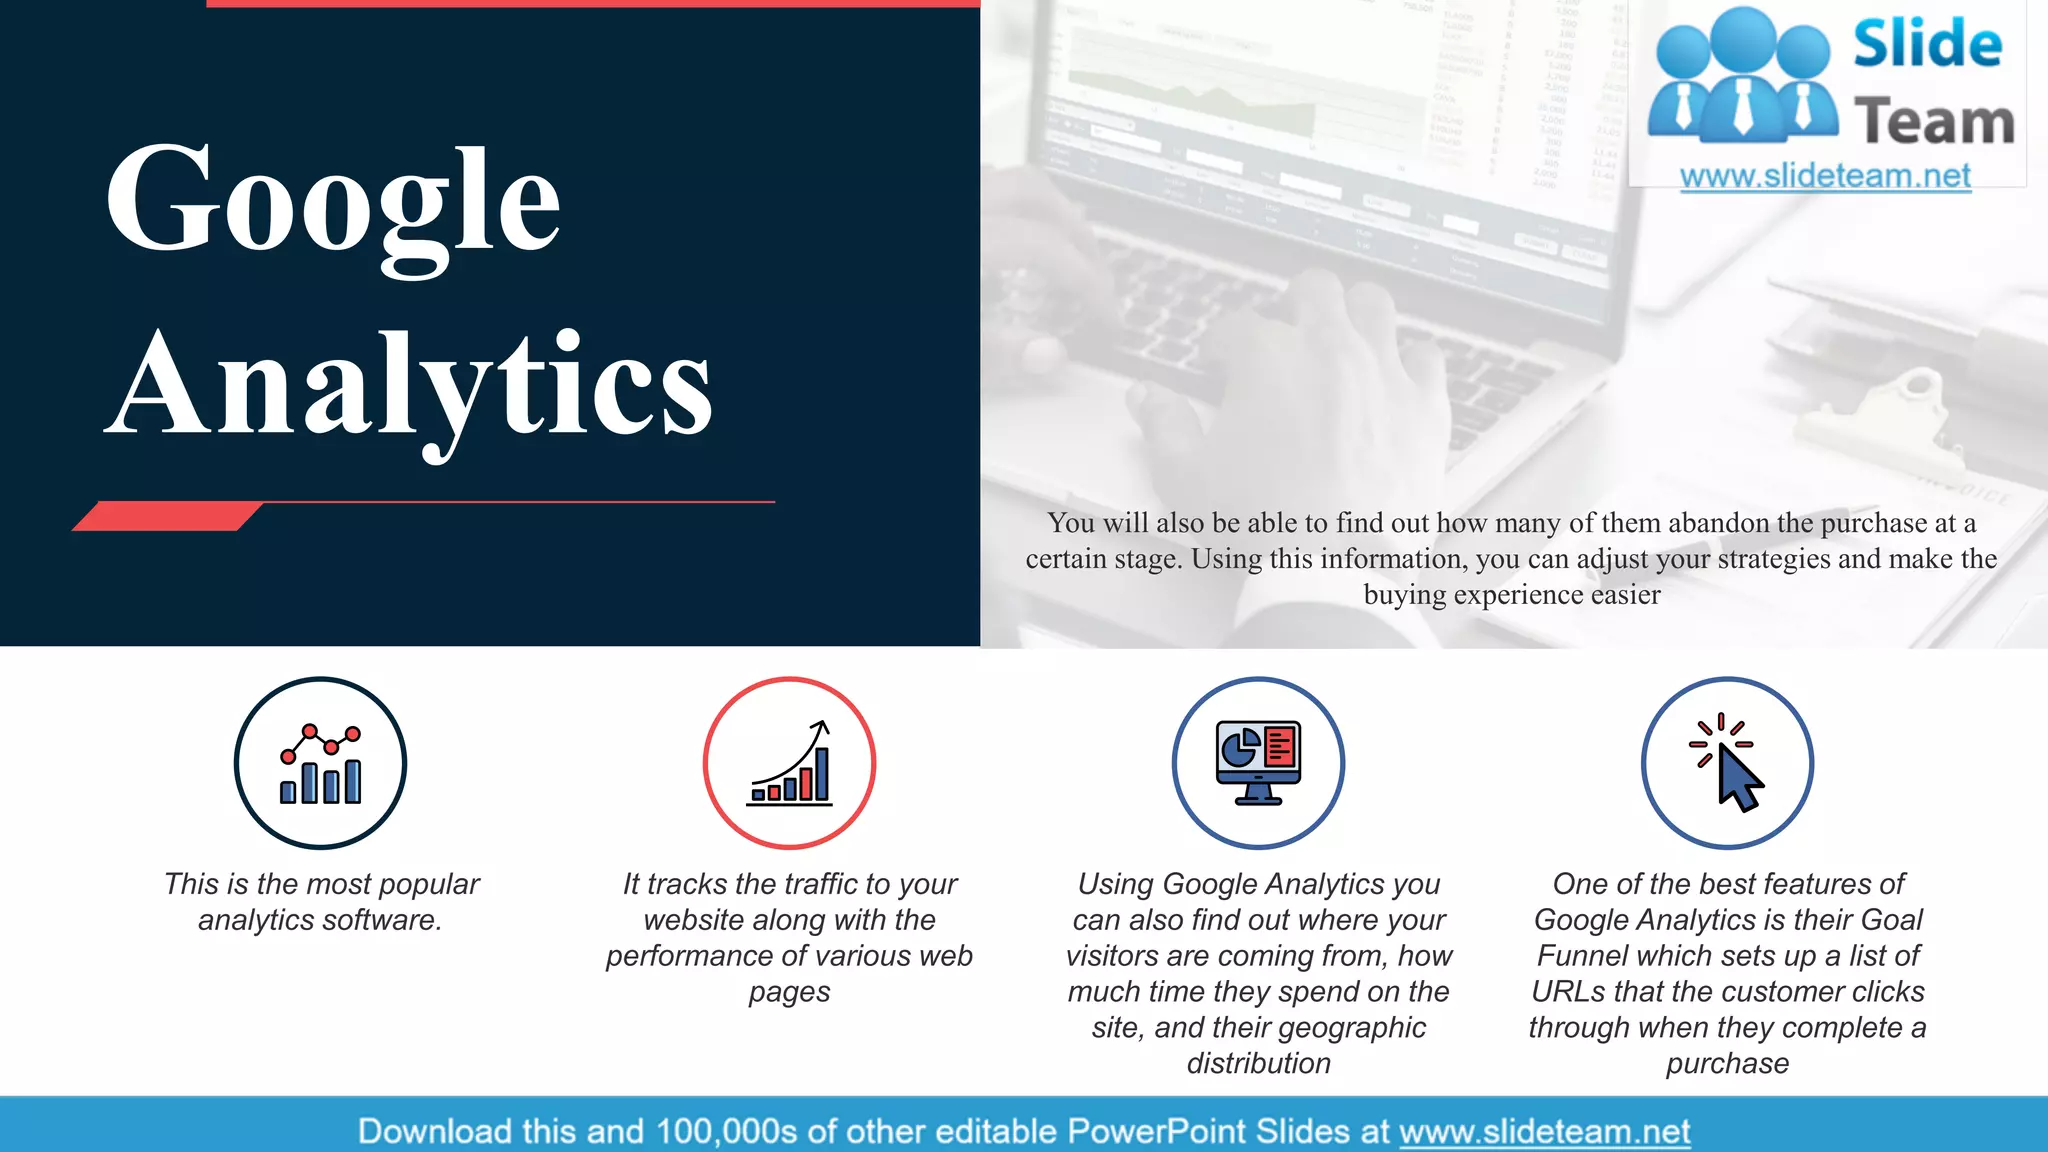
Various tools for gathering consumer insights including Google Analytics and YouTube Analytics.
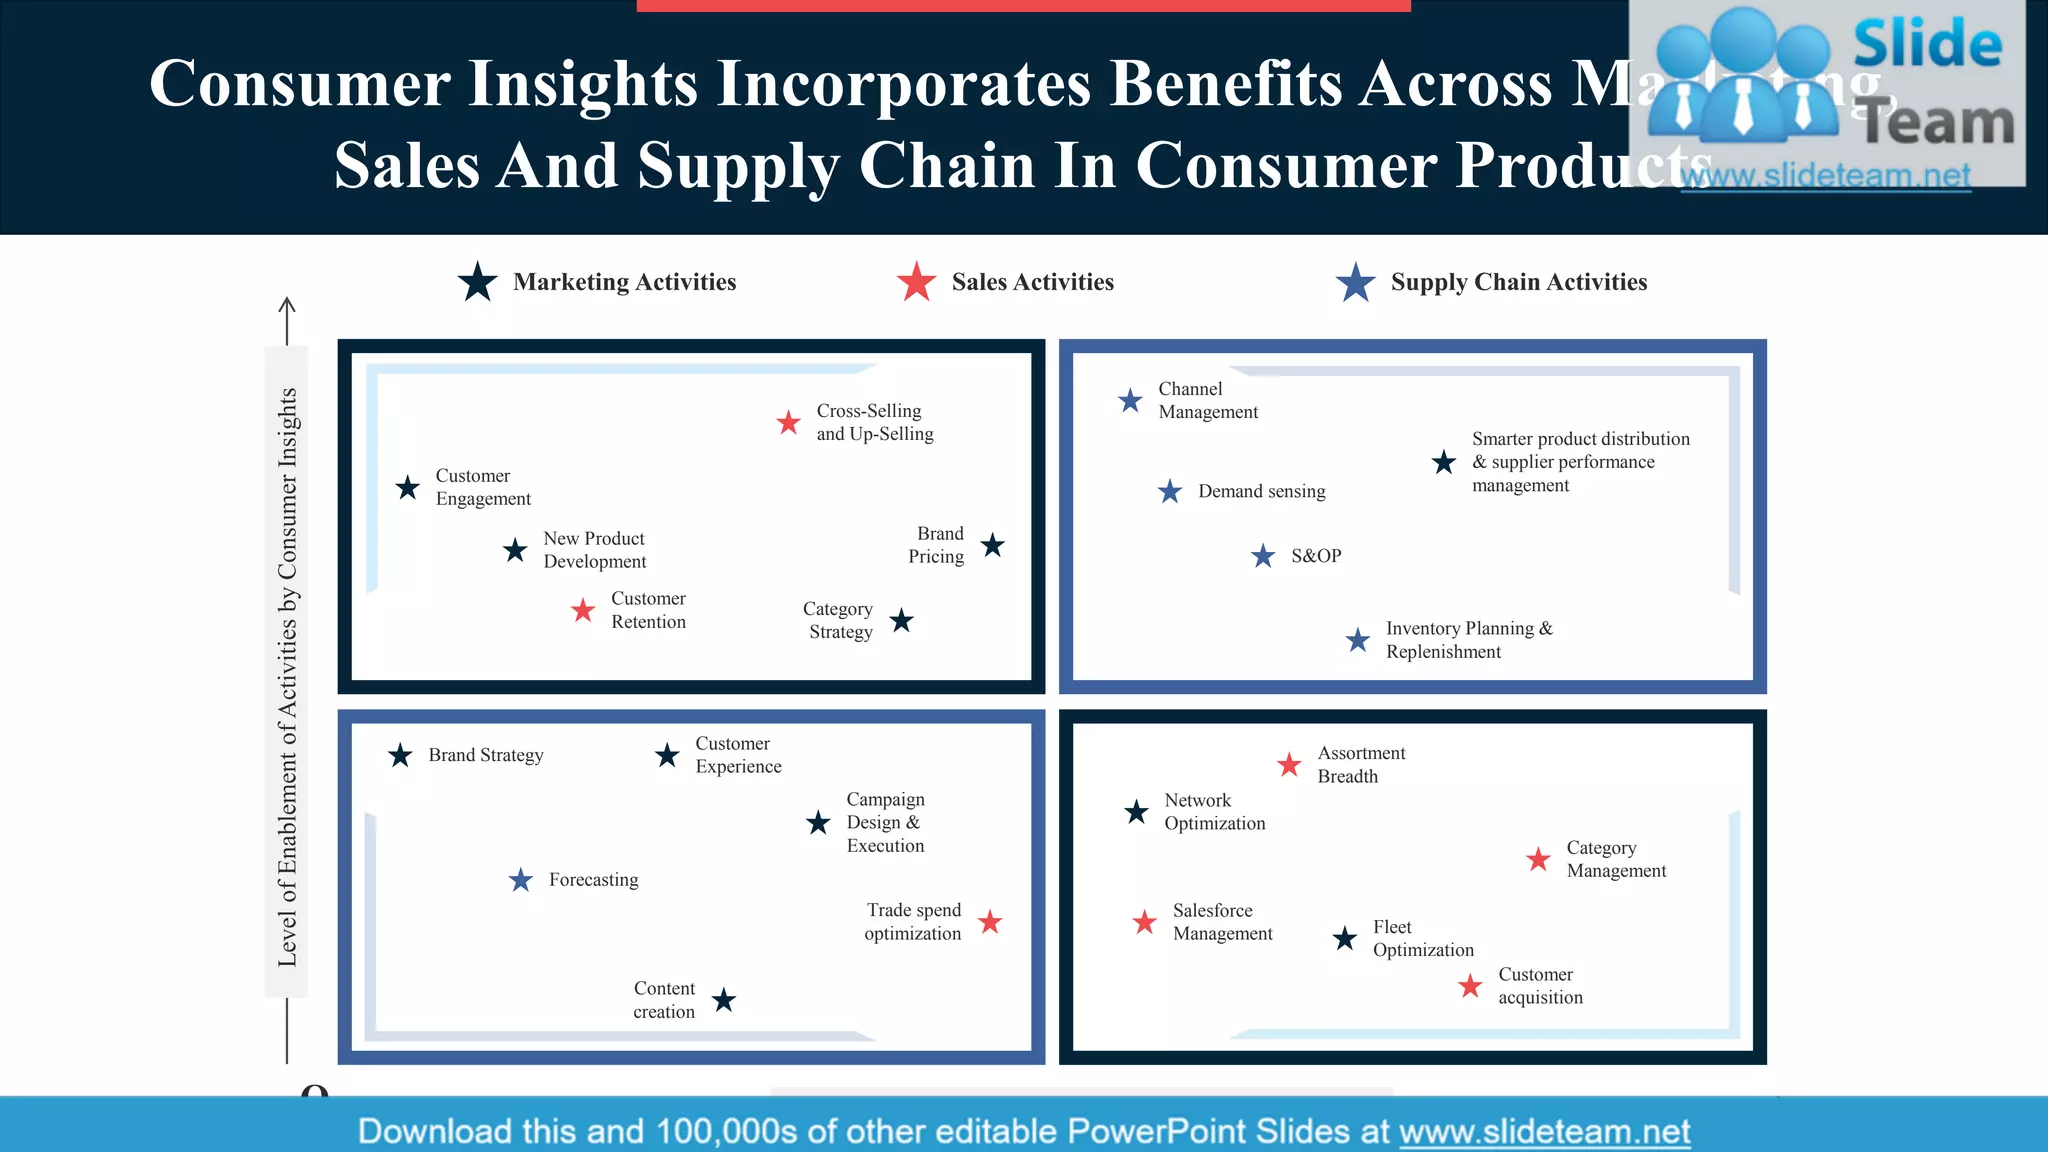
The benefits and applications of consumer insights in marketing, sales, and supply chain management.How consumer insights integrate with various business functions to enhance marketing, sales, and supply chain.
Slides related to breaks, additional graphs or miscellaneous content not directly related to consumer insights.
Presentation of the mission, financial comparisons, and targeted objectives within the insights framework.
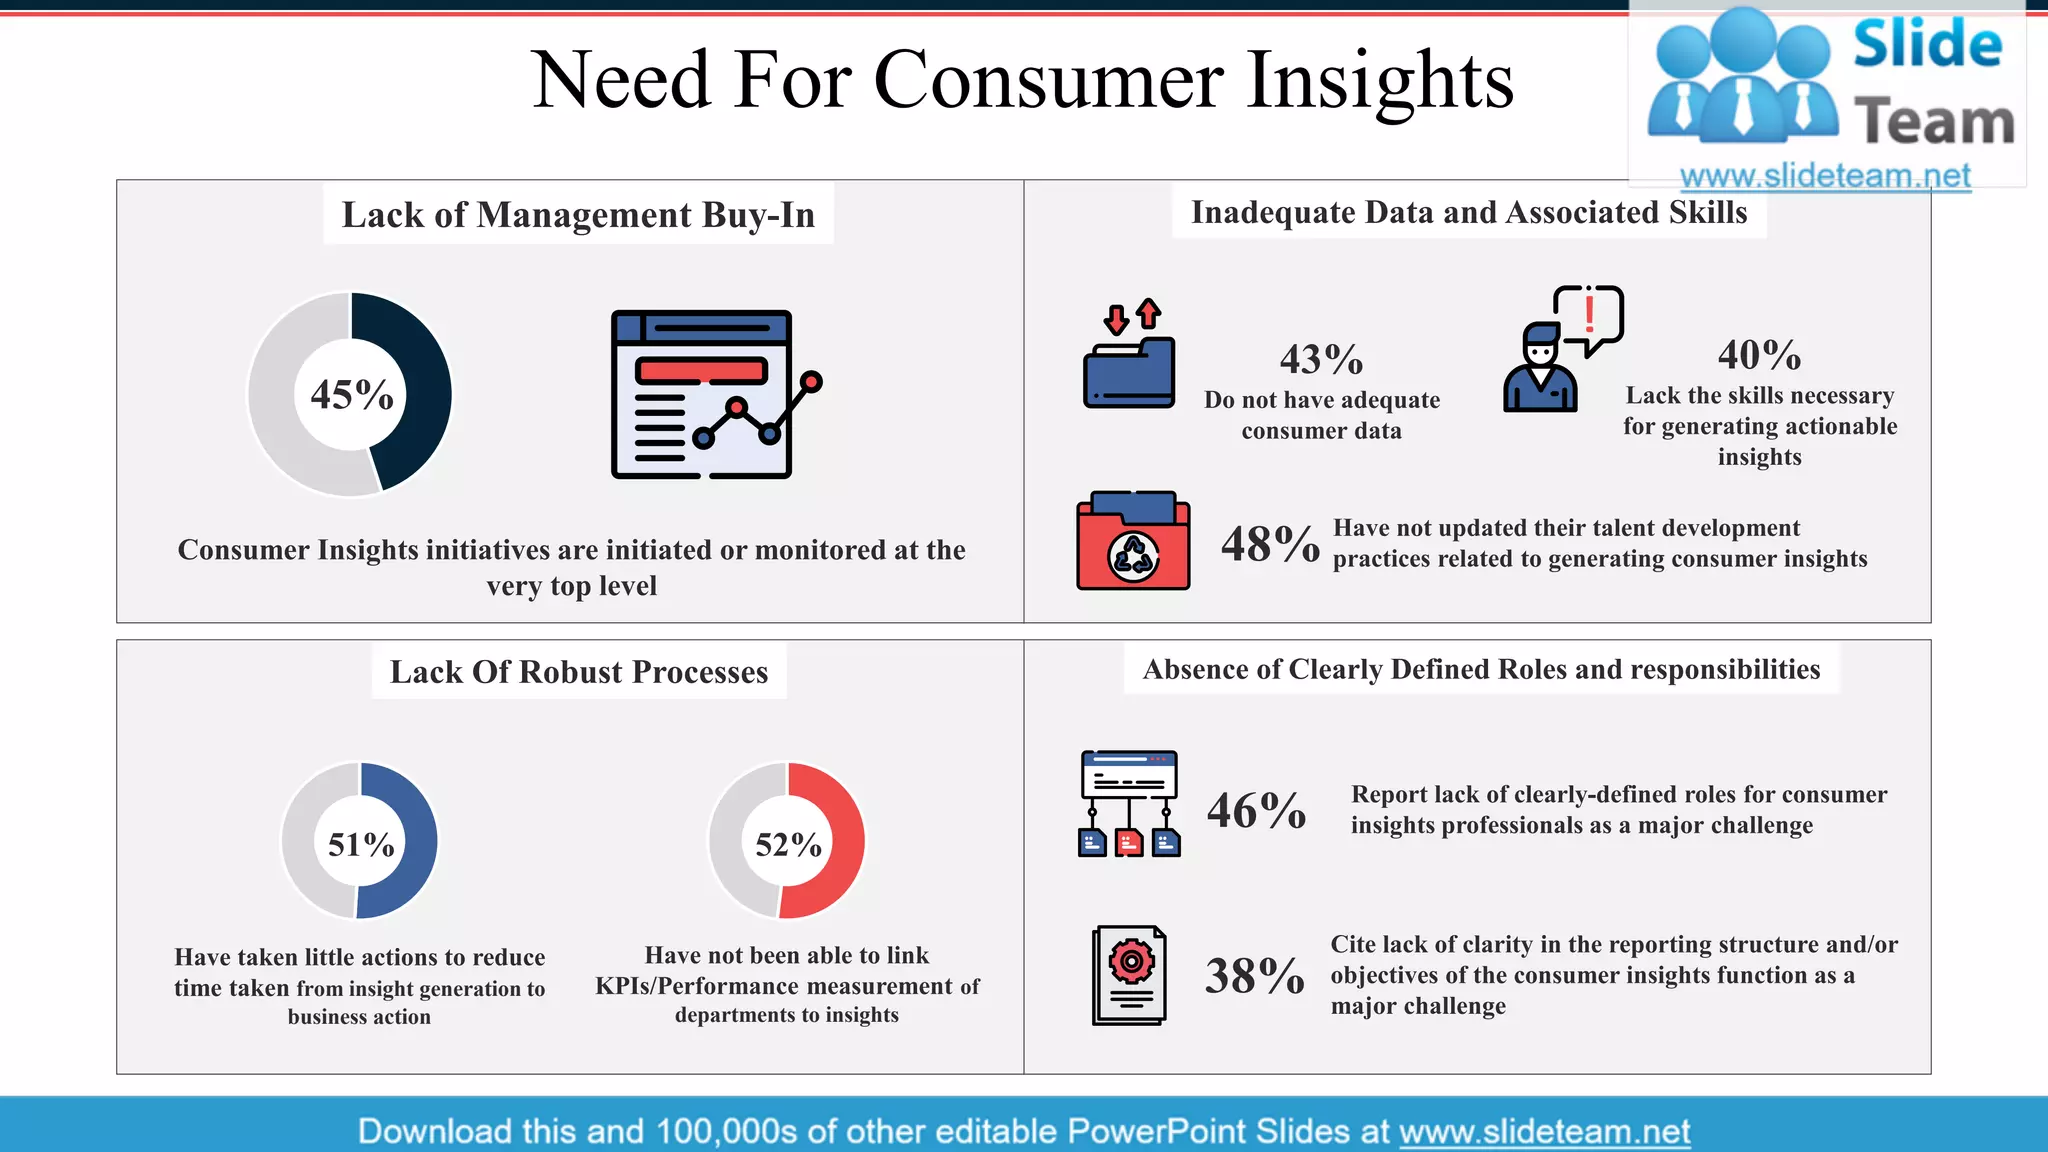
A look at upcoming trends in consumer insights and the associated challenges that businesses may face.
Final thoughts on the presentation and essential contact information for follow-up.