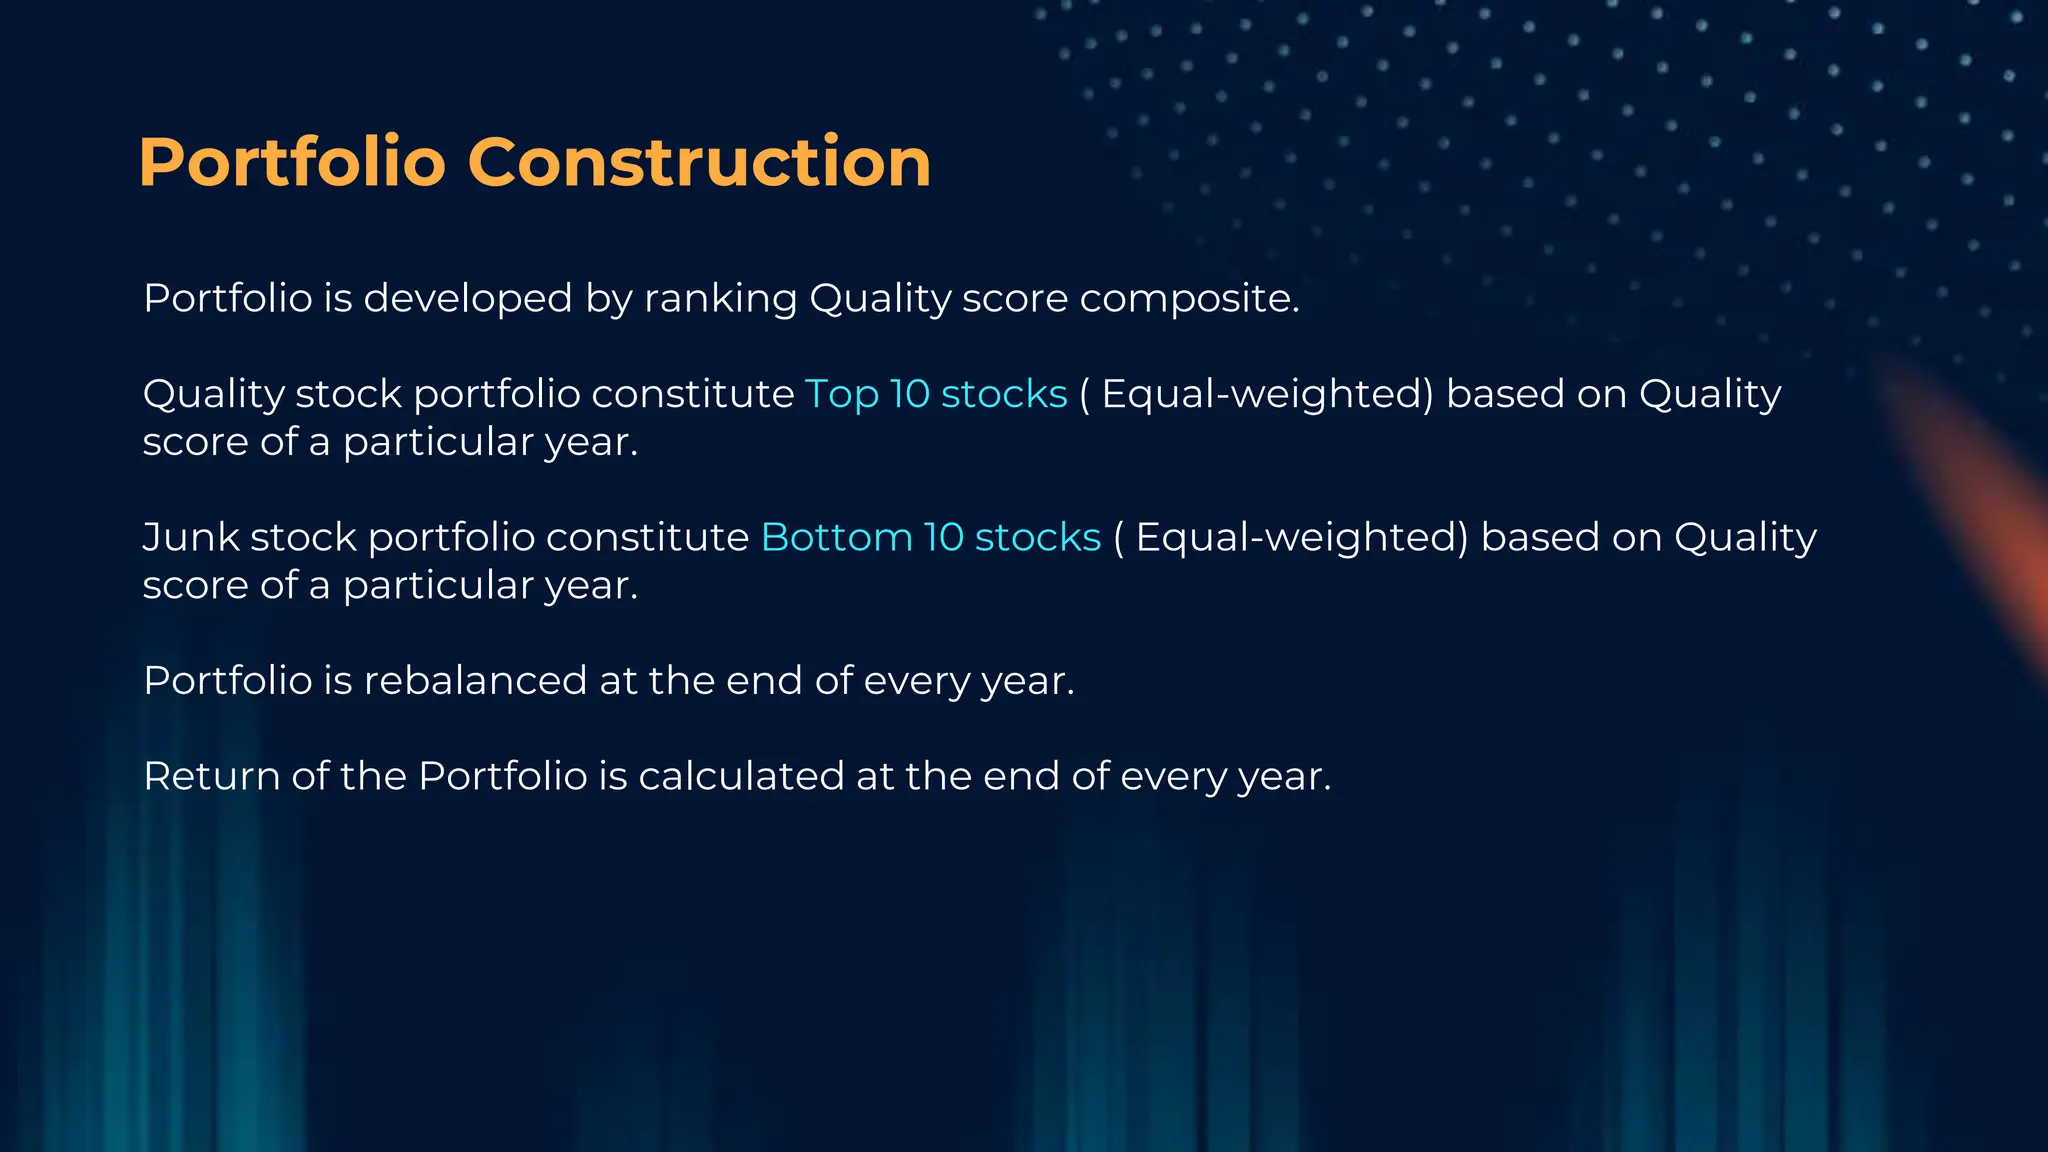
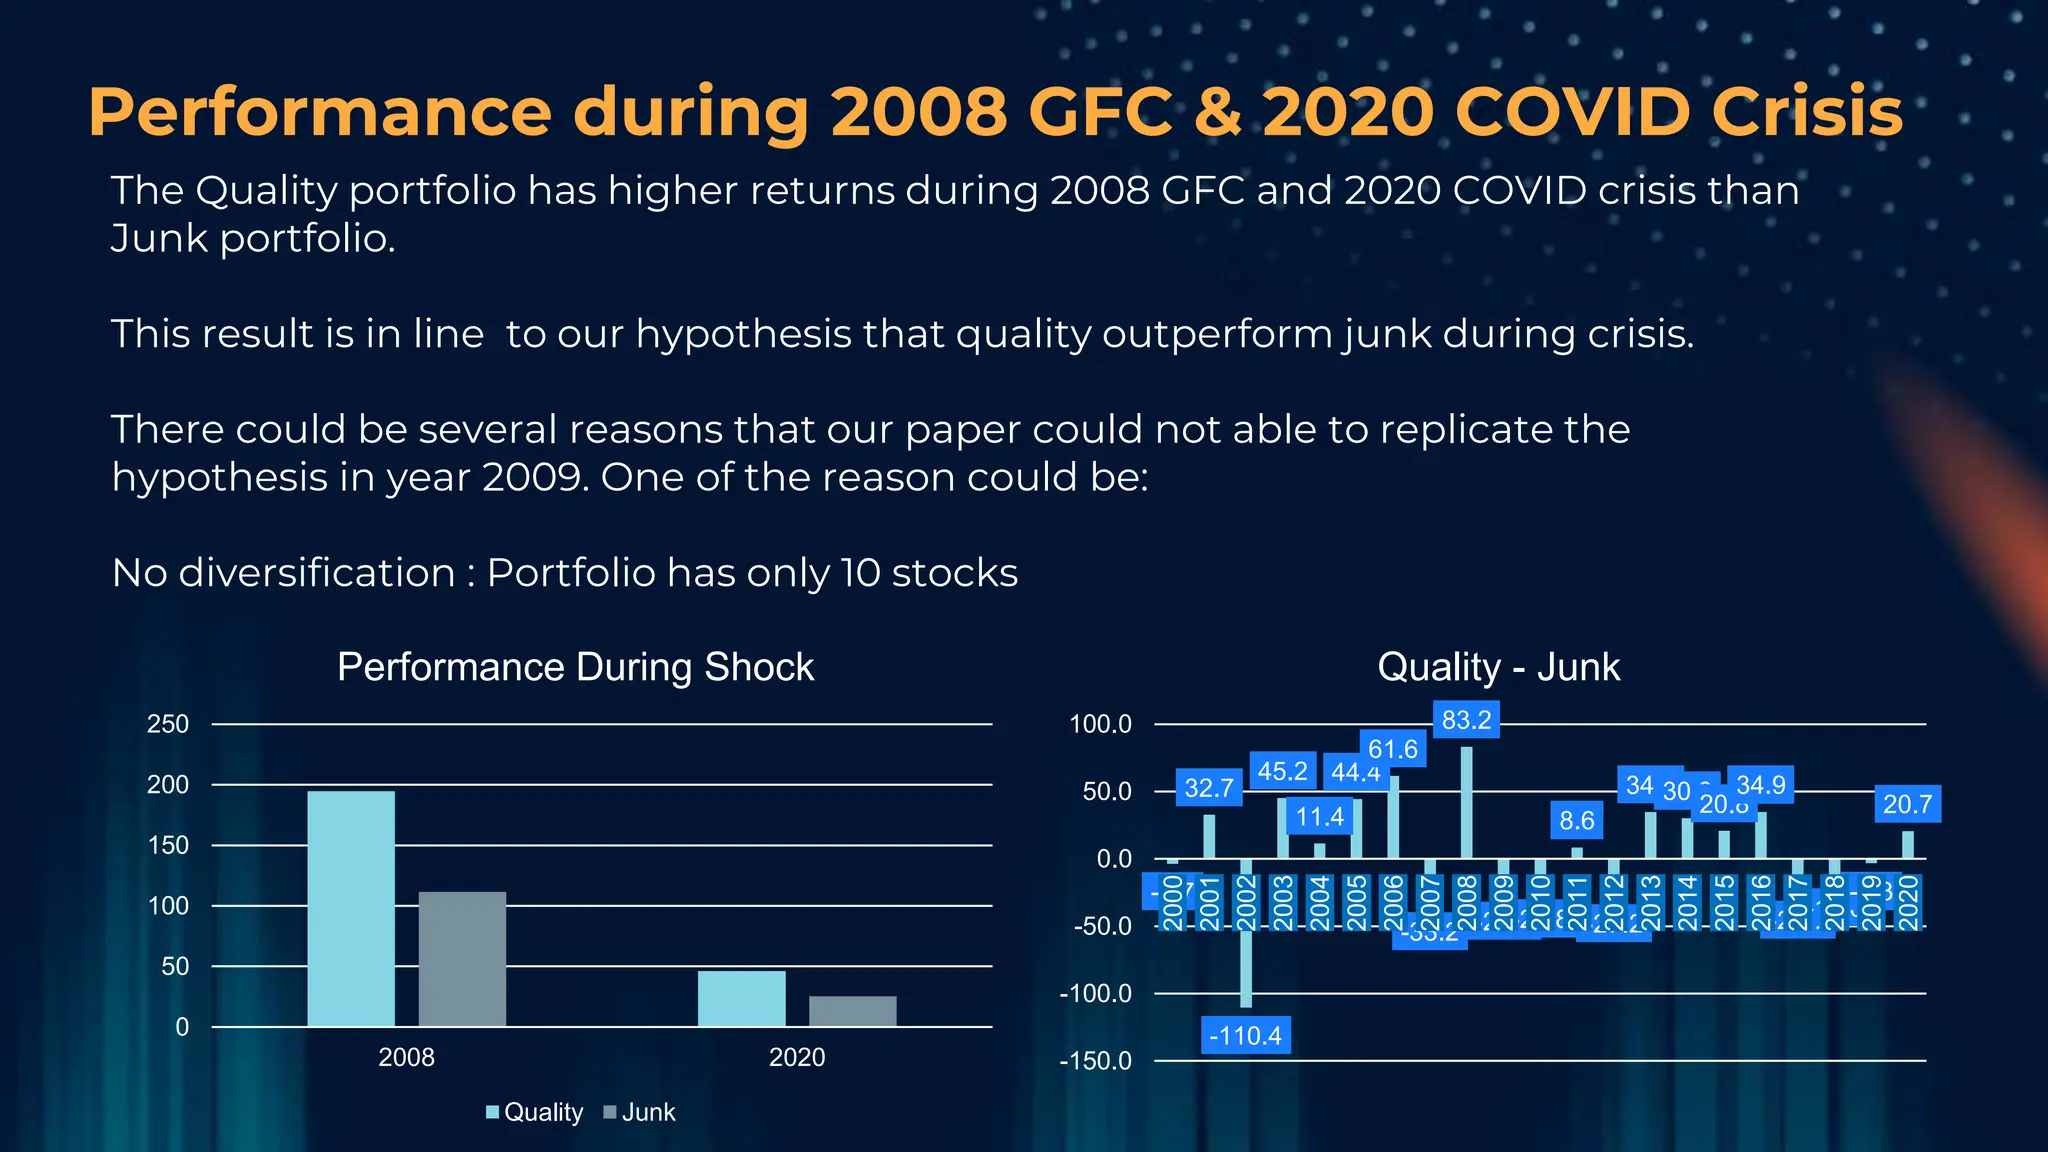
Behavioral
Finance
Submitted By: Group 10
0011/58 Ashish Panwar
0044/58 Lakhshya Khurana
0054/58 Anirudh Agarwal
0128/58 Arun Yadav
0166/58 Simran Diwedi
0167/58 Adarsh Gupta
0179/58 Shubham Kalani
0216/58 Pulkit Pandey
Quality Minus Junk
INDEX
03
04
05
Hypothesis
01
Variables
Portfolio Analysis
Portfolio Construction
Data
02
06 Performance During Crisis
Hypothesis & Theory
01
Quality stocks are defined as stocks that have high profitability, high
growth, low risk, and high payouts.
02
03
04
Logically, the prices of such stocks should demand a premium over other
stocks and thus should yield lower returns on a long-term basis.
But authors find that the price premium being paid by investors for
quality stocks is not sufficient, which results in higher risk-adjusted
returns on quality stock and negative risk-adjusted returns on junk stocks.
Prices and returns are naturally connected, and authors have shown that
the price of quality negatively predicts the future return on QMJ.
Hypothesis & Theory
05
Authors theorize that market prices may be based on superior quality
characteristics( some omitted variable/s), explaining limited power of
quality of prices.
06
07
08
The quality characteristics may be correlated with risk factors not
captured in the risk adjustments, explaining lack of captured risk in a
quality security leading to lower returns.
Market prices may fail to fully reflect the characteristics linked to
behavioral finance or some other constraints
QMJ strategy is different from HML(High-minus-low), in fact both are
negatively correlated. QMJ is based on quality characteristics irrespective
of prices, while HML is based on stock prices.
Data
Dataset is collected from CMIE Prowess IQ database.
Following parameters for all BSE 500 stocks are compiled:
Closing price of the stock
Beta & Market Cap
Revenue, EBIT, PAT, OCF, Total Assets, Equity
Incorporated year
Dividend
Data is then cleaned for any missing data.
Variables
Now, it is essential to generate a quality score based on 3 quality measures:
• Profitability: Using sustainable part of profits in relation to the book values;
including measures such as return on equity, return on assets, and cash flows over
assets.
• Growth: Parallelly, we see the growth in the sustainable profits metrics in relation
to the book values; which include ROE, ROA, cash flow over assets 3-year growth
rates.
• Safety, which includes stocks with low market beta, volatility, and leverage.
For every factor, we normalize the score for all companies and create a normalized
factor score, which are all added to create a final quality score.
* A 4th factor, Payout might also be added, including net equity issuance, net debt
issuance, and total net payout over profits.
Quality = z ( Profitability + Growth + Safety)
Portfolio Construction
Portfolio is developed by ranking Quality score composite.
Quality stock portfolio constitute Top 10 stocks ( Equal-weighted) based on Quality
score of a particular year.
Junk stock portfolio constitute Bottom 10 stocks ( Equal-weighted) based on Quality
score of a particular year.
Portfolio is rebalanced at the end of every year.
Return of the Portfolio is calculated at the end of every year.
Portfolio Analysis
CAGR=18.2% CAGR=17.1%
0
500
1000
1500
2000
2500
3000
3500
4000
Quality Portfolio Value
0
500
1000
1500
2000
2500
3000
2000
2001
2002
2003
2004
2005
2006
2007
2008
2009
2010
2011
2012
2013
2014
2015
2016
2017
2018
2019
2020
Junk Portfolio Value
Performance during 2008 GFC & 2020 COVID Crisis
The Quality portfolio has higher returns during 2008 GFC and 2020 COVID crisis than
Junk portfolio.
This result is in line to our hypothesis that quality outperform junk during crisis.
There could be several reasons that our paper could not able to replicate the
hypothesis in year 2009. One of the reason could be:
No diversification : Portfolio has only 10 stocks
0
50
100
150
200
250
2008 2020
Performance During Shock
Quality Junk
-3.7
32.7
-110.4
45.2
11.4
44.4
61.6
-33.2
83.2
-25.6
-23.8
8.6
-27.2
34.8
30.3
20.8
34.9
-24.7
-15.6
-3.3
20.7
-150.0
-100.0
-50.0
0.0
50.0
100.0
2000
2001
2002
2003
2004
2005
2006
2007
2008
2009
2010
2011
2012
2013
2014
2015
2016
2017
2018
2019
2020
Quality - Junk
THANK YOU!
Appendix 1-2008
2008-Quality 2008-Junk
Appendix 2-2020
2020-Quality 2020-Junk

Behav_Fin_PPT_QualityMinusJunk Factor (1).pptx

  • 1.
    Behavioral Finance Submitted By: Group10 0011/58 Ashish Panwar 0044/58 Lakhshya Khurana 0054/58 Anirudh Agarwal 0128/58 Arun Yadav 0166/58 Simran Diwedi 0167/58 Adarsh Gupta 0179/58 Shubham Kalani 0216/58 Pulkit Pandey Quality Minus Junk
  • 2.
  • 3.
    Hypothesis & Theory 01 Qualitystocks are defined as stocks that have high profitability, high growth, low risk, and high payouts. 02 03 04 Logically, the prices of such stocks should demand a premium over other stocks and thus should yield lower returns on a long-term basis. But authors find that the price premium being paid by investors for quality stocks is not sufficient, which results in higher risk-adjusted returns on quality stock and negative risk-adjusted returns on junk stocks. Prices and returns are naturally connected, and authors have shown that the price of quality negatively predicts the future return on QMJ.
  • 4.
    Hypothesis & Theory 05 Authorstheorize that market prices may be based on superior quality characteristics( some omitted variable/s), explaining limited power of quality of prices. 06 07 08 The quality characteristics may be correlated with risk factors not captured in the risk adjustments, explaining lack of captured risk in a quality security leading to lower returns. Market prices may fail to fully reflect the characteristics linked to behavioral finance or some other constraints QMJ strategy is different from HML(High-minus-low), in fact both are negatively correlated. QMJ is based on quality characteristics irrespective of prices, while HML is based on stock prices.
  • 5.
    Data Dataset is collectedfrom CMIE Prowess IQ database. Following parameters for all BSE 500 stocks are compiled: Closing price of the stock Beta & Market Cap Revenue, EBIT, PAT, OCF, Total Assets, Equity Incorporated year Dividend Data is then cleaned for any missing data.
  • 6.
    Variables Now, it isessential to generate a quality score based on 3 quality measures: • Profitability: Using sustainable part of profits in relation to the book values; including measures such as return on equity, return on assets, and cash flows over assets. • Growth: Parallelly, we see the growth in the sustainable profits metrics in relation to the book values; which include ROE, ROA, cash flow over assets 3-year growth rates. • Safety, which includes stocks with low market beta, volatility, and leverage. For every factor, we normalize the score for all companies and create a normalized factor score, which are all added to create a final quality score. * A 4th factor, Payout might also be added, including net equity issuance, net debt issuance, and total net payout over profits. Quality = z ( Profitability + Growth + Safety)
  • 7.
    Portfolio Construction Portfolio isdeveloped by ranking Quality score composite. Quality stock portfolio constitute Top 10 stocks ( Equal-weighted) based on Quality score of a particular year. Junk stock portfolio constitute Bottom 10 stocks ( Equal-weighted) based on Quality score of a particular year. Portfolio is rebalanced at the end of every year. Return of the Portfolio is calculated at the end of every year.
  • 8.
    Portfolio Analysis CAGR=18.2% CAGR=17.1% 0 500 1000 1500 2000 2500 3000 3500 4000 QualityPortfolio Value 0 500 1000 1500 2000 2500 3000 2000 2001 2002 2003 2004 2005 2006 2007 2008 2009 2010 2011 2012 2013 2014 2015 2016 2017 2018 2019 2020 Junk Portfolio Value
  • 9.
    Performance during 2008GFC & 2020 COVID Crisis The Quality portfolio has higher returns during 2008 GFC and 2020 COVID crisis than Junk portfolio. This result is in line to our hypothesis that quality outperform junk during crisis. There could be several reasons that our paper could not able to replicate the hypothesis in year 2009. One of the reason could be: No diversification : Portfolio has only 10 stocks 0 50 100 150 200 250 2008 2020 Performance During Shock Quality Junk -3.7 32.7 -110.4 45.2 11.4 44.4 61.6 -33.2 83.2 -25.6 -23.8 8.6 -27.2 34.8 30.3 20.8 34.9 -24.7 -15.6 -3.3 20.7 -150.0 -100.0 -50.0 0.0 50.0 100.0 2000 2001 2002 2003 2004 2005 2006 2007 2008 2009 2010 2011 2012 2013 2014 2015 2016 2017 2018 2019 2020 Quality - Junk
  • 10.
  • 11.
  • 12.