BUSINESS ECONOMICS ANDFINANCIAL ANALYSIS(21CS701HSM)
UNIT-3
TOPIC-4
Break Even Analysis
Break-Even-Analysis is a technique used by the management in profit
planning.
It shows the relationship between cost, volume and profit at different
levels of sales. So it is also called as CVP analysis.
It helps to find out Break-Even Point, where the firm makes no profit no
loss. This is called break even point.
Here Total Revenue = Total Cost (TR = TC).
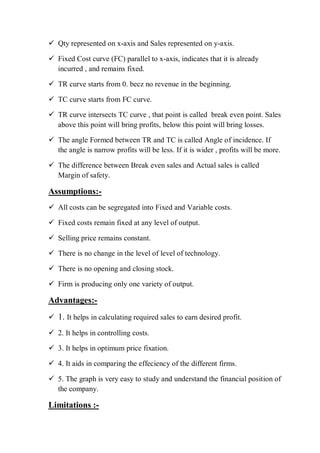
Production above this point results in profits , below this point results in
losses. It is shown in the diagram.
2.
Qty representedon x-axis and Sales represented on y-axis.
Fixed Cost curve (FC) parallel to x-axis, indicates that it is already
incurred , and remains fixed.
TR curve starts from 0. becz no revenue in the beginning.
TC curve starts from FC curve.
TR curve intersects TC curve , that point is called break even point. Sales
above this point will bring profits, below this point will bring losses.
The angle Formed between TR and TC is called Angle of incidence. If
the angle is narrow profits will be less. If it is wider , profits will be more.
The difference between Break even sales and Actual sales is called
Margin of safety.
Assumptions:-
All costs can be segregated into Fixed and Variable costs.
Fixed costs remain fixed at any level of output.
Selling price remains constant.
There is no change in the level of level of technology.
There is no opening and closing stock.
Firm is producing only one variety of output.
Advantages:-
1. It helps in calculating required sales to earn desired profit.
2. It helps in controlling costs.
3. It helps in optimum price fixation.
4. It aids in comparing the effeciency of the different firms.
5. The graph is very easy to study and understand the financial position of
the company.
Limitations :-
3.
1.This theory considersonly FC and VC, ignores Semi variable expenses.
2. A single chart can not be of any use for firms producing multiple products.
3. This theory assumes that no change in the technology . But firms will be
constantly upgrading their technology.
4. It is not addressing the changes in government policies, and general price
levels in the economy.
Formulas:-
1. BEP in units :- BEP = FC / Contribution margin per unit
Contribution margin per unit = Selling price per unit – Variable cot per unit.
2. BEP in value:- BEP = FC / Contribution margin ratio.
Contribution margin ratio = SP –VC / SP ( It is also called P/V ratio)
3. Margin of Safety:- No. of units sold – Break even sales.
4.
BUSINESS ECONOMICS ANDFINANCIAL ANALYSIS(21CS701HSM)
UNIT-3
TOPIC-5
Pricing
Introduction to pricing:-
Pricing means expressing the value of the product in monetary terms.
It is very important function of management bcz it is the yard stick to
measure the financial performance of the company.
Under pricing results in losses and over pricing results in losing the
customer base.
So utmost care should be taken while pricing products bcz it affects the
entire business.
Different companies follow different pricing methods. They are given
below.
Pricing Methods:-
1. Cost plus pricing :- In this method total cost of the product is found out
and a certain % of profit will be added to arrive at the selling price. It
easy to calculate and simple to follow.
2. Marginal cost pricing:- In this method price is fixed in a such way that , It
covers variable costs fully and contributes towards recovery of fixed costs
fully or partly.
3. Pricing above the competitive level:- In this method price will be fixed
over and above the competitors price. This method can be followed by
well established companies who can withstand losses in the initial stages.
4. Pricing below the competitive level:- Sometimes price will be fixed below
the competitors price. But the main problem with this method is , customers
suspect the quality of the product and may lose customer base.
5.
5. Follow theleader method:- Here price will be fixed in tune with the price
fixed by the market leader.. It is usually followed by Newly established
companies.
6.Sealed bid pricing:- This method is more popular in tenders and contracts.
Each firm will quote its price in a sealed cover and the person who quotes
least will be given the contract.
7. Price discrimination:- It refers charging different prices to different
customers for same good or same price to different commodities depending
upon the market situation.
8. Perceived value pricing:- Fixing the prices on the basis of perception of
the buyer regarding the value of the product.
9. Skimming Pricing:- It refers to fixing very high price to skim the cream of
the market and then the price will settle down at low level. It will be
followed to recover the original investment in the beginning itself.
10.Penetration pricing:- This is exactly opposite of skimming pricing . Here
the price will be fixed at a low level in the beginning to penetrate into the
market , and once the product is established , the seller will rise the price. (
Skimming pricing , Penetration pricing are called New product pricing
methods.)
11. Block pricing:-It refers to selling certain number of products as one pack.
(Ex. 6 Lux soaps as a single pack).
12.Commodity bundling:- Here different varieties of products are bundled
together as a single product.(School bags, shoes, uniforms, lunch bags etc. as
a single kit.)
13.Peak-load pricing:- Charging high price during peak season and low price
during off-season is called peak-load pricing ( selling rain coats at a high
price in the rainy season is an example here.)
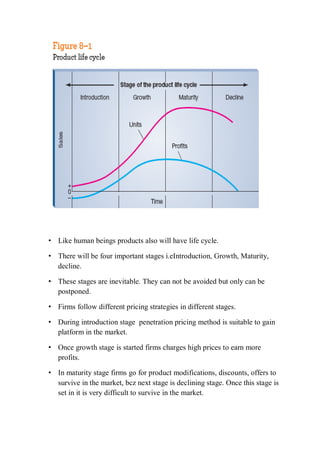
Product life cycle based pricing
6.
• Like humanbeings products also will have life cycle.
• There will be four important stages i.eIntroduction, Growth, Maturity,
decline.
• These stages are inevitable. They can not be avoided but only can be
postponed.
• Firms follow different pricing strategies in different stages.
• During introduction stage penetration pricing method is suitable to gain
platform in the market.
• Once growth stage is started firms charges high prices to earn more
profits.
• In maturity stage firms go for product modifications, discounts, offers to
survive in the market, bcz next stage is declining stage. Once this stage is
set in it is very difficult to survive in the market.
7.
• In decliningstage, firms try to remove the product from the market. Firms
opt for clearance sale and try to shutdown the business not able to bear
the losses.
8.
BUSINESS ECONOMICS ANDFINANCIAL ANALYSIS(21CS701HSM)
UNIT-3
TOPIC-6
Introduction to market structures
• Market A market is a place where goods and services are sold to the
consumers for a price
• Buyers and sellers negotiate their exchange of well defined products
and services
• Size of the market depends upon many factors such as
i) nature of the product ii)demand iii) tastes & preferences
iv) income levels v) state of technology & infrastructural facilities.
Market structure
i)Number of sellers & their contribution or share
ii)Number of buyers & their purchasing patterns
iii) Product differentiation ie varieties & different brands
iv) Conditions of entry into the market & exit.
Types of market competitions
I) Perfect competition
II) Imperfect competition.
a) Monopoly b) Monopolistic c) Oligopoly d) Duopoly
9.
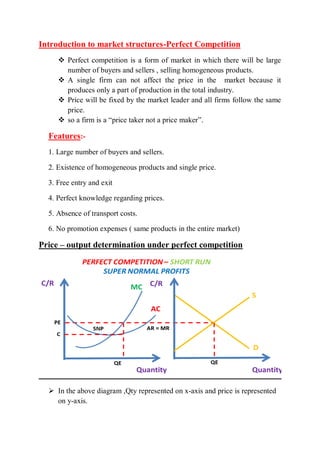
Introduction to marketstructures-Perfect Competition
Perfect competition is a form of market in which there will be large
number of buyers and sellers , selling homogeneous products.
A single firm can not affect the price in the market because it
produces only a part of production in the total industry.
Price will be fixed by the market leader and all firms follow the same
price.
so a firm is a “price taker not a price maker”.
Features:-
1. Large number of buyers and sellers.
2. Existence of homogeneous products and single price.
3. Free entry and exit
4. Perfect knowledge regarding prices.
5. Absence of transport costs.
6. No promotion expenses ( same products in the entire market)
Price – output determination under perfect competition
In the above diagram ,Qty represented on x-axis and price is represented
on y-axis.
10.
AR=MR=Price .Thisline parallel to x-axis. It indicates that bcz of single
price there will not be any difference in the average revenue and marginal
revenue and price.
Mc curve cuts MR curve from below. From this intersection point if we
draw a line to x-axis , it determines qty to be sold. The point where it cuts
the AC curve determines the cost .
We have to draw a line to y-axis to know the cost of production. Point C
represents cost.
The area represented by SNP shows super normal profits to the firm.
Because of profit outlook many firms enter the market and profits
will be diluted .
In In this diagram AC curve just tangential to AR curve.
MC cuts MR curve from below at this point of tangency
So the firms will be at equilibrium and making no profits no losses.
Here Cost = Revenue.
If we draw a line to x-axis it determines Qty.
If we draw a line to y-axis it determines price.
11.
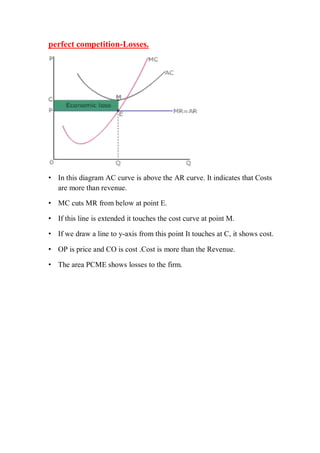
perfect competition-Losses.
• Inthis diagram AC curve is above the AR curve. It indicates that Costs
are more than revenue.
• MC cuts MR from below at point E.
• If this line is extended it touches the cost curve at point M.
• If we draw a line to y-axis from this point It touches at C, it shows cost.
• OP is price and CO is cost .Cost is more than the Revenue.
• The area PCME shows losses to the firm.
12.
BUSINESS ECONOMICS ANDFINANCIAL ANALYSIS(21CS701HSM)
UNIT-3
TOPIC-7
MONOPOLY
Monopoly is that market structure in which a single seller or producer
controls the whole supply.
There is no difference between firm and industry.
Lack of competition in the market leads to price dictatorship.
Features:-
1. There will be single seller in the market.
2. There will be no close substitutes for the product.
3. There will be entry barriers for others to enter the industry.
4. Cross elasticity is ‘0’.
5. A monopolist can control either price or quantity but not both.
6. There will be abnormal profits in the long run.
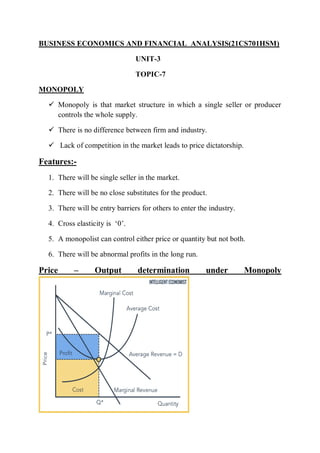
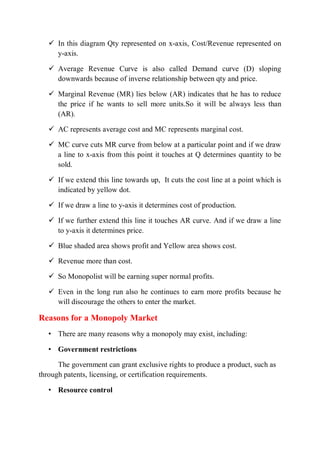
Price – Output determination under Monopoly
13.
In thisdiagram Qty represented on x-axis, Cost/Revenue represented on
y-axis.
Average Revenue Curve is also called Demand curve (D) sloping
downwards because of inverse relationship between qty and price.
Marginal Revenue (MR) lies below (AR) indicates that he has to reduce
the price if he wants to sell more units.So it will be always less than
(AR).
AC represents average cost and MC represents marginal cost.
MC curve cuts MR curve from below at a particular point and if we draw
a line to x-axis from this point it touches at Q determines quantity to be
sold.
If we extend this line towards up, It cuts the cost line at a point which is
indicated by yellow dot.
If we draw a line to y-axis it determines cost of production.
If we further extend this line it touches AR curve. And if we draw a line
to y-axis it determines price.
Blue shaded area shows profit and Yellow area shows cost.
Revenue more than cost.
So Monopolist will be earning super normal profits.
Even in the long run also he continues to earn more profits because he
will discourage the others to enter the market.
Reasons for a Monopoly Market
• There are many reasons why a monopoly may exist, including:
• Government restrictions
The government can grant exclusive rights to produce a product, such as
through patents, licensing, or certification requirements.
• Resource control
14.
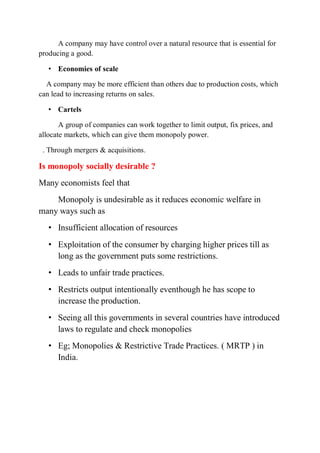
A company mayhave control over a natural resource that is essential for
producing a good.
• Economies of scale
A company may be more efficient than others due to production costs, which
can lead to increasing returns on sales.
• Cartels
A group of companies can work together to limit output, fix prices, and
allocate markets, which can give them monopoly power.
. Through mergers & acquisitions.
Is monopoly socially desirable ?
Many economists feel that
Monopoly is undesirable as it reduces economic welfare in
many ways such as
• Insufficient allocation of resources
• Exploitation of the consumer by charging higher prices till as
long as the government puts some restrictions.
• Leads to unfair trade practices.
• Restricts output intentionally eventhough he has scope to
increase the production.
• Seeing all this governments in several countries have introduced
laws to regulate and check monopolies
• Eg; Monopolies & Restrictive Trade Practices. ( MRTP ) in
India.
15.
BUSINESS ECONOMICS ANDFINANCIAL ANALYSIS(21CS701HSM)
UNIT-3
TOPIC-8
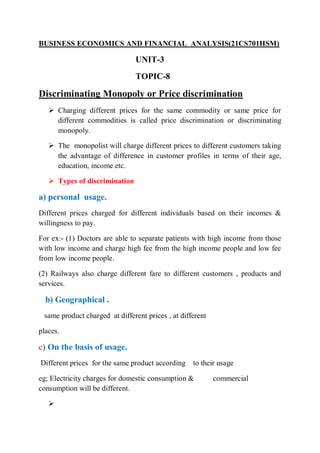
Discriminating Monopoly or Price discrimination
Charging different prices for the same commodity or same price for
different commodities is called price discrimination or discriminating
monopoly.
The monopolist will charge different prices to different customers taking
the advantage of difference in customer profiles in terms of their age,
education, income etc.
Types of discrimination
a) personal usage.
Different prices charged for different individuals based on their incomes &
willingness to pay.
For ex:- (1) Doctors are able to separate patients with high income from those
with low income and charge high fee from the high income people and low fee
from low income people.
(2) Railways also charge different fare to different customers , products and
services.
b) Geographical .
same product charged at different prices , at different
places.
c) On the basis of usage.
Different prices for the same product according to their usage
eg; Electricity charges for domestic consumption & commercial
consumption will be different.
16.
Conditions forprice discrimination:-
1. When customers are separated by distance or tariffs.
2. When customers have certain special preferences.
3. When government rules and regulations permit discrmination.
4. Customers ignorance and lethargy.
5. Market imperfections.
6. Special orders by customers.
Under above conditions monopolist charge different prices to different
customers.
Price - output determination under discriminating monopoly.
Price discrimination is possible and profitable only if elasticities are different in
different markets.
Monopolist charge high prices where the elasticity is low and low prices where
the elasticity is high.
It is illustrated in the following diagram.
In the Diagrams output is represented on x-axis and price is on y-axis.
Diagram 1 shows inelastic market . Here high prices will be charged
because there will not be much change in qty demanded.
17.
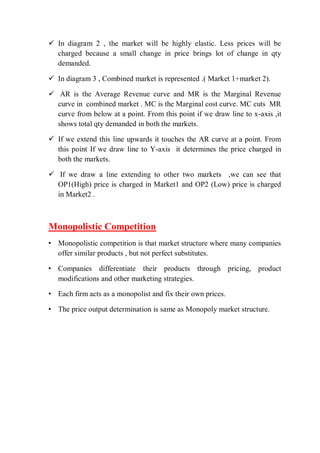
In diagram2 , the market will be highly elastic. Less prices will be
charged because a small change in price brings lot of change in qty
demanded.
In diagram 3 , Combined market is represented .( Market 1+market 2).
AR is the Average Revenue curve and MR is the Marginal Revenue
curve in combined market . MC is the Marginal cost curve. MC cuts MR
curve from below at a point. From this point if we draw line to x-axis ,it
shows total qty demanded in both the markets.
If we extend this line upwards it touches the AR curve at a point. From
this point If we draw line to Y-axis it determines the price charged in
both the markets.
If we draw a line extending to other two markets ,we can see that
OP1(High) price is charged in Market1 and OP2 (Low) price is charged
in Market2 .
Monopolistic Competition
• Monopolistic competition is that market structure where many companies
offer similar products , but not perfect substitutes.
• Companies differentiate their products through pricing, product
modifications and other marketing strategies.
• Each firm acts as a monopolist and fix their own prices.
• The price output determination is same as Monopoly market structure.
19.
BUSINESS ECONOMICS ANDFINANCIAL ANALYSIS(21CS701HSM)
UNIT-3
TOPIC-9
Oligopoly
Oligopoly is that market structure where a few firms will be competing with
one another producing homogeneous products or products which are
different but close substitutes to one another.
• There is an interdependency in the decision making of the firms, because
any decision taken bt one firm will definitely affect the trade of the
competitors.
• Then the competitors are likely to react with counter policies. For ex:-
Cold drinks industry and automobiles industry etc. are best examples for
this.
• Features:-
• 1. Interdependence in decision making
• 2.Regorous advertising and selling expenses will be there.
• 3.Indeterminate demand curve.
• 4.Few sellers will be there.
• 5. severe competition will be there.
• 6. Products may be identical or differentiated , but close substitutes to one
another.
Price-output determination under Oligopoly
• There is no definite theory of price output determination under oligopoly
because there is an interdependency in the decision making of
oligopolists.
• Kinked demand curvetheory given by Sweezy is useful for price output
determination under oligopoly.
20.
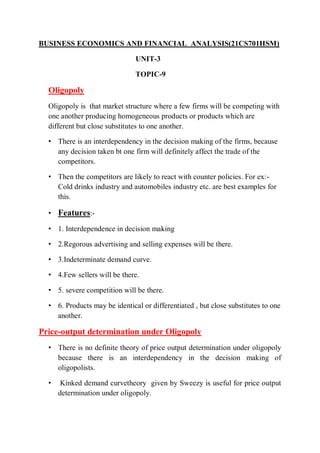
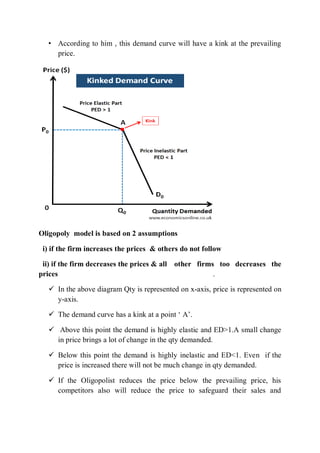
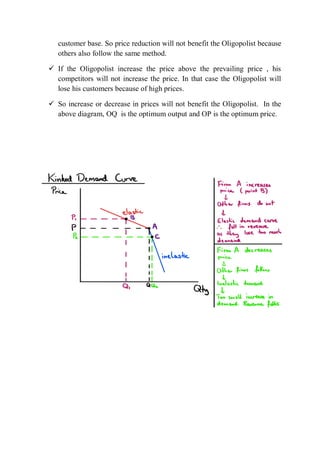
• According tohim , this demand curve will have a kink at the prevailing
price.
Oligopoly model is based on 2 assumptions
i) if the firm increases the prices & others do not follow
ii) if the firm decreases the prices & all other firms too decreases the
prices .
In the above diagram Qty is represented on x-axis, price is represented on
y-axis.
The demand curve has a kink at a point ‘ A’.
Above this point the demand is highly elastic and ED>1.A small change
in price brings a lot of change in the qty demanded.
Below this point the demand is highly inelastic and ED<1. Even if the
price is increased there will not be much change in qty demanded.
If the Oligopolist reduces the price below the prevailing price, his
competitors also will reduce the price to safeguard their sales and
21.
customer base. Soprice reduction will not benefit the Oligopolist because
others also follow the same method.
If the Oligopolist increase the price above the prevailing price , his
competitors will not increase the price. In that case the Oligopolist will
lose his customers because of high prices.
So increase or decrease in prices will not benefit the Oligopolist. In the
above diagram, OQ is the optimum output and OP is the optimum price.