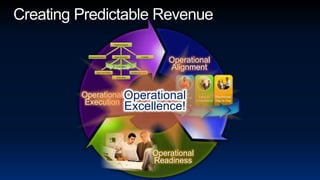
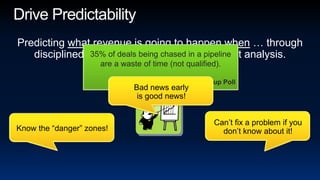
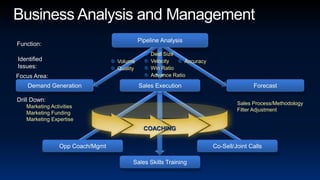
This document discusses ways for companies to create predictable revenue through operational alignment, execution, and readiness. It emphasizes analyzing the sales pipeline to identify issues. Key points include:
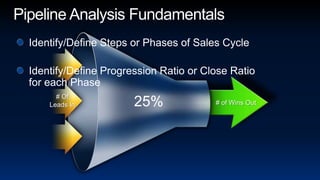
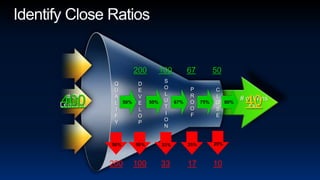
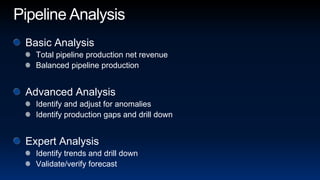
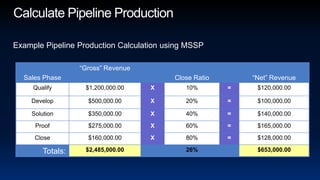
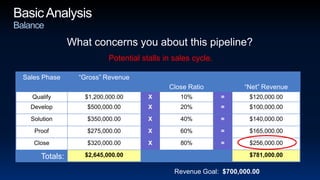
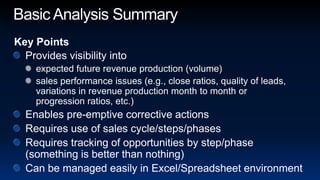
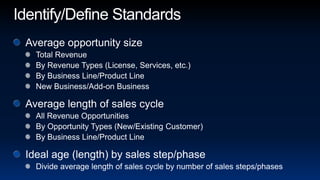
- Pipeline analysis identifies expected revenue, issues with close rates, lead quality, or variations over time.
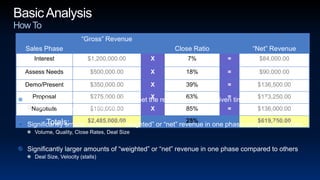
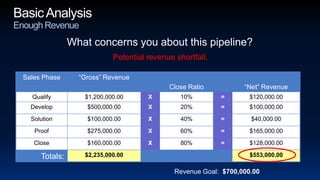
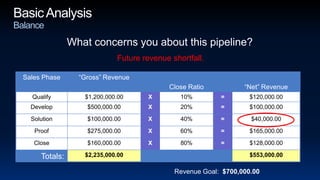
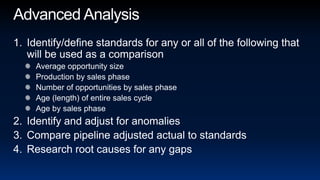
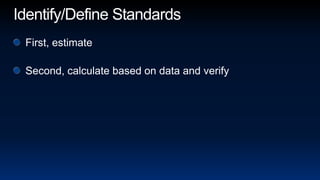
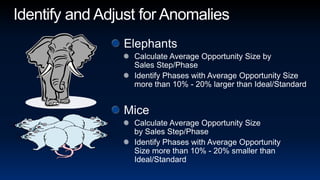
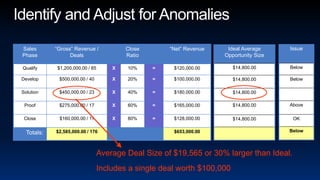
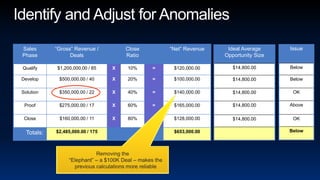
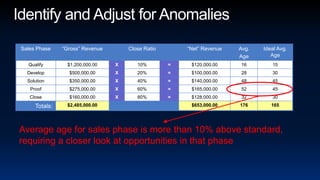
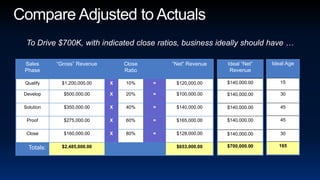
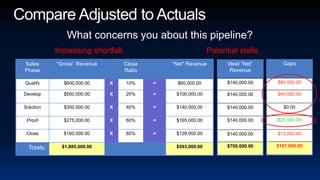
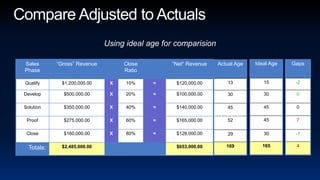
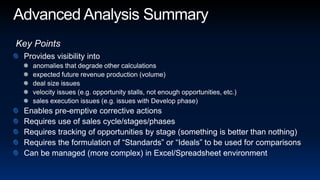
- Advanced analysis adjusts for anomalies, identifies production gaps, and researches causes.
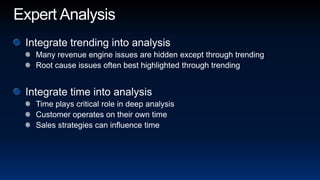
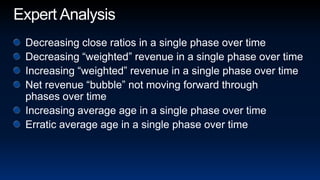
- Expert analysis integrates trends over time and considers how time impacts customers and strategies.
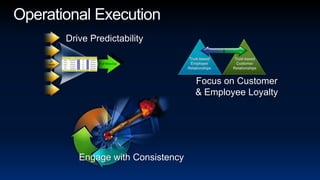
- The overall goal is driving predictability, focusing on customers and employees, and engaging consistently. Regular pipeline analysis can help companies address problems before revenue is affected.