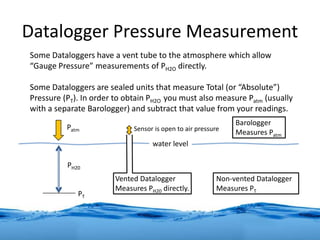
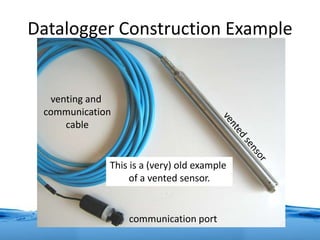
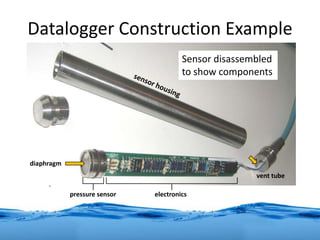
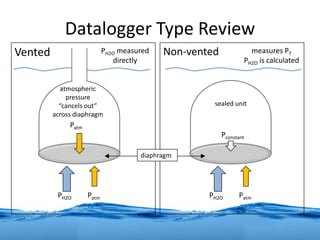
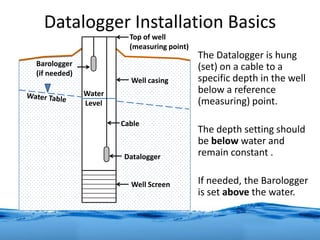
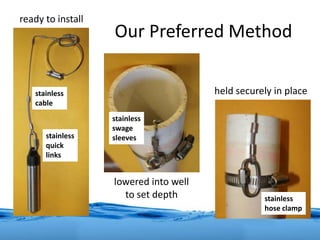
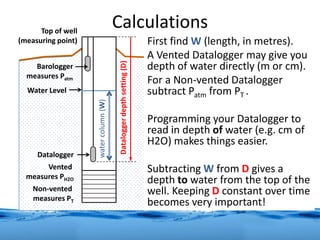
This self-directed course will guide you through the basics of how a Groundwater Datalogger is used for taking water level measurements. It also discusses some techniques on how to improve the accuracy of your collected data.
Formation Evaluation project (drill stem test DST)Gehad Alyazidy
What is DST?
DST Advantages and Disadvantages.
Explain the operations of a DST based on a labelled diagram including its pressure vs time plot.
By referring to a case study reported in open literature, explain the challenges facing the O&G companies to obtain reliable test results.
Hydraulics is a branch of science which deals with hydraulic fluid. It is used in places where cleanliness is not a priority but requires huge power to perform tasks.
application:
1. Industrial: Plastic processing machineries, steel making and primary metal extraction applications, automated production lines, machine tool industries, paper industries, loaders, crushes, textile machineries, R & D equipment and robotic systems etc.
2 Mobile hydraulics: Tractors, irrigation system, earthmoving equipment, material handling equipment, commercial vehicles, tunnel boring equipment, rail equipment, building and construction machineries and drilling rigs etc.
3 Automobiles: It is used in the systems like breaks, shock absorbers, steering system, wind shield, lift and cleaning etc.
4 Marine applications: It mostly covers ocean going vessels, fishing boats and navel equipment.
5 Aerospace equipment: There are equipment and systems used for rudder control, landing gear, breaks, flight control and transmission etc. which are used in airplanes, rockets and spaceships.
introduction to ESP (electrical submersible pump), working principle of ESP (electrical submersible pump), Application of ESP (electrical submersible pump), Uses of ESP in Oil Well, Specification of ESP (electrical submersible pump), New varieties of ESP (electrical submersible pump).
Draft Tube and Cavitation | Fluid MechanicsSatish Taji
Watch Video of this presentation on Link: https://youtu.be/OFIgUfclEHU
For notes/articles, Visit my blog (link is given below).
For Video, Visit our YouTube Channel (link is given below).
Any Suggestions/doubts/reactions, please leave in the comment box.
Follow Us on
YouTube: https://www.youtube.com/channel/UCVPftVoKZoIxVH_gh09bMkw/
Blog: https://e-gyaankosh.blogspot.com/
Facebook: https://www.facebook.com/egyaankosh/
Horizontal Directional Drilling : A Comprehensive Take by We-Bore-ItWe-Bore-It
With development in the drilling and construction industry, major changes have been observed in the drilling techniques used world wide. Horizontal Directional Drilling (HDD) is popular among the contractors because it is time saving, requires less resources and feasible in areas where other techniques possess a risk or threat to the surrounding environment. In this piece, We-Bore-It provides a comprehensive take on what HDD is all about and how it is performed.
Basics Fundamentals and working Principle of Centrifugal Pump.SHASHI BHUSHAN
Basics Fundamentals and working Principle of Centrifugal Pump. Centrifugal pumps are the rotodynamic machines that convert mechanical energy of shaft into kinetic and pressure energy of Fluid which may be used to raise the level of fluid. A centrifugal pump is named so, because the energy added by the impeller to the fluid is largely due to centrifugal effects.
A Beginner’s Guide: How to Use Flow Data Logger for Efficient MonitoringInfyiot Solutions
In today’s data-driven world, monitoring and analyzing flow data is critical for industries as diverse as environmental monitoring, manufacturing, and research. An essential tool for this task is a flow data logger. Hello friends, welcome to the step-by-step guide to effectively using Flow Data Logger to collect accurate and reliable data. Whether you’re a beginner or looking to improve your flow-tracking processes, this guide will give you the knowledge you need to get started.
• Surge analysis and dynamic simulation of pumped pipeline systems and networks.
• Preparing conceptual hydraulic designs, to advise on optimum pipeline routing and sizing, equipment selection and operating philosophy.
• Pump selection and optimisation of wet well volumes, with switching levels, to minimise the number of pumping cycles and reduce energy costs.
• Air valve selection and calculation of pipe diameters with gradients that will ensure stable flow development in drained sections of descending pipelines.
• Commissioning support and trouble-shooting on-site, with transient flow and pressure measurement/recording.
• Feasibility, capital and running cost estimates of pumping and pipeline systems
♦ Flow Assurance Studies
♦ Multiphase Flow Modeling
♦ Pipeline Efficiency Studies
♦ Surge Analysis Studies
♦ Thermal Analysis Studies
♦ Pipeline Leak Detection and Feasibility Studies
The VPFlowScope DP measures mass flow, temperature and pressure simultaneously and is optimized for wet compressed air measurements. The patented design has a bright blue LCD display which provides real-time information that, in combination with the built-in data logger, enables you to make recordings for certain periods of time. In turn, you can use our VPStudio software to process this data and print reports for real-time measurements.
Qualitrol has tons of products to help you properly monitor your Vault Transformers. Dissolved Gas Analyzers, Intelligent Monitors, and Temperature Gauges are some of the ways to maintain your assets.
You can learn more about Vault Monitoring with Qualitrol by clicking this link, https://www.qualitrolcorp.com/assets/vault-transformers/
Real Time Water Quality Monitoring and Alert Systems, Applications using OPEX...RekaNext Capital
In complex engineering business, it is useful to consider a OPEX model rather than a CAPEX model. This is to protect the customer from complex technology risks, changing technologies. Customer pays for successful delivery of services rather than buying equipment.
Pressure Data Logger
Importance of Pressure Data Logger
In addition to flow, volume, level, force, weather system movement, wind tunnel airflow, and even the height and magnitude of a tsunami wave, pressure is utilized to determine other physical attributes. The accuracy of the determination of the parameter being measured increases with the number of pressure data points that are available over time.
Similar to Basic Datalogger Water Level Measurement (20)
Transcript: Selling digital books in 2024: Insights from industry leaders - T...BookNet Canada
The publishing industry has been selling digital audiobooks and ebooks for over a decade and has found its groove. What’s changed? What has stayed the same? Where do we go from here? Join a group of leading sales peers from across the industry for a conversation about the lessons learned since the popularization of digital books, best practices, digital book supply chain management, and more.
Link to video recording: https://bnctechforum.ca/sessions/selling-digital-books-in-2024-insights-from-industry-leaders/
Presented by BookNet Canada on May 28, 2024, with support from the Department of Canadian Heritage.
Connector Corner: Automate dynamic content and events by pushing a buttonDianaGray10
Here is something new! In our next Connector Corner webinar, we will demonstrate how you can use a single workflow to:
Create a campaign using Mailchimp with merge tags/fields
Send an interactive Slack channel message (using buttons)
Have the message received by managers and peers along with a test email for review
But there’s more:
In a second workflow supporting the same use case, you’ll see:
Your campaign sent to target colleagues for approval
If the “Approve” button is clicked, a Jira/Zendesk ticket is created for the marketing design team
But—if the “Reject” button is pushed, colleagues will be alerted via Slack message
Join us to learn more about this new, human-in-the-loop capability, brought to you by Integration Service connectors.
And...
Speakers:
Akshay Agnihotri, Product Manager
Charlie Greenberg, Host
Smart TV Buyer Insights Survey 2024 by 91mobiles.pdf91mobiles
91mobiles recently conducted a Smart TV Buyer Insights Survey in which we asked over 3,000 respondents about the TV they own, aspects they look at on a new TV, and their TV buying preferences.
Epistemic Interaction - tuning interfaces to provide information for AI supportAlan Dix
Paper presented at SYNERGY workshop at AVI 2024, Genoa, Italy. 3rd June 2024
https://alandix.com/academic/papers/synergy2024-epistemic/
As machine learning integrates deeper into human-computer interactions, the concept of epistemic interaction emerges, aiming to refine these interactions to enhance system adaptability. This approach encourages minor, intentional adjustments in user behaviour to enrich the data available for system learning. This paper introduces epistemic interaction within the context of human-system communication, illustrating how deliberate interaction design can improve system understanding and adaptation. Through concrete examples, we demonstrate the potential of epistemic interaction to significantly advance human-computer interaction by leveraging intuitive human communication strategies to inform system design and functionality, offering a novel pathway for enriching user-system engagements.
Accelerate your Kubernetes clusters with Varnish CachingThijs Feryn
A presentation about the usage and availability of Varnish on Kubernetes. This talk explores the capabilities of Varnish caching and shows how to use the Varnish Helm chart to deploy it to Kubernetes.
This presentation was delivered at K8SUG Singapore. See https://feryn.eu/presentations/accelerate-your-kubernetes-clusters-with-varnish-caching-k8sug-singapore-28-2024 for more details.
Neuro-symbolic is not enough, we need neuro-*semantic*Frank van Harmelen
Neuro-symbolic (NeSy) AI is on the rise. However, simply machine learning on just any symbolic structure is not sufficient to really harvest the gains of NeSy. These will only be gained when the symbolic structures have an actual semantics. I give an operational definition of semantics as “predictable inference”.
All of this illustrated with link prediction over knowledge graphs, but the argument is general.
DevOps and Testing slides at DASA ConnectKari Kakkonen
My and Rik Marselis slides at 30.5.2024 DASA Connect conference. We discuss about what is testing, then what is agile testing and finally what is Testing in DevOps. Finally we had lovely workshop with the participants trying to find out different ways to think about quality and testing in different parts of the DevOps infinity loop.
Key Trends Shaping the Future of Infrastructure.pdfCheryl Hung
Keynote at DIGIT West Expo, Glasgow on 29 May 2024.
Cheryl Hung, ochery.com
Sr Director, Infrastructure Ecosystem, Arm.
The key trends across hardware, cloud and open-source; exploring how these areas are likely to mature and develop over the short and long-term, and then considering how organisations can position themselves to adapt and thrive.
Builder.ai Founder Sachin Dev Duggal's Strategic Approach to Create an Innova...Ramesh Iyer
In today's fast-changing business world, Companies that adapt and embrace new ideas often need help to keep up with the competition. However, fostering a culture of innovation takes much work. It takes vision, leadership and willingness to take risks in the right proportion. Sachin Dev Duggal, co-founder of Builder.ai, has perfected the art of this balance, creating a company culture where creativity and growth are nurtured at each stage.
Elevating Tactical DDD Patterns Through Object CalisthenicsDorra BARTAGUIZ
After immersing yourself in the blue book and its red counterpart, attending DDD-focused conferences, and applying tactical patterns, you're left with a crucial question: How do I ensure my design is effective? Tactical patterns within Domain-Driven Design (DDD) serve as guiding principles for creating clear and manageable domain models. However, achieving success with these patterns requires additional guidance. Interestingly, we've observed that a set of constraints initially designed for training purposes remarkably aligns with effective pattern implementation, offering a more ‘mechanical’ approach. Let's explore together how Object Calisthenics can elevate the design of your tactical DDD patterns, offering concrete help for those venturing into DDD for the first time!
UiPath Test Automation using UiPath Test Suite series, part 3DianaGray10
Welcome to UiPath Test Automation using UiPath Test Suite series part 3. In this session, we will cover desktop automation along with UI automation.
Topics covered:
UI automation Introduction,
UI automation Sample
Desktop automation flow
Pradeep Chinnala, Senior Consultant Automation Developer @WonderBotz and UiPath MVP
Deepak Rai, Automation Practice Lead, Boundaryless Group and UiPath MVP
2. Dataloggers are now frequently used
for water level measurement by
hydrogeologists and technicians.
This course introduces some basic
concepts and methods for beginners.
3. • Introduce basic concepts1
• Review standard
protocols2
• Illustrate practical field
methods3
Course Outline
4. Knowledge Base
We are assuming you are familiar with :
• common terms such as pressure; water
level measurement; elevation; aquifer;
unconfined; water table; etc.
• concepts of quality control and quality
assurance.
For simplicity all our examples deal with the
water table in an unconfined aquifer.
6. What Is A Datalogger?
“Datalogger” is the term used in this
course, however they are also known by a
variety of other terms (including pressure
sensors, transducers, etc).
Dataloggers are available in a wide variety
of makes and models with a large range of
capabilities and associated cost scale.
7. What Is A Datalogger?
Dataloggers allow automated water level
measurements to be obtained at rapid rates
and/or in remote locations. They improve
our capability to monitor water level.
To do this Dataloggers measure water or air
PRESSURE, record those measurements as
digital time series files, and, allows the files
to be retrieved as needed.
8. Why Measure Pressure?
The Datalogger measures pressure, but is
used to obtain water level measurements.
The pressure reading is used as an
INDIRECT measure of water level.
It is important to note that the Datalogger
pressure readings must be CONVERTED to
an equivalent water level measurement.
9. Why Measure Pressure?
• Water pressure increases with depth.
• Pressure values can be converted to an equivalent depth of water.
• However there are a number of practical factors to consider.
we want to measure the
pressure due to water column (PH20 )
water level
but atmospheric air pressure (Patm)
is also acting on the water column
therefore total pressure at this depth PT= PH20 + Patm
10. Datalogger Pressure Measurement
Some Dataloggers have a vent tube to the atmosphere which allow
“Gauge Pressure” measurements of PH2O directly.
Some Dataloggers are sealed units that measure Total (or “Absolute”)
Pressure (PT). In order to obtain PH2O you must also measure Patm (usually
with a separate Barologger) and subtract that value from your readings.
PH20
water level
Patm
PT
Vented Datalogger
Measures PH20 directly.
Non-vented Datalogger
Measures PT
Sensor is open to air pressure
Barologger
Measures Patm
11. Datalogger Construction Basics
• Two component groups to
consider:
1. The pressure sensor, and,
2. The internal electronics
(including battery).
• The pressure sensor has a
diaphragm, one side of
which is exposed to water.
• The diaphragm changes
shape as pressure changes. pressure to
be measured
diaphragm
electronics
(not shown)
12. Datalogger Construction Basics
• The changing shape also changes the electrical
resistance across the diaphragm – this provides a
range of voltage “signals” that corresponds to
equivalent pressures.
• For each measurement the internal electronics
provides voltage to the sensor, then converts the
returning “signal” to a pressure reading, and records
the data.
17. Standard Method SOP’s
A few datalogger specific Standard Operating
Procedures do exist.
Two examples are:
• USGS
• ISO 2005
18. United States Geological Survey
Use of Submersible Pressure Transducers in
Water-resources Investigations, USGS
Techniques of Water- Resources Investigations
Book 8, Chapter A3 (2004).
Provides a detailed explanation of
theory, and, construction/operation of
Dataloggers.
Please refer to that publication for more
details.
19. ISO 2005
Reference: International Standard ISO/TR
23211, Hydrometry – Measuring the water
level in a well using automated pressure
transducer methods.
Similar to USGS paper and methodology,
please refer to the publication for more
details.
20. Summary
• Detailed theoretical background information and
SOP’s exist, these deal with a wide variety of
instrument types and conditions.
• However for most practical applications using
modern commercially available complete
Datalogger units, some basic understanding and
common sense use should result in good data.
• We encourage you to develop a practical SOP for
your organization.
22. Try To Avoid These Situations!
(mistakes we have already made, or found, in the field)
confusion
(poor planning)
unanticipated conditions
(that were in fact predictable)
23. (more mistakes ….)
installations that really
don’t measure anything
(can you tell why?)
messy installations
(again, poor planning)
24. Datalogger Success
All of the commercially available Dataloggers that are
typically in use, vented or non-vented, can provide
accurate and valid water level data – provided they are
installed and used correctly.
Operator training is essential for success.
25. Basic Considerations
To ensure you are collecting good (accurate) data, you
should consider a number of factors when using a
Datalogger – including :
• Datalogger choice
• Datalogger use
• Datalogger installation
• Converting Datalogger readings to water levels
26. Datalogger Choice
• Type (Vented vs. Non-vented)
• Measurement range
• Rated accuracy
• Measurement frequency
• Installation method
• Communication method
• Battery life
• Construction material
• Reliability
• Durability
• User options
• Software
• Technical support
• Warranty
• Flexibility
• Special conditions
There are many factors to consider when choosing a
Datalogger for your project. Some of these factors include:
27. Datalogger Choice
The final choice of Datalogger will depend on your
project and organizational needs, specific
recommendations are beyond the scope of this course.
The key is to plan each Datalogger installation starting
with why you need it, what data you need to collect,
what conditions the Datalogger will encounter at the
well, how will it be installed, and, how it will be
maintained and downloaded.
28. Datalogger Use
Once you choose your Datalogger follow the
manufacturer’s instructions regarding
communication, programing and use. In addition you
should:
• Test each Datalogger before it goes into the field.
• Develop a QA/QC program that starts when you
install the Datalogger.
• Regularly maintain / download the Datalogger.
• Review your data – check for errors.
29. Datalogger Use
Remember you are using the Datalogger to calculate
equivalent water level measurements. So you need to
“calibrate” the measurement and conversion process.
• Obtain regular manual water level measurements to
compare to your Datalogger data.
• Check regularly to ensure the Datalogger is responding
correctly to water level change.
• Remember – no Datalogger will last forever, monitor
parameters that predict failure (DRIFT, battery levels,
other anomalies, etc.) before it happens so that you can
replace it in time.
30. Datalogger Installation Basics
The Datalogger is hung
(set) on a cable to a
specific depth in the well
below a reference
(measuring) point.
The depth setting should
be below water and
remain constant .
If needed, the Barologger
is set above the water.
Well Screen
Well casing
Top of well
(measuring point)
Water
Level
Cable
Datalogger
Barologger
(if needed)
31. Installation Considerations
• Depth to water and well construction (e.g. total well depth).
• Expected water level variation (e.g. avoid a dry Datalogger).
• Maximum pressure / depth (exceeding damages the sensor).
• Type of cable used (stainless, direct read, vented, etc.).
• How cable is secured at the top of the well.
• Need for Barologger to measure atmospheric pressure.
• Other equipment installed in well.
There are many factors to consider when installing
your Datalogger. Some of these factors include:
32. Some Installation Tips
• Vented Dataloggers need a Vented
communication cable, install according to
manufacturer’s instructions.
• Direct read cables can also be used for Non-
vented Dataloggers, again install according to
manufacture’s instructions.
• Many Non-vented Dataloggers are installed on
simple cables or lines. These need to be removed
(pulled) from the well at each download.
33. Our Preferred Method
held securely in place
lowered into well
to set depth
stainless
cable
stainless
swage
sleeves
stainless
hose clamp
stainless
quick
links
ready to install
34. Some Installation Tips
Please refer to our website for more details on
recommended cable materials and installation
methods for Non-Vented Dataloggers.
hydrogresources.com
35. CalculationsTop of well
(measuring point)
Water Level
Barologger
measures Patm
Datalogger
Vented
measures PH2O
Non-vented
measures PT
watercolumn(W)
Dataloggerdepthsetting(D)
First find W (length, in metres).
A Vented Datalogger may give you
depth of water directly (m or cm).
For a Non-vented Datalogger
subtract Patm from PT .
Programming your Datalogger to
read in depth of water (e.g. cm of
H2O) makes things easier.
Subtracting W from D gives a
depth to water from the top of the
well. Keeping D constant over time
becomes very important!
36. Data Accuracy
• The accuracy of your Datalogger will be much greater than the
accuracy of your installation depth setting measurement or
manual water levels (used to check the validity of your data)
• Manual water level measurements are generally ±1 cm
• Improving the accuracy of your depth setting measurement is one
of the most important methods to improve your data accuracy
• Avoid the tendency to determine the depth setting based on
Datalogger measurements, measure your depth setting!
• Datalogger depth setting (D) changes over time result in DRIFT
There are many factors that affect the accuracy of
your measurements. Some factors to consider:
37. Like everything – the care you take in your
Datalogger installation and use will be
reflected in the accuracy of your data.
Planning the installation, and recording as
much information as possible in the process,
helps immensely.
There is no substitute for common sense, so
adapt to your own situation, and good luck!
38. Response tests are
completed at two
wells at the same
time using separate
Dataloggers.
When you are trying
to do 10 things at
once…….
Some consistency
helps!
This template can be used as a starter file for presenting training materials in a group setting.SectionsRight-click on a slide to add sections. Sections can help to organize your slides or facilitate collaboration between multiple authors.NotesUse the Notes section for delivery notes or to provide additional details for the audience. View these notes in Presentation View during your presentation. Keep in mind the font size (important for accessibility, visibility, videotaping, and online production)Coordinated colors Pay particular attention to the graphs, charts, and text boxes.Consider that attendees will print in black and white or grayscale. Run a test print to make sure your colors work when printed in pure black and white and grayscale.Graphics, tables, and graphsKeep it simple: If possible, use consistent, non-distracting styles and colors.Label all graphs and tables.
This is another option for an Overview slide.
What will the audience be able to do after this training is complete? Briefly describe each objective how the audiencewill benefit from this presentation.
Use a section header for each of the topics, so there is a clear transition to the audience.
What will the audience be able to do after this training is complete? Briefly describe each objective how the audiencewill benefit from this presentation.
Use a section header for each of the topics, so there is a clear transition to the audience.
What will the audience be able to do after this training is complete? Briefly describe each objective how the audiencewill benefit from this presentation.
Use a section header for each of the topics, so there is a clear transition to the audience.
What will the audience be able to do after this training is complete? Briefly describe each objective how the audiencewill benefit from this presentation.
Add slides to each topic section as necessary, including slides with tables, graphs, and images. See next section for sampletable, graph, image, and video layouts.
What will the audience be able to do after this training is complete? Briefly describe each objective how the audiencewill benefit from this presentation.
This template can be used as a starter file for presenting training materials in a group setting.SectionsRight-click on a slide to add sections. Sections can help to organize your slides or facilitate collaboration between multiple authors.NotesUse the Notes section for delivery notes or to provide additional details for the audience. View these notes in Presentation View during your presentation. Keep in mind the font size (important for accessibility, visibility, videotaping, and online production)Coordinated colors Pay particular attention to the graphs, charts, and text boxes.Consider that attendees will print in black and white or grayscale. Run a test print to make sure your colors work when printed in pure black and white and grayscale.Graphics, tables, and graphsKeep it simple: If possible, use consistent, non-distracting styles and colors.Label all graphs and tables.