Download to read offline


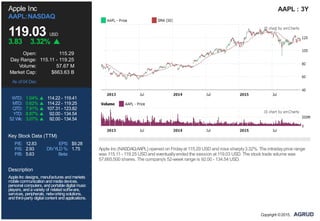
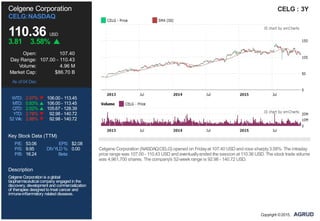

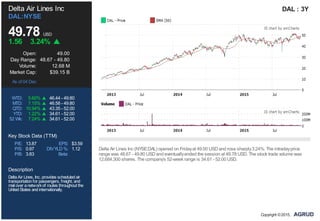
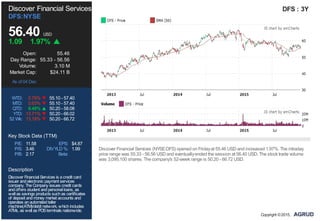
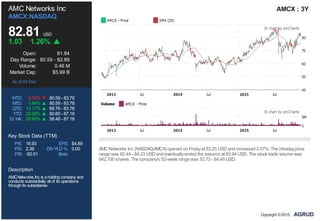
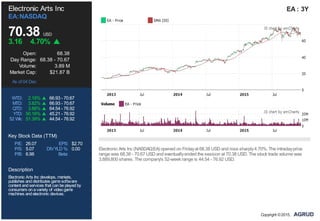
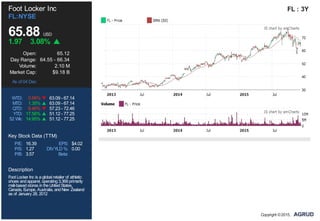
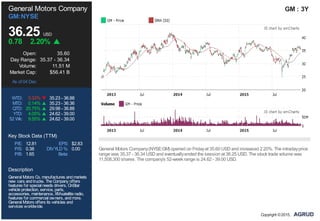


The document provides stock information for 10 companies on Friday, December 4th, 2015. For each company, it lists the stock ticker, opening price, highest and lowest prices of the day, closing price, volume traded, market cap, and year-to-date stock performance ranges. All 10 companies saw their stock prices increase between 1-5% on the day. The companies represented are Apple, Celgene Corporation, CVS Health Corporation, Delta Air Lines, Discover Financial Services, AMC Networks, Electronic Arts, Foot Locker, General Motors, and Mohawk Industries.


![[EB1 Boca do Monte] BEST of ... Hallow'een 2010](https://cdn.slidesharecdn.com/ss_thumbnails/eb1bocadomontehalloween2010-makingof-101030123415-phpapp01-thumbnail.jpg?width=640&height=640&fit=bounds)


