Download to read offline

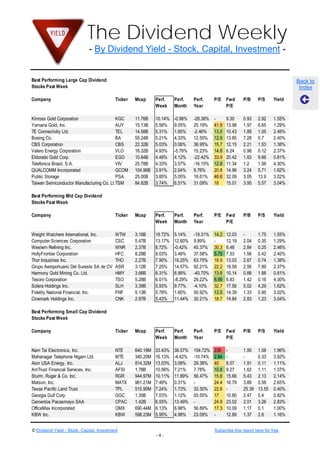
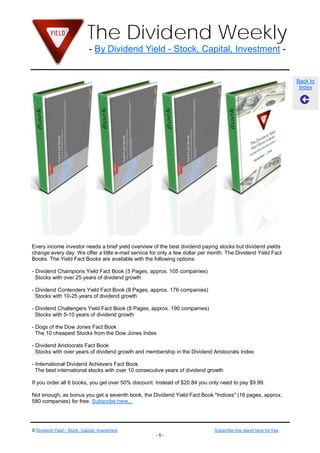
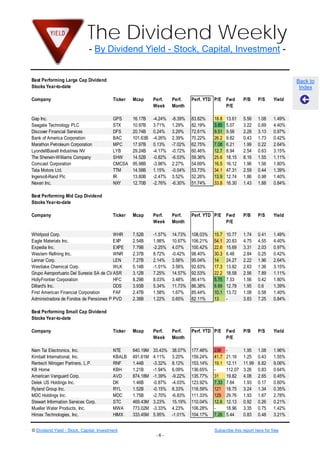
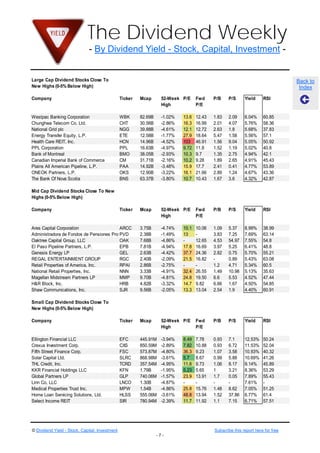
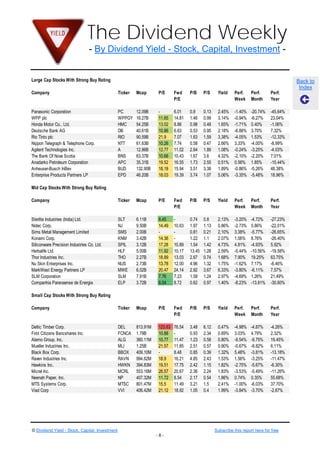
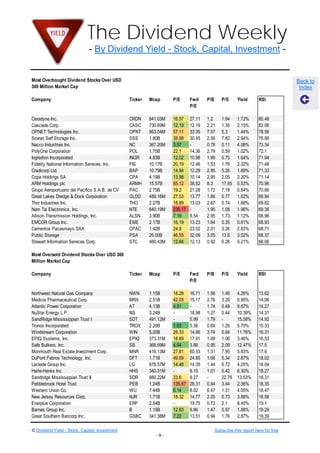
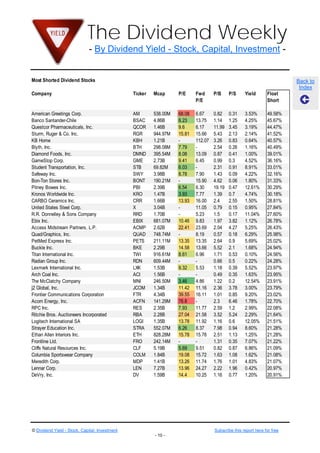
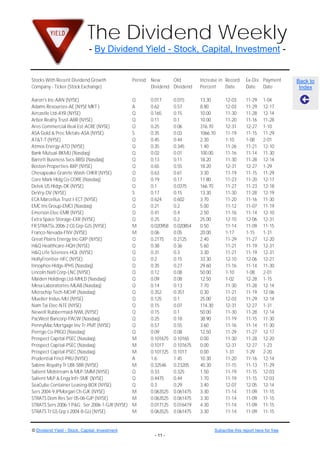
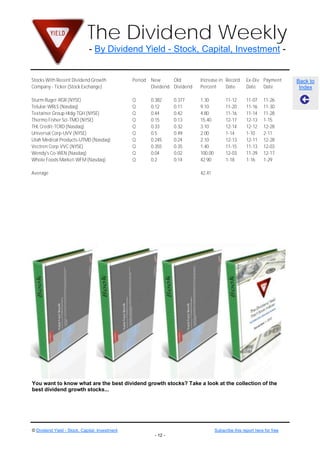
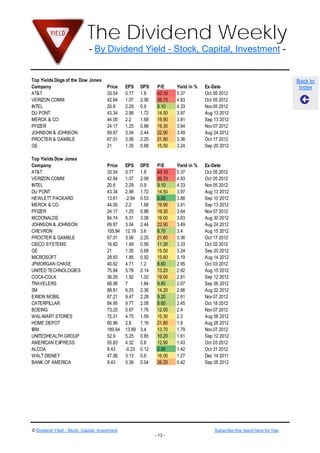
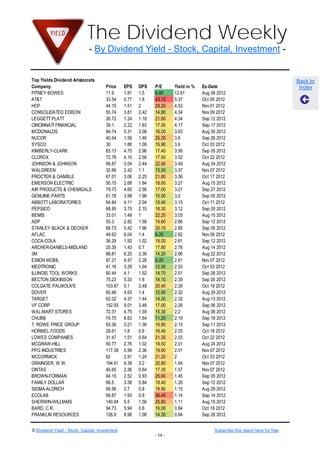
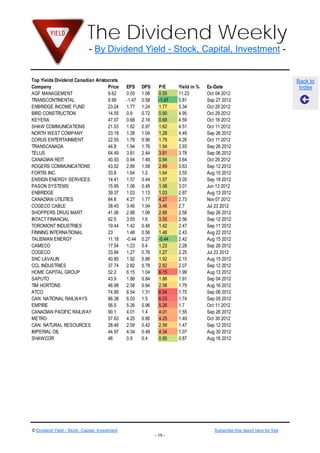
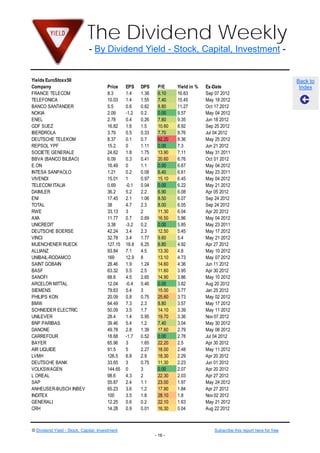
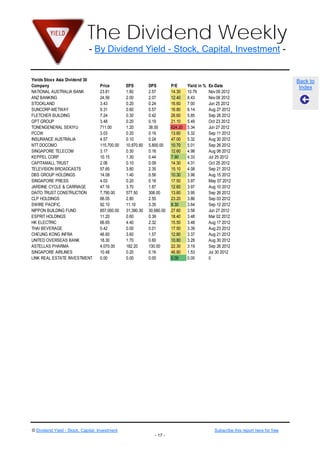
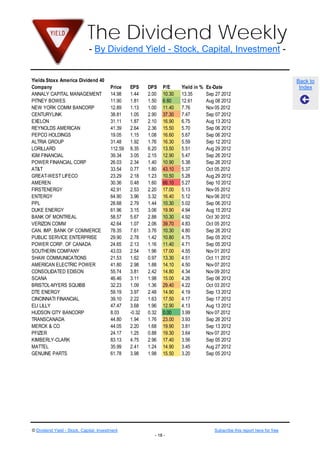
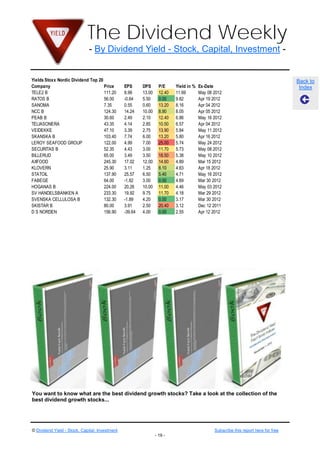
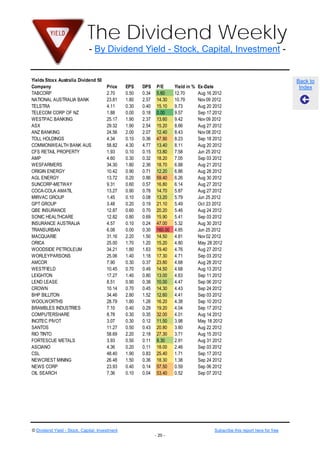
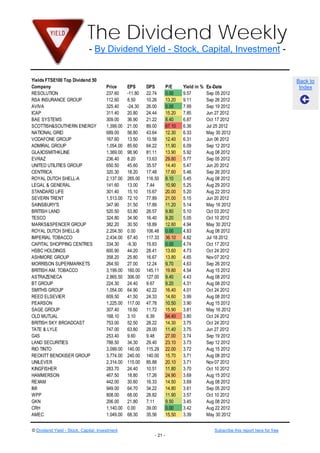
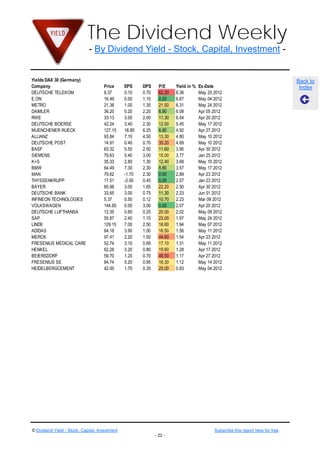
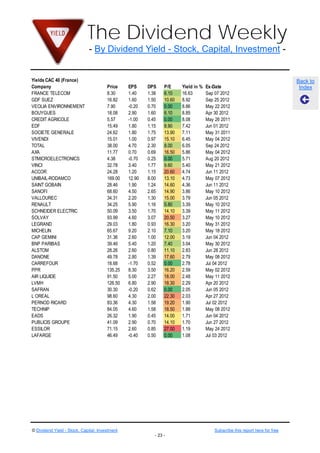
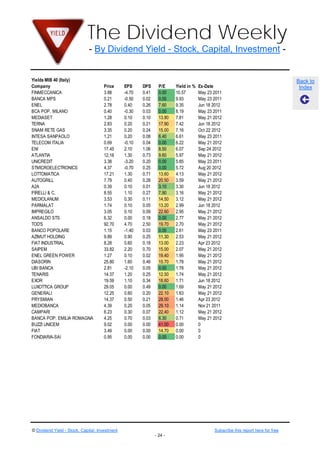
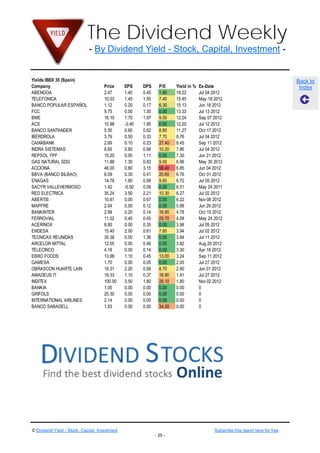
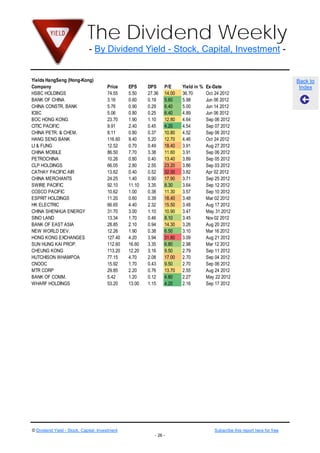
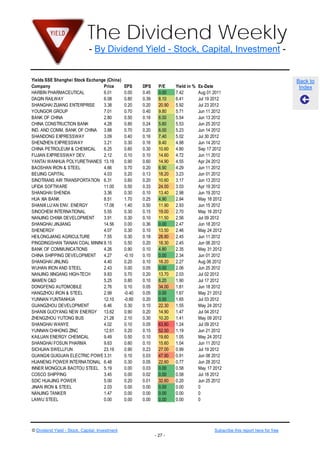
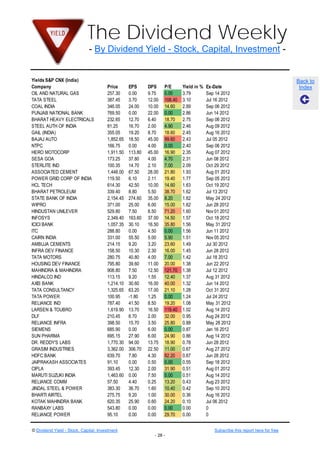
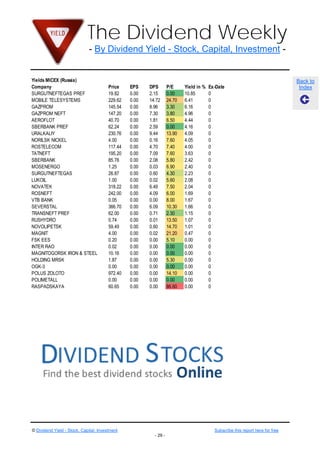
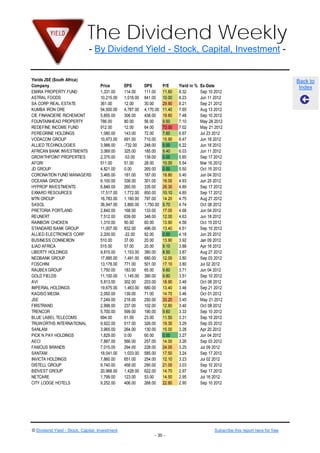
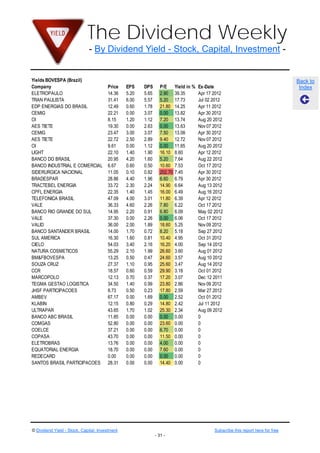
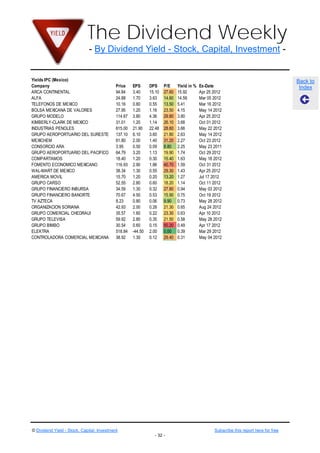
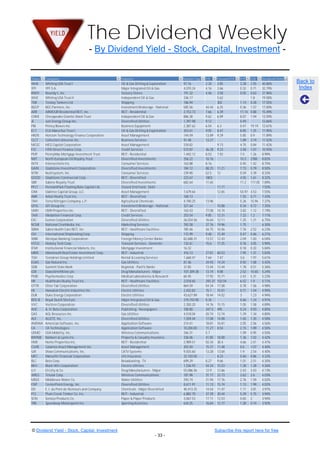
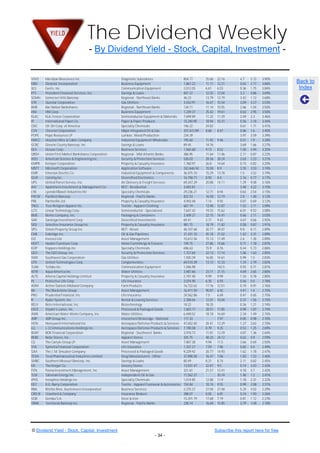
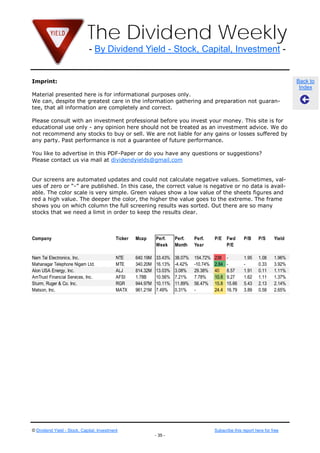


The document provides a comprehensive overview of recent and notable dividend stocks across various sectors, including large, mid, and small cap stocks. It highlights best performing stocks, dividend yields, and includes listings of specific stocks, their market capitalization, performance metrics, and current yields. Additionally, the document promotes subscription options for regular updates and detailed reports on dividend stocks.


