Download to read offline

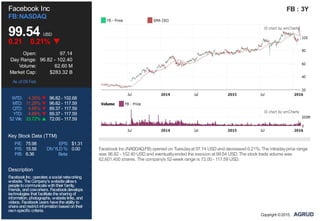
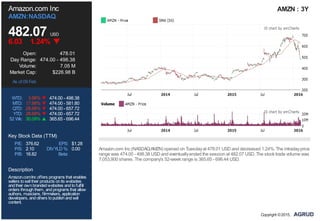
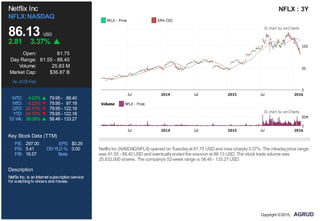
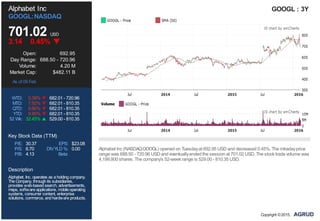

- The document discusses popular technology stocks for 2016, including Facebook, Amazon, Netflix, and Alphabet. - It provides stock prices, daily trading ranges, volumes, and performance data for each company from February 9th. - The stocks showed price increases for the week and month but Netflix had the largest daily gain, rising over 3%.


