Recovering From the COVID-19 Crisis and Building Resilience in CitiesOECD CFE
How has the crisis accelerated the shift towards a more inclusive, green and smart urban paradigm?
Co-hosted by the OECD and the Ministry of Housing, City and Territory of Colombia, in the framework of the ongoing OECD Urban Policy Review of Colombia, and as part of the OECD policy dialogues on COVID-19 recovery and resilience in cities and regions, this webinar brought together policy-makers from across the OECD to discuss how their cities and regions are tackling long-term structural challenges exacerbated by the COVID-19 crisis, such as low productivity and employment levels, inequalities, weakening public trust, and mounting pressure to tackle climate change. The webinar provided an opportunity to exchange experiences and draw lessons to inspire place-based innovative policies to foster economic growth, well-being and resilience.
More information: www.oecd.org/regional/cities/policy-dialogues-cities.htm
Follow us on Twitter: @OECD_local
Urban regeneration, economic stimulation and social innovation in the context...OECD CFE
Presentation by Claudia Farone, Claudia Faraone, Post-Doctoral Researcher, IUAV University of Venice, Italy at the fifth meeting of the Spatial productivity Lab of the OECD Trento Centre held on 10 October 2019.
More info http://oe.cd/SPL
Presentation on youth perception of rural areas and opportunities for change under Pillar 2B at the 12th OECD Rural Development Conference on Delivering Well-being, 24-26 September 2019, Seoul Korea. Presentation by Jean-Baptiste Baud, Director of public affairs - Familles Rurales.
More information: https://www.oecd.org/rural/rural-development-conference/
Local Agenda 21 in the Basque Country, in a local-regional partnershipUdalsarea21
Fernando Barrenechea, Director General de Ihobe y coordinador de la Secretaría Técnica de Udalsarea 21, ha participado este fin de semana en el Congreso Mundial de ICLEI (Asociación de Gobiernos Locales por la Sostenibilidad) que se ha celebrado en Belo Horizonte (Brasil). En el mismo, miembros y socios de ICLEI han mostrado las acciones realizadas para mejorar la sostenibilidad de sus respectivos territorios y han debatido estrategias para el futuro.
O Marketing Digital é uma área emergente e de extrema importância para
pequenas, médias e grandes empresas da atualidade, uma vez que, na sua
maioria todas se fazem representar digitalmente, por meio de diversas
formas, como sejam, Websites, Blogs, Redes Sociais, Aplicações Móveis entre
outras.
Esta ação de formação tem como principais objetivos potenciar e promover,
junto dos formandos, competências e técnicas na área do marketing digital,
recorrendo à implementação de estratégias e metodologias, através de
ferramentas atuais e eficazes.
Além de sensibilizar os formandos para obterem uma visão crítica e
aprofundada, sobre os vários instrumentos de marketing disponíveis na
internet, esta ação de formação pretende capacitar os formandos para agir
de forma criativa e analítica na concepção e implementação de estratégias e
respetiva análise de resultados.
Smart cities - Comparison among EU modelsMirko Podda
The general objective of the work is to compare cities in different european countries. Our research is focused on giving a general overview of smart cities situated in Germany, Poland and Sardinia.
Starting from two European programs named: “The Smart Cities and Communities EIP” and “The Covenant of Majors”, we show how the cities object of our study have used these ones in order to be “Smarter”.
A city can be defined ‘smart’ when invests in human & social capital, traditional and modern communication infrastructures, sustainable economic development and a high quality of life, with a wise management of natural resources, through participatory action and engagement. A City can be considered "smart" when achieves evaluable performances considering 6 characteristics, built on the ‘smart’ combination of activities of self-decisive, independent and aware citizens.
The integrated approach to urban development in EU URBACT
Presentation delivered by Corinne Hermant-de Callataÿ -
Competence centre for urban and territorial development, Directorate-General "Regional and urban policy"
European Commission.
URBACT Pilot training scheme - Brussels 9/4/2013
As part of the session on Human Factors, we present an overview of the scenarios of the QROWD project and how different human actors participate towards the design, implementation and operation of mobility services
Cities future outlook and digital cities by Marco Moretti - A2A Smart City Pr...EIT Climate-KIC
Cities future outlook and digital cities: the public utility contribution in the digital and green field presented by Marco Moretti - A2A Smart City President | CIO A2A Group at the Climate Innovation Summit in Milan, 2017.
Case Study: ioPartecipo+ Participatory policymaking platform in the region ...Sabrina Franceschini
Analysis of the Value of New Generation of eGovernment Services and How Can the Public Sector Become an Agent of Innovation Through ICT
Brussels
31 May 2016
Chiara Caranti - Air Quality in Bologna Bottom-up initiatives, Citizen engage...Fundacja ePaństwo
Chiara Caranti (Office of Sustainable Growth in Bologna) - Air Quality in Bologna Bottom-up initiatives, Citizen engagement
3. Festival of Civic Tech for Democracy @ Personal Democracy Forum CEE 2019
April 6, 2019
Gdańsk, Poland
Global Cities Smart Initiative
Future Cities Funding
Smart Cities Financing
Smart Eurocities
European Strategic and Investment Funds
European Investment Bank
European Investment Fund
Firts Deadline by 15 July
OECD Roundtable on Smart Cities and Inclusive GrowthOECDregions
Cities around the world are still battling COVID-19 and shaping their way out of the crisis.
As the world learns to live with the virus, never have digital technologies and innovation been so valuable to help cities navigate the crisis and accelerate the transition towards a more sustainable and resilient future. Both before and during the pandemic, smart city initiatives have flourished around the globe, together with various attempts to develop smart city indices and indicators.
With substantial public funding channelled into smart recovery efforts, it is more critical than ever to assess whether investment in smart cities improves people’s lives. To what extent do smart cities deliver concrete well-being outcomes for all? How can such outcomes be effectively measured, monitored and maximised?
Learn more from our Roundtable: oe.cd/sc-rt
Dati, statistiche e fake news. Che fare nell'istruzione secondaria?Giovanni Barbieri
Giovanni A. Barbieri
Intervento al seminario Finanza, economia, impresa: insegnare nel contesto europeo
Università degli studi di Milano-Bicocca
14 ottobre 2019
Le parole per capire i numeri, i numeri per capire il mondoGiovanni Barbieri
Le parole per capire i numeri, i numeri per capire il mondo
Giovanni A. Barbieri
StatCities Taranto 2019
Tanto quanto. Per i livelli essenziali di statistica nel territorio
Taranto, 4-5 luglio 2019
Giovanni A. Barbieri – La digitalizzazione, strategia per addomesticare l'inf...Giovanni Barbieri
Digitisation, a strategy for domesticating information
Seminar
Le infrastrutture della conoscenza nel mondo digitale / Knowledge infrastructures in the digital world
Istat, Rome, May 5, 2018
Giovanni A. Barbieri – Il fatto è la cosa più ostinata del mondoGiovanni Barbieri
Giardini Naxos, 21 luglio 2017
Costruiamo il futuro: Summer school 2017
Realismo vs. apparenza
«Nella cultura dominante l’apparenza prende il posto della realtà»
Verso un sistema integrato di indicatori per le politiche localiGiovanni Barbieri
Giovanni A. Barbieri, Istat
Intervento al convegno:
Matera, 9 giugno 2017
I Comuni verso l’uso statistico degli archivi amministrativi
e dei sistemi di integrazione delle fonti
Dati e indicatori per le politiche del territorio
Barbieri De Francisci_Dealing with Open Data at ISTATGiovanni Barbieri
Dealing with Open Data at ISTAT. First Steps Towards a Perfect Data Portal: a Cutting-edge Approach for Dealing with Open Data
IAOS, Abu Dhabi, December 6, 2016
La domanda d’informazione statistica integrata: nuovi usi e nuovi utentiGiovanni Barbieri
La modernizzazione dei processi di produzione incrementa notevolmente l'offerta di informazione statistica integrata. Ma a quale domanda si rivolge questa offerta? A quali utenti? A quali usi? E a quali principi deve attenersi la statistica pubblica?
Scuola e mercato del lavoro: una prospettiva storica, di Giovanni A. Barbieri...Giovanni Barbieri
Scuola e mercato del lavoro: una prospettiva storica
Intervento al convegno scientifico "La scuola in Italia: i protagonisti, i fatti, i dati". Salerno, 18 ottobre 2016
Intervento a StatCities 2016.
Tre spunti a partire dal lavoro svolto dal Servizio Statistica e toponomastica del Comune di Firenze:
Diffondere la cultura dell’analisi e dell’integrazione
Le nuove geografie e le nuove prospettive
Di quali informazioni hanno bisogno i luoghi?
Disparità territoriali e politiche di coesione: il ruolo dell'Istat 1926-2016Giovanni Barbieri
L’attenzione dell’Istat alle disparità territoriali è indissolubilmente legato alle vicende del Paese: dal centralismo dell'epoca fascista alle diverse concezioni che i partiti di ispirazione liberale, cattolica, socialista e comunista hanno della natura dei divari e dunque delle politiche per la loro riduzione. La definizione geografica del Mezzogiorno, diversa da quella amministrativa, rende arduo il compito delle statistiche. Dalla seconda metà degli anni Ottanta, con l’Atto unico europeo e la riforma dei fondi strutturali, l’Istat è chiamato a dare sostegno di documentazione alle politiche di coesione e si apre un nuovo straordinario periodo di sviluppo delle statistiche territoriali, tuttora in crescita.
La stima del valore aggiunto a livello territoriale: nuovi sviluppi (G. A. Ba...Giovanni Barbieri
Il lavoro si basa sui risultati degli studi e sperimentazioni in corso in Istat per ricercare una soluzione compiuta alla stima del valore aggiunto su base territoriale fine.
As Europe's leading economic powerhouse and the fourth-largest hashtag#economy globally, Germany stands at the forefront of innovation and industrial might. Renowned for its precision engineering and high-tech sectors, Germany's economic structure is heavily supported by a robust service industry, accounting for approximately 68% of its GDP. This economic clout and strategic geopolitical stance position Germany as a focal point in the global cyber threat landscape.
In the face of escalating global tensions, particularly those emanating from geopolitical disputes with nations like hashtag#Russia and hashtag#China, hashtag#Germany has witnessed a significant uptick in targeted cyber operations. Our analysis indicates a marked increase in hashtag#cyberattack sophistication aimed at critical infrastructure and key industrial sectors. These attacks range from ransomware campaigns to hashtag#AdvancedPersistentThreats (hashtag#APTs), threatening national security and business integrity.
🔑 Key findings include:
🔍 Increased frequency and complexity of cyber threats.
🔍 Escalation of state-sponsored and criminally motivated cyber operations.
🔍 Active dark web exchanges of malicious tools and tactics.
Our comprehensive report delves into these challenges, using a blend of open-source and proprietary data collection techniques. By monitoring activity on critical networks and analyzing attack patterns, our team provides a detailed overview of the threats facing German entities.
This report aims to equip stakeholders across public and private sectors with the knowledge to enhance their defensive strategies, reduce exposure to cyber risks, and reinforce Germany's resilience against cyber threats.
Explore our comprehensive data analysis project presentation on predicting product ad campaign performance. Learn how data-driven insights can optimize your marketing strategies and enhance campaign effectiveness. Perfect for professionals and students looking to understand the power of data analysis in advertising. for more details visit: https://bostoninstituteofanalytics.org/data-science-and-artificial-intelligence/
Techniques to optimize the pagerank algorithm usually fall in two categories. One is to try reducing the work per iteration, and the other is to try reducing the number of iterations. These goals are often at odds with one another. Skipping computation on vertices which have already converged has the potential to save iteration time. Skipping in-identical vertices, with the same in-links, helps reduce duplicate computations and thus could help reduce iteration time. Road networks often have chains which can be short-circuited before pagerank computation to improve performance. Final ranks of chain nodes can be easily calculated. This could reduce both the iteration time, and the number of iterations. If a graph has no dangling nodes, pagerank of each strongly connected component can be computed in topological order. This could help reduce the iteration time, no. of iterations, and also enable multi-iteration concurrency in pagerank computation. The combination of all of the above methods is the STICD algorithm. [sticd] For dynamic graphs, unchanged components whose ranks are unaffected can be skipped altogether.
Opendatabay - Open Data Marketplace.pptxOpendatabay
Opendatabay.com unlocks the power of data for everyone. Open Data Marketplace fosters a collaborative hub for data enthusiasts to explore, share, and contribute to a vast collection of datasets.
First ever open hub for data enthusiasts to collaborate and innovate. A platform to explore, share, and contribute to a vast collection of datasets. Through robust quality control and innovative technologies like blockchain verification, opendatabay ensures the authenticity and reliability of datasets, empowering users to make data-driven decisions with confidence. Leverage cutting-edge AI technologies to enhance the data exploration, analysis, and discovery experience.
From intelligent search and recommendations to automated data productisation and quotation, Opendatabay AI-driven features streamline the data workflow. Finding the data you need shouldn't be a complex. Opendatabay simplifies the data acquisition process with an intuitive interface and robust search tools. Effortlessly explore, discover, and access the data you need, allowing you to focus on extracting valuable insights. Opendatabay breaks new ground with a dedicated, AI-generated, synthetic datasets.
Leverage these privacy-preserving datasets for training and testing AI models without compromising sensitive information. Opendatabay prioritizes transparency by providing detailed metadata, provenance information, and usage guidelines for each dataset, ensuring users have a comprehensive understanding of the data they're working with. By leveraging a powerful combination of distributed ledger technology and rigorous third-party audits Opendatabay ensures the authenticity and reliability of every dataset. Security is at the core of Opendatabay. Marketplace implements stringent security measures, including encryption, access controls, and regular vulnerability assessments, to safeguard your data and protect your privacy.
Levelwise PageRank with Loop-Based Dead End Handling Strategy : SHORT REPORT ...Subhajit Sahu
Abstract — Levelwise PageRank is an alternative method of PageRank computation which decomposes the input graph into a directed acyclic block-graph of strongly connected components, and processes them in topological order, one level at a time. This enables calculation for ranks in a distributed fashion without per-iteration communication, unlike the standard method where all vertices are processed in each iteration. It however comes with a precondition of the absence of dead ends in the input graph. Here, the native non-distributed performance of Levelwise PageRank was compared against Monolithic PageRank on a CPU as well as a GPU. To ensure a fair comparison, Monolithic PageRank was also performed on a graph where vertices were split by components. Results indicate that Levelwise PageRank is about as fast as Monolithic PageRank on the CPU, but quite a bit slower on the GPU. Slowdown on the GPU is likely caused by a large submission of small workloads, and expected to be non-issue when the computation is performed on massive graphs.
Data Centers - Striving Within A Narrow Range - Research Report - MCG - May 2...pchutichetpong
M Capital Group (“MCG”) expects to see demand and the changing evolution of supply, facilitated through institutional investment rotation out of offices and into work from home (“WFH”), while the ever-expanding need for data storage as global internet usage expands, with experts predicting 5.3 billion users by 2023. These market factors will be underpinned by technological changes, such as progressing cloud services and edge sites, allowing the industry to see strong expected annual growth of 13% over the next 4 years.
Whilst competitive headwinds remain, represented through the recent second bankruptcy filing of Sungard, which blames “COVID-19 and other macroeconomic trends including delayed customer spending decisions, insourcing and reductions in IT spending, energy inflation and reduction in demand for certain services”, the industry has seen key adjustments, where MCG believes that engineering cost management and technological innovation will be paramount to success.
MCG reports that the more favorable market conditions expected over the next few years, helped by the winding down of pandemic restrictions and a hybrid working environment will be driving market momentum forward. The continuous injection of capital by alternative investment firms, as well as the growing infrastructural investment from cloud service providers and social media companies, whose revenues are expected to grow over 3.6x larger by value in 2026, will likely help propel center provision and innovation. These factors paint a promising picture for the industry players that offset rising input costs and adapt to new technologies.
According to M Capital Group: “Specifically, the long-term cost-saving opportunities available from the rise of remote managing will likely aid value growth for the industry. Through margin optimization and further availability of capital for reinvestment, strong players will maintain their competitive foothold, while weaker players exit the market to balance supply and demand.”
Data Centers - Striving Within A Narrow Range - Research Report - MCG - May 2...
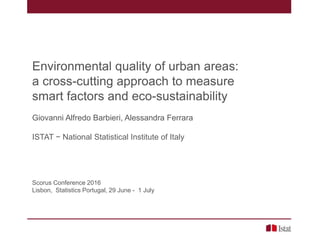
Barbieri & Ferrara Scorus2016
1. Environmental quality of urban areas:
a cross-cutting approach to measure
smart factors and eco-sustainability
Giovanni Alfredo Barbieri, Alessandra Ferrara
ISTAT − National Statistical Institute of Italy
Scorus Conference 2016
Lisbon, Statistics Portugal, 29 June - 1 July
2. • Smart cities: what do we measure?
• Urban Environmental quality: proposal to measure
smart and sustainability factors
• Indicators by 6 multi-topic dimensions: a cross-cutting
approach
• Performance of cities
• Conclusions
Outline
Smart factors and eco-sustainability in urban areas
G.A. Barbieri, A. Ferrara – Scorus 2016
3. 1. The concept of smart city is integrated in the
actions and priorities of EC policies:
- Five goals and seven flagship initiatives for the
2020 Europe Strategy for smart, sustainable and
inclusive growth: all with a direct connection with the
smart city
• The core strategy is related to the
technological components to support the
improvement of public services
• On the contrary, less emphasis is placed on
other components of smartness such as
governance’s actions
Europe: debate and experiences
Smart factors and eco-sustainability in urban areas
G.A. Barbieri, A. Ferrara – Scorus 2016
4. 2. Monitoring process
- The Digital Agenda has implemented a Digital
Agenda Scoreboard: for each country it collects only
data aggregated at the national level
- The biggest problem in monitoring projects and results on
Smart Cities and Communities is the territorial level of
investigation (the city).
• For each city there is a large number of sets of
indicators, but very few of these are accepted by the
generality of local realities involved in monitoring
• Cities tend to use indicators that are best suited to the
purposes of their own projects
• Difficulty in presenting an objective comparison
between cities and, sometimes, even within different
areas of cities
Europe: debate and experiences
Smart factors and eco-sustainability in urban areas
G.A. Barbieri, A. Ferrara – Scorus 2016
5. 3. Mapping Smart Cities in the EU, a more
comprehensive approach
- Smart cities actions are considered "not only as
guidelines to operate in a technologically
innovative approach to solving problems of urban
living, but as an integrated strategy to reduce
poverty, inequality, unemployment ..."
- Smart cities are described as the result of a
complex, coordinated approach to:
• develop and link capitals (human, social,
economic and environmental ones), technology
and ICT infrastructure,
• generate incremental economic development and
more sustainable and better quality of life
Europe: debate and experiences
Smart factors and eco-sustainability in urban areas
G.A. Barbieri, A. Ferrara – Scorus 2016
6. 4. Academic contributions
• A smart City is a city with at least one initiative
concerning these six ends: 1. Smart Governance, 2.
Smart People, 3. Smart Living, 4. Smart Mobility, 5.
Smart Economy, 6. Smart Environment
• 3 main components to achieve these ends:
1. Physical infrastructure: Smart technologies,
Mobile technologies, Digital networks
2. Human infrastructure: Social capital
3. Institutional factors: Governance, Policy,
Regulations and directives
Europe: debate and experiences
Smart factors and eco-sustainability in urban areas
G.A. Barbieri, A. Ferrara – Scorus 2016
7. To wrap it up:
• From a "basic" position [ICT networks/intelligent
use of digital technologies to ensure the availability
of information (early 90's)]
• To the 6 smart dimensions of Giffinger
(Governance, People, Living, Mobility, Economy,
Environment), with specific attention to urban scale
of analysis (R. Giffinger et al. 2007) (but constraint of
available indicators)
• To necessary and complementary role of human
and social capital (A. Caragliu et al. 2009)
Europe: debate and experiences
Smart factors and eco-sustainability in urban areas
G.A. Barbieri, A. Ferrara – Scorus 2016
8. The smart city is the result of the integration of the
physical and intangible infrastructure of places and
social relationships between people, which can
combine with each other to ensure a state of
overall well-being of people and communities
Europe: debate and experiences
Smart factors and eco-sustainability in urban areas
G.A. Barbieri, A. Ferrara – Scorus 2016
9. Law n°221/2012: a coordinated teamwork among
different public bodies for a good strategy and for an
efficient monitoring process
• Art.20 comma 12 «Smart communities»:
• for monitoring,[…] the Digital Agency, in contact
with the technical Committee of Smart cities, in
cooperation with ISTAT draws up, after consulting
ANCI (Association of Italian Municipalities),
• a system to measure including a set of statistical
indicators regarding both the present status and
progress of economic, social, cultural and
environmental conditions of smart
communities as well as the quality of life of its
citizens
Smart Communities: the italian institutional framework
Smart factors and eco-sustainability in urban areas
G.A. Barbieri, A. Ferrara – Scorus 2016
10. Urban Environment Quality
• Annual Istat survey
• 116 cities (NUTS3 capitals)
• 8 Topics:
• Eco-management
• Urban green areas
• Air
• Noise
• Waste
• Energy
• Water
• Urban mobility
Indicators are classified
according to the DPSIR
framework (EEA, 1995):
A proposal for a cross-cutting approach to measure
smart factors and eco-sustainability
Utilities
Pollutants
Smart factors and eco-sustainability in urban areas
G.A. Barbieri, A. Ferrara – Scorus 2016
A cross-cutting approach
11. • The Response
indicators from 8
survey topics are
grouped according
to 6 areas
• Each area
represents a
complex of actions
and measures that
define the
orientation of the
city government to
the eco-
sustainable
management and
smartness.
ICT Based innovation
Eco-Social Based Innovation
Accountabiliy and Stakeholders Involvement
Sustainable management
- Self-Governance -
Thematic Urban Planning and Governance Tools
Smart factors and eco-sustainability in urban areas
G.A. Barbieri, A. Ferrara – Scorus 2016
Sustainable management
- Environmental Policies -
From topics to analytical dimensions
12. Smart factors and eco-sustainability in urban areas
G.A. Barbieri, A. Ferrara – Scorus 2016
Accountability and
Stakeholders Involvement
Eco-Social reporting
Shared planning
On Line Services
Home Composting
...
B
Cities Thematic Planning and
Governance Tools
General/Thematic Plans and
Actions
...
A Sustainable Governance
Waste: actions to promote the
proper delivery
Air pollution: traffic road
restrictions
Water services: dispersions and
rationing measures
Sustainable mobility: parking,
Ztl, pedestrian areas
Green areas: georeferenced
census
...
C
Sustainable Self-Governance
Standards of Environmental
Management Achieved by Public
Offices
Green Public Procurement
Availability of Green Powered
Public Vehicles
Correct waste collections in
schools and public offices
...
D
Innovative Technologies and
Smart Energy
Charging Points for Electric
Vehicles
Smart Public Lighting
Energy from Renewable sources
Efficient use of energy by district
heating
Smart Traffic Light
Info mobility
..
E
Eco-Social Innovations
Incentives to Sustainable
Behaviour; Promotion of
Environment that Fosters Individual
and Collective Social Development
City gardens
Organic food for school
canteens
Sustainable Mobility Services
(as zone 30, bike paths, bike
sharing, car sharing)
Light Pollution Prevention
..
F
CROSS CUTTING DIMENSIONS
GOVERNANCE and
SELF-GOVERNANCE
Sustainable management
URBAN SMARTNESS
City map of smart and eco-sustainability response factors
13. • 59 indicators ware selected because of relevance on
6 thematic areas of analysis
• Indicators values were standardized according to this
scheme
• Normalization of each area’s total score (from 0 to 1
value)
• Final output: 6 rankings of 116 cities
+1 Municipalities who adopted not mandatory planning actions or positive
actions to improve urban environment end utilities quality or included in
the best quartile of cities distribution.
0 Municipalities compliant to planning rules or included in central quartiles
of cities distribution
-1 Municipalities NOT compliant to mandatory planning rules or with a low
level of utilities supply comparing to their demographic size or included in
the worst quartile of cities distribution.
Smart factors and eco-sustainability in urban areas
G.A. Barbieri, A. Ferrara – Scorus 2016
Indicators score
14. Topic Indicators Min Max
Eco-management 1. General Urban Plan (Y/N) -1 0
Energy 2. Green Energy Action Plan (Paes) (Y/N) -1 1
Mobility 3. Urban Mobility Plan
(Y/N)
Cities>100.000 ab. -1 1
Cities<100.000 ab. 0 1
4. Urban Traffic Road
Plan (Y/N)
Cities>30.000 ab. -1 0
Cities<30.000 ab. 0 1
Noise 5. Noise Cluster Map (Y/N) -1 0
Green Areas 6. Green Areas Plan (Y/N) 0 1
7. Ecological Network (Corridors and
Stepping Zones) (Y/N) 0 1
Smart factors and eco-sustainability in urban areas
G.A. Barbieri, A. Ferrara – Scorus 2016
Thematic Urban Planning and Governance Tools
15. 7
Topic Indicators Min Max
Water 1. Losses of Drinking Water (%) -1 1
2. Restriction in Drinking Water Supply (Y/N) -1 0
Air
3. Traffic Road Restriction
(Emergency or Planned Y/N)
With Air Pollutant (over
the threshold) -1 1
Without 0 1
Mobility 4. Road Parking Places with Fees
(n° x 1000 vehicles) -1 1
5. Intermodal Parking Areas (Y/N) -1 1
6. Areas with Traffic Road
Subjected to Restrictions (Y/N)
Cities>30.000 ab. -1 0
Cities<30.000 ab. 0 0
7. Pedestrian Areas Denity (m2
/km2
) 0 1
Waste 8. Waste Collected Door to Door 0 1
9. Big and Heavy Home Waste Collection on Demand (Y/N) 0 1
10. Permanent Areas for Special Waste Collection (Y/N) 0 1
11. Non Permanent Areas for Special Waste Collection
(Y/N) 0 1
12. 13. 14. 15. Other Waste Collection
Services/Information Campaign (Y/N) 0 1
Green Areas 16. Green Areas Georeferred Census 0 1
Sustainable Governance (Environmental Policies)
16. Topic Indicators Min Max
Eco-
management
1. Municipality/Offices Certified ISO
14001 (Y/N) 0 1
2. Municipality /Offices Certified EMAS
(Y/N) 0 1
3. Green Public Procurement (Y/N) -1 1
4. Recycled Paper /FSC Endowment (%) -1 1
5. Municipality Ecological Vehicles (%) -1 1
6. Proper Waste Collection in
Municipality Offices (Y/N) -1 1
Smart factors and eco-sustainability in urban areas
G.A. Barbieri, A. Ferrara – Scorus 2016
Sustainable Self-Governance
17. Topic Indicators Min Max
Eco-management1. Public Lighting – Solar (%) 0 1
2. Public Lighting – LED (%) 0 1
3. Public Lighting - Pollutant (%) -1 0
Energy 4. District heating (m3
/ab.) 0 1
5. Green Energy/Efficient Energy Use
(actions) -1 1
6. Charging point for electric vehicles 0 1
Mobility
7. Info mobility
(n° of services/8)
Metropolitan area -1 1
Cities >30.000 ab. -0,5 1
Cities<30.000 ab. 0 1
8. Smart Traffic Light
(%)
Cities>100.000 ab. -1 0
Cities<100.000 ab. -0,5 0,5
9. Car Sharing – Electric vehicles (%) 0 1
Smart factors and eco-sustainability in urban areas
G.A. Barbieri, A. Ferrara – Scorus 2016
ICT Innovation
18. Topic Indicators Min Max
Eco-
management
1. Organic Food in Canteens of School
(Y/N) 0 1
2. Public Lighting – Prevention of Light
Pollution (%) -1 1
Mobility 3. «Zone 30»
(Areas with
limitation of
vehicles speed)
(Y/N)
Cities >100.000 ab. -1 1
Cities 30.000-100.000
ab. -0,5 1
Cities <30.000 ab.
0 1
4. Cycle Paths Density (km/km2
) -1 1
5. Bike sharing (Y/N) 0 1
6. Car Sharing (Y/N)
Metropolitan Areas -1 1
Other Cities 0 1
Green Areas 7. «Trees Day» Actions (Y/N) 0 1
8. Urban Farm/Gardens (Y/N) 0 1
Smart factors and eco-sustainability in urban areas
G.A. Barbieri, A. Ferrara – Scorus 2016
Eco-Social Innovation
19. Topic Indicators Min Max
Eco-management1. Participatory Planning (Y/N) 0 1
2. Environmental Balance (Y/N) 0 1
3. Eco-Social Balance (Y/N) 0 1
4., 5. 6. On-Line Services – Demographic
Services (Y/N)
0 0,1
7. 8. 9.On-Line Services – Payments of
School Services (Y/N)
0 0,2
Waste
10. 11. 12.Incentives to Domestic
Composting (Y/N)
-1 0
Smart factors and eco-sustainability in urban areas
G.A. Barbieri, A. Ferrara – Scorus 2016
Accountability and Stakeholders Involvement
20. Smart factors and eco-sustainability in urban areas
G.A. Barbieri, A. Ferrara – Scorus 2016
URBAN
Overall performance: all cities by geographical area
21. Core of Metropolitan Areas or > 200.000 ab
URBAN
Overall performance: Metro cities by geographical area
22. Smart factors and eco-sustainability in urban areas
G.A. Barbieri, A. Ferrara – Scorus 2016
THEMATIC URBAN PLANNING
Performance by single dimension: Metro cities
23. Smart factors and eco-sustainability in urban areas
G.A. Barbieri, A. Ferrara – Scorus 2016
Performance by single dimension: Metro cities
24. Smart factors and eco-sustainability in urban areas
G.A. Barbieri, A. Ferrara – Scorus 2016
Performance by single dimension: Metro cities
25. Smart factors and eco-sustainability in urban areas
G.A. Barbieri, A. Ferrara – Scorus 2016
Positioning according to the 6 dimensions
-1 = Worst quartile
+1 = Best quartile
0 = Central quartiles
Performance by single dimension: Metro cities
28. • Our analysis aims at representing the ability of Italian
cities and towns in capturing the opportunities offered
by technological and societal progress for improving
the environment, the effectiveness of administrative
action and the quality of services
• We are not proposing a paradigm or a definition of
«smart city»
• We are measuring – through an original re-evaluation
of a time-honoured survey – the ability of municipal
governments of orienting their actions towards
sustainability and smartness, in a difficult period for
public local financesation
Smart factors and eco-sustainability in urban areas
G.A. Barbieri, A. Ferrara – Scorus 2016
Concluding remarks (1)
29. • The results confirm many known facts:
• Southern towns and cities are weaker than those
in the Centre-North.
• But some results are unexpected:
• Metropolitan cities are not better positioned than
the other cities and towns
• Especially in the South, the cities are not a driver
of social innovation
Smart factors and eco-sustainability in urban areas
G.A. Barbieri, A. Ferrara – Scorus 2016
Concluding remarks (2)
Editor's Notes
The core strategy is related to the technological components to support the improvement of public services
This is particularly evident in the Digital Agenda for Europe that use digital technologies to improve quality of public services for the citizens, better use of resources and less impact on the environment (more eco-friendly impact)
On the contrary, less emphasis is placed on other components of smartness such as governance’s actions
EC launch (2012) the European Innovation Partnership (EIP) on Smart Cities and Communities. It proposes a comprehensive and integrated approach to match policies and resources at EU, national, regional and local levels; the EIP focuses on industry led innovation as a key driver to achieve economic and social change in urban areas
(study commissioned by the European Parliament's Committee on Industry, Research and Energy to provide context for the European Innovation Partnership on Smart Cities and Communities - 2014)
Ends: Giffinger et alii, 2007
Components: T. Nam, T. A.Pardo, 2011