Performance Measurements
ImprovingLatencyandBandwidthofYourDDR4System
Barbara Aichinger
Vice President New Business Development
FuturePlus Systems Corporation
MEMCON 2014
MEMCON 2014
Outline
• Performance measurements or Analytics?
• Events on every cycle @1867MT/s that’s is
~ 1 billion events per second
• Work Harder or Smarter?
• Should we go faster or better use what we
have?
• What should we measure to know if we are
working hard or working smart?
• Power Management, Latency, Bandwidth
• New Metrics
MEMCON 2014
How do I know if I’m working
smart?
• Measure it!
• Power Management, Latency, Bandwidth
• But wait…there’s more!
• Page Hit Analysis
• Multiple Open Banks
• Bank Group Analysis
• Bank Utilization
• Boot Analysis
MEMCON 2014
The Target used
• Asus X99
• DDR4 1867, Crucial/Micron DIMMs 2Rx8 8Gb
• Running Google StressApp memory test
MEMCON 2014
Work Smarter not Harder
• For Performance metrics the DDR Detective® uses
counters instead the traditional trace memory
• To capture a second of DDR4 traffic would take
4.5Gbytes of logic analyzer/protocol analyzer
trace depth $$$$!
• 1 hour = 270 Gbytes of trace depth and then time to
sift through it and post process!
• By using large counters and counting events and
the time between events we can achieve hours
and days worth of metrics with no trace buffer
memory and with no time consuming post
processing
MEMCON 2014
Power Management Metrics
DDR4
• Idle
• Active
• PreCharge Power Down
• Active Power Down
• Self Refresh
• Max Power Down
• DLL Enable
MEMCON 2014
Power Management
whilerunningStressApp
MEMCON 2014
System Idle
MEMCON 2014
Power Management
• ~50M servers Servers World Wide
• Each Server averages 16-24 DIMMs
• 800M to 1.2B DIMMs
• Even a small power savings per DIMM can add up
Every time Facebook’s data center engineers figure out a way to reduce
server consumption by a single watt, the improvement, at Facebook’s scale,
has the potential to add millions of dollars to the company’s bottom line.
Yevgeny Sverdlik
Editor in Chief
Data Center Knowledge
MEMCON 2014
Latency
• Several Jedec Paramters apply:
• RD to WR same rank tSR_RTW
• RD to PRE/PREA same Rank tRTP
• WR to PRE(SB) or PREA (SR) tWR
• Read to Read different Rank tDR_RTR
• Read to Write different Rank DR_RTW
• Write to Read different Rank tDR_WTR
• Write to Write different Rank tDR_WTW
MEMCON 2014
Measure it!
MEMCON 2014
Latency Measurements
V# Parameter Description Spec Measured
V2 tSR_RTW RD to WR same Rank 8 10
V11 tRTP RD to PRE same Rank 8 8
V12 tWR WR to PRE SB or PREA SR 31 31
V53 tDR_RTR RD to RD diff Rank 5 6
V57 tDR_WTR WR to RD diff Rank 3 6
V59 tDR_WTW WR to WR diff Rank 5 8
MEMCON 2014
Intervening Commands
MEMCON 2014
Latency Measurements
V# Parameter Description Spec Measured
V1 tCCD_L RD to RD Same Bank Group 5 6
V3 tCCD_L WR to WR Same Bank Group 5 6
V4 tCCD_S RD to RD diff Bank Group 4 4
V5 tCCD_S WR to WR diff Bank Group 4 4
V6 tRRD_L ACT to ACT Same Bank Group 5 5
V7 tWTR_L ACT to ACT diff Bank Group 4 4
V9 tWTR_L WR to RD Same Bank Group 22 23
V10 tWTR_S WR to RD Diff Bank Group 17 19
MEMCON 2014
Latency
• Good designs operate on the edge of the spec
• Architectural tradeoffs will occur
• Do I need margin?
• Design for the worst case and buy quality parts
MEMCON 2014
Bandwidth
• Overhead
• Any use of the bus other than a Read or a Write
• Command Bus Utilization
• Data Bus
• Utilization: the % of the time that Read or Write
Data is being transferred
• Bandwidth: the amount of data transferred per
second
MEMCON 2014
Command Bus Utilization
MEMCON 2014
DES,REF, ZQCL
MEMCON 2014
Summarize
Command Bus UtilizationACT
4%
PRE
4%
RD
7%
WR
4%
DES
81%
REF
0%
PREA
0%
ZQCS
0%
Command Bus Utilization
MEMCON 2014
Data Bus Utilization
MEMCON 2014
Data Bus Utilization Summary
R0 RD
29%
R0 WR
15%R1 RD
29%
R1 WR
15%
Unused
12%
MEMCON 2014
Data Bus Bandwidth
Mbytestransferredin1second
R0 B0, 414.9314947
R0 B1, 418.2530352
R0 B2,
414.1234536
R0 B3, 419.74852
R0 B4, 414.9671946
R0 B5, 418.4599179
R0 B6, 414.0598119
R0 B7,
419.988012
R0 B8, 412.0611227
R0 B9, 421.3247395
R0 B10, 413.3762158
R0 B11, 419.355695
R0 B12, 412.0412543
R0 B13,
421.2198474
R0 B14, 413.4184754
R0 B15, 419.4291763
Rank 0 Rank 1
R1 B0, 415.6374821
R1 B1, 418.7391466
R1 B2,
415.4724805
R1 B3, 421.2094402
R1 B4, 415.6360314
R1 B5, 418.6608087
R1 B6, 415.408965
R1 B7, 421.1647207R1 B8, 411.2911782
R1 B9, 421.0086126
R1 B10, 414.4347238
R1 B11, 418.7444448
R1 B12, 411.2342224
R1 B13,
420.8987376
R1 B14, 414.5474371
R1 B15, 418.7151785
MEMCON 2014
Total Bandwidth
Unused Mb/Sec,
1637.402656
Total Mb/Sec,
13535.39968
88%
12%
MEMCON 2014
Insight beyond the basics
• Page Hit Analysis
• Read Miss
• Write Miss
• Unused
• Multiple Open Banks
• Open Banks make for faster access if your going
there…performance hit if your not
• Power hit when banks are open
• Bank Group Analysis
• New for DDR4 back to back access to same bank performance
hit
• Faster to go back to back to different bank groups
MEMCON 2014
Page Hit Analysis
MEMCON 2014
Page Hit by percentages
Read Miss
23%
Read Hit
45%
Write Miss
7%
Write Hit
25%
RD/WR Page Hit/Miss
MEMCON 2014
Multiple Open Banks
Howmanyareopenatanyonetime
MEMCON 2014
Bank Group Access Analysis
• tCCD_L
• Takes longer for back to back RD/WR accesses
to the same bank group
• tCCD_S
• Can reduce latency by going to different bank
groups
MEMCON 2014
Bank Group Access Analysis
Relativetotheprevioustransactionhowmanytimesdidthefollowingtransactiongotothe
same/differentbankgroup
MEMCON 2014
Bank Group Access Analysis
byPercentage
RD/RD SBG
2%
WR/WR SBG
2%
RD/RD DBG
66%
WR/WR DBG
30%
MEMCON 2014
But Wait there’s more!
• Bank Utilization
• What happens during a chip kill or page
retirement scenario?
• How does the traffic reallocate?
• What are the performance implications?
• Do I have system hot spots?
• Row Hammer (excessive Activates)
• Fast Boot
• Why does the system take so long to boot?
MEMCON 2014
Bank Utilization
Numberofcyclesthebanksareopen
MEMCON 2014
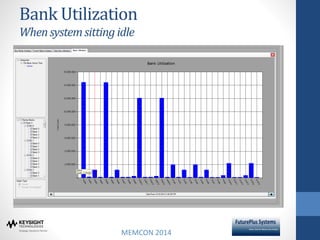
Bank Utilization
Whensystemsitting idle
MEMCON 2014
Boot Analysis
MEMCON 2014
Advancing the State of the Art
• Memory Controller/System Architecture
• Can this insight lead to better designs?
• Dynamic architecture based on workload?
• Which software to run that stresses the system
the best and shows architectural flaws?
(benchmarking)
• Looking for feedback from the industry…we
can test using the DDR Detective®
MEMCON 2014
Summary
• Power Management, Bandwidth, Latency
• NEW Metrics:
• Page Hit Analysis
• Multiple Open Banks
• Bank Group Analysis
• Bank Utilization
• Boot Analysis
• New Measurements give insight into new
designs and better architectures
MEMCON 2014
Contact Information
Barbara Aichinger
Vice President New Business Development
FuturePlus Systems
Barb.Aichinger@FuturePlus.com
www.FuturePlus.com
Check out our new website dedicated to DDR
Memory! www.DDRDetective.com

Performance Measurements: Improving Latency and Bandwidth of your DDR4 System

  • 1.
    Performance Measurements ImprovingLatencyandBandwidthofYourDDR4System Barbara Aichinger VicePresident New Business Development FuturePlus Systems Corporation MEMCON 2014
  • 2.
    MEMCON 2014 Outline • Performancemeasurements or Analytics? • Events on every cycle @1867MT/s that’s is ~ 1 billion events per second • Work Harder or Smarter? • Should we go faster or better use what we have? • What should we measure to know if we are working hard or working smart? • Power Management, Latency, Bandwidth • New Metrics
  • 3.
    MEMCON 2014 How doI know if I’m working smart? • Measure it! • Power Management, Latency, Bandwidth • But wait…there’s more! • Page Hit Analysis • Multiple Open Banks • Bank Group Analysis • Bank Utilization • Boot Analysis
  • 4.
    MEMCON 2014 The Targetused • Asus X99 • DDR4 1867, Crucial/Micron DIMMs 2Rx8 8Gb • Running Google StressApp memory test
  • 5.
    MEMCON 2014 Work Smarternot Harder • For Performance metrics the DDR Detective® uses counters instead the traditional trace memory • To capture a second of DDR4 traffic would take 4.5Gbytes of logic analyzer/protocol analyzer trace depth $$$$! • 1 hour = 270 Gbytes of trace depth and then time to sift through it and post process! • By using large counters and counting events and the time between events we can achieve hours and days worth of metrics with no trace buffer memory and with no time consuming post processing
  • 6.
    MEMCON 2014 Power ManagementMetrics DDR4 • Idle • Active • PreCharge Power Down • Active Power Down • Self Refresh • Max Power Down • DLL Enable
  • 7.
  • 8.
  • 9.
    MEMCON 2014 Power Management •~50M servers Servers World Wide • Each Server averages 16-24 DIMMs • 800M to 1.2B DIMMs • Even a small power savings per DIMM can add up Every time Facebook’s data center engineers figure out a way to reduce server consumption by a single watt, the improvement, at Facebook’s scale, has the potential to add millions of dollars to the company’s bottom line. Yevgeny Sverdlik Editor in Chief Data Center Knowledge
  • 10.
    MEMCON 2014 Latency • SeveralJedec Paramters apply: • RD to WR same rank tSR_RTW • RD to PRE/PREA same Rank tRTP • WR to PRE(SB) or PREA (SR) tWR • Read to Read different Rank tDR_RTR • Read to Write different Rank DR_RTW • Write to Read different Rank tDR_WTR • Write to Write different Rank tDR_WTW
  • 11.
  • 12.
    MEMCON 2014 Latency Measurements V#Parameter Description Spec Measured V2 tSR_RTW RD to WR same Rank 8 10 V11 tRTP RD to PRE same Rank 8 8 V12 tWR WR to PRE SB or PREA SR 31 31 V53 tDR_RTR RD to RD diff Rank 5 6 V57 tDR_WTR WR to RD diff Rank 3 6 V59 tDR_WTW WR to WR diff Rank 5 8
  • 13.
  • 14.
    MEMCON 2014 Latency Measurements V#Parameter Description Spec Measured V1 tCCD_L RD to RD Same Bank Group 5 6 V3 tCCD_L WR to WR Same Bank Group 5 6 V4 tCCD_S RD to RD diff Bank Group 4 4 V5 tCCD_S WR to WR diff Bank Group 4 4 V6 tRRD_L ACT to ACT Same Bank Group 5 5 V7 tWTR_L ACT to ACT diff Bank Group 4 4 V9 tWTR_L WR to RD Same Bank Group 22 23 V10 tWTR_S WR to RD Diff Bank Group 17 19
  • 15.
    MEMCON 2014 Latency • Gooddesigns operate on the edge of the spec • Architectural tradeoffs will occur • Do I need margin? • Design for the worst case and buy quality parts
  • 16.
    MEMCON 2014 Bandwidth • Overhead •Any use of the bus other than a Read or a Write • Command Bus Utilization • Data Bus • Utilization: the % of the time that Read or Write Data is being transferred • Bandwidth: the amount of data transferred per second
  • 17.
  • 18.
  • 19.
    MEMCON 2014 Summarize Command BusUtilizationACT 4% PRE 4% RD 7% WR 4% DES 81% REF 0% PREA 0% ZQCS 0% Command Bus Utilization
  • 20.
  • 21.
    MEMCON 2014 Data BusUtilization Summary R0 RD 29% R0 WR 15%R1 RD 29% R1 WR 15% Unused 12%
  • 22.
    MEMCON 2014 Data BusBandwidth Mbytestransferredin1second R0 B0, 414.9314947 R0 B1, 418.2530352 R0 B2, 414.1234536 R0 B3, 419.74852 R0 B4, 414.9671946 R0 B5, 418.4599179 R0 B6, 414.0598119 R0 B7, 419.988012 R0 B8, 412.0611227 R0 B9, 421.3247395 R0 B10, 413.3762158 R0 B11, 419.355695 R0 B12, 412.0412543 R0 B13, 421.2198474 R0 B14, 413.4184754 R0 B15, 419.4291763 Rank 0 Rank 1 R1 B0, 415.6374821 R1 B1, 418.7391466 R1 B2, 415.4724805 R1 B3, 421.2094402 R1 B4, 415.6360314 R1 B5, 418.6608087 R1 B6, 415.408965 R1 B7, 421.1647207R1 B8, 411.2911782 R1 B9, 421.0086126 R1 B10, 414.4347238 R1 B11, 418.7444448 R1 B12, 411.2342224 R1 B13, 420.8987376 R1 B14, 414.5474371 R1 B15, 418.7151785
  • 23.
    MEMCON 2014 Total Bandwidth UnusedMb/Sec, 1637.402656 Total Mb/Sec, 13535.39968 88% 12%
  • 24.
    MEMCON 2014 Insight beyondthe basics • Page Hit Analysis • Read Miss • Write Miss • Unused • Multiple Open Banks • Open Banks make for faster access if your going there…performance hit if your not • Power hit when banks are open • Bank Group Analysis • New for DDR4 back to back access to same bank performance hit • Faster to go back to back to different bank groups
  • 25.
  • 26.
    MEMCON 2014 Page Hitby percentages Read Miss 23% Read Hit 45% Write Miss 7% Write Hit 25% RD/WR Page Hit/Miss
  • 27.
    MEMCON 2014 Multiple OpenBanks Howmanyareopenatanyonetime
  • 28.
    MEMCON 2014 Bank GroupAccess Analysis • tCCD_L • Takes longer for back to back RD/WR accesses to the same bank group • tCCD_S • Can reduce latency by going to different bank groups
  • 29.
    MEMCON 2014 Bank GroupAccess Analysis Relativetotheprevioustransactionhowmanytimesdidthefollowingtransactiongotothe same/differentbankgroup
  • 30.
    MEMCON 2014 Bank GroupAccess Analysis byPercentage RD/RD SBG 2% WR/WR SBG 2% RD/RD DBG 66% WR/WR DBG 30%
  • 31.
    MEMCON 2014 But Waitthere’s more! • Bank Utilization • What happens during a chip kill or page retirement scenario? • How does the traffic reallocate? • What are the performance implications? • Do I have system hot spots? • Row Hammer (excessive Activates) • Fast Boot • Why does the system take so long to boot?
  • 32.
  • 33.
  • 34.
  • 35.
    MEMCON 2014 Advancing theState of the Art • Memory Controller/System Architecture • Can this insight lead to better designs? • Dynamic architecture based on workload? • Which software to run that stresses the system the best and shows architectural flaws? (benchmarking) • Looking for feedback from the industry…we can test using the DDR Detective®
  • 36.
    MEMCON 2014 Summary • PowerManagement, Bandwidth, Latency • NEW Metrics: • Page Hit Analysis • Multiple Open Banks • Bank Group Analysis • Bank Utilization • Boot Analysis • New Measurements give insight into new designs and better architectures
  • 37.
    MEMCON 2014 Contact Information BarbaraAichinger Vice President New Business Development FuturePlus Systems Barb.Aichinger@FuturePlus.com www.FuturePlus.com Check out our new website dedicated to DDR Memory! www.DDRDetective.com