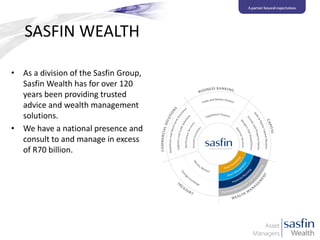
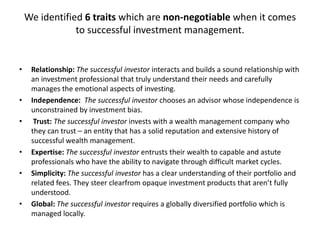
SENATE CONFERENCE 2013
SASFIN WEALTH
• As a division of the Sasfin Group,
Sasfin Wealth has for over 120
years been providing trusted
advice and wealth management
solutions.
• We have a national presence and
consult to and manage in excess
of R70 billion.
FOOTPRINT
Hong Kong
Pretoria
Johannesburg
Bloemfontein

Durban

Port Elizabeth

Cape Town
George
Investment team
Investment Process
Competitive advantage
•
•
•
•
•

Experienced investment team
Superior ability to read markets
Adaptive investment style
High conviction
We optimise risk adjusted returns by consistently adding increments
of return
Awards
2012: Raging Bull
broad-based Domestic Equity Fund on a straight performance basis, being the
• Best with the highest Profile Data total investment return ranking over three years in
fund
the ASISA Domestic Equity General, Value and Growth sectors
2012: Raging Bull
• Best Domestic Equity Value Fund
Sasfin Securities
• Our heritage dates back to 1890 when Otto Pollock became a
member of the JSE.
• Today we have in excess of R60 billion of assets under
administration which makes us one of the largest and most
experienced private client stockbroking businesses in South
Africa.
• We pride ourselves on our ability to offer truly bespoke
investment solutions both locally and internationally, coupled
with uncompromising levels of client support.
We identified 6 traits which are non-negotiable when it comes
to successful investment management.

•

•

•

•
•

•

Relationship: The successful investor interacts and builds a sound relationship with
an investment professional that truly understand their needs and carefully
manages the emotional aspects of investing.
Independence: The successful investor chooses an advisor whose independence is
unconstrained by investment bias.
Trust: The successful investor invests with a wealth management company who
they can trust – an entity that has a solid reputation and extensive history of
successful wealth management.
Expertise: The successful investor entrusts their wealth to capable and astute
professionals who have the ability to navigate through difficult market cycles.
Simplicity: The successful investor has a clear understanding of their portfolio and
related fees. They steer clearfrom opaque investment products that aren’t fully
understood.
Global: The successful investor requires a globally diversified portfolio which is
managed locally.
Offering
•
•
•
•
•

Full Discretion: Sasfin assumes full responsibility for the management of the
underlying portfolio.
Referral managed: Sasfin advises on the underlying securities while the client is
ultimately the decision maker.
Deal & Execution: Our clients will be required to formulate and implement their
own investment strategy.
Offshore: Our global trading platforms and international research allow us to think
globally while executing locally.
Personalised share portfolio: We manage your client’s compulsory and voluntary
money in a tax effective manner.
Foundation Portfolios
• Foundation Fund Fact Sheets
• Client proposal
Our offering is available through:
•
•
•
•

Glacier & Glacier International (Sanlam)
Investec
Momentum
Old Mutual International.
Thank You
DISCLAIMER
•
•
•

This presentation has been compiled by Sasfin Financial Advisory Services (Pty) Ltd - Co. No.1997/010819/07; a
licensed Financial Services Provider - FSP No. 5711 (use the one or other as appropriate)
Sasfin Asset Managers (Pty) Ltd - Co. No. 2007/018275/07; a licensed Financial Services Provider - FSP No. 21664
in the context of the services it provides. The contents are proprietary and may not be copied or disclosed
without consent. Information and opinions are general and subjective in nature and do not constitute
advice. Any references to historical data, assumptions, targets, benchmarks or examples are as indicators /
illustrations only and are not fixed or guaranteed. Past investment performance is not necessarily indicative of
future performance. While care is taken to provide current and accurate information, no liability is accepted for
errors, omissions or subsequent changes and this presentation remains subject to revision, verification and
amendment without notice and without liability to compensate or reimburse any party. Anyone acting on this
presentation before taking appropriate advice does so at their own risk
World Markets

Balancing the risks
Shut happens!


Past few weeks underscored by the debt ceiling debate,
improving economic numbers and talk of tapering



Tea Party echoing same thinking Republican moderates have
expressed for years, except at higher volume
Abhorrence of ObamaCare, loathing of government, faith in tax cuts and
free market etc.



Tactics nearly forced US default



Caused grievous harm to Republican brand – 53% of
Americans blamed Republicans versus 29% Obama



Damaged Republicans’ business leaning image



Sequester lowered growth – Grand Bargain on spending
cuts sought



Shutdown and debt ceiling protests hurt business
confidence – cost of shutdown estimated at $24bn



Tapering delay until there is clear evidence that the economic
recovery is on a sustainable path

20
US economy – chugging along


Employment rising
24 months of successive job increases
Oct job numbers well ahead of consensus



Housing recovering
New houses sold double 2011 lows



Retail spending improving
Above pre-crash levels



Trade balance shrinking
Half ‘08 highs of -$70bn



Budget deficit falling
An increased level of tax receipts and lower government spending



Oil & gas production exploding
US fastest growing producer in 2012 lifting output by 1m barrels per day to 8.9m



Lower birth rate projections, aging work force and slowing productivity
Gains likely to reduce GDP to 1.9% between 2012 and 2032 from post-war average of 3.5%
21
S&P500
1990 - 2000
Tech revolution
Globalisation
Cell phone
Internet

2000 - 2010
GFC (Collapse of Lehman)
China emerges
9/11 crisis

2010 - 2020
End of commodity super cycle
Shale, oil, gas revolution
IT & communication transformation
3D printing, big data
Aging demographics: US, Japan, China, Europe

22
What the Frack ?
Hydraulic Fracturing

24
The Natural Gas Revolution
 Fracking has allowed energy companies to dig deeper than
before unlocking unconventional oil deposits

Crude Oil net Imports

 North America has largest stores of unconventional oil
50% more than total conventional crude in the Middle East
 US could overtake Saudi Arabia as the world’s largest oil
producer by 2020

Crude Oil net Exports

 Making it less dependent on oil from foreign nations whose
interests conflict with theirs
 Imports are down to 40% from 60% in 2005

25
The Natural Gas Revolution
 Fracking has produced an abundance of inexpensive natural gas

 Natural gas used to power ships, trains, heavy goods vehicles and
power stations

 Natural gas power stations have half the emissions of conventional BNSF carry 650k barrels
coal plants
a day, soon to increase to
Emissions fallen 12% since 2007 on conversions
750k barrels a day, will
 Boom in oil and gas drilling creating jobs in states hard hit by
recession

eventually reach over 1m
barrels a day

 Cheaper energy input costs attracting manufacturing back to the US
1m manufacturing jobs could be added by 2025

 Plentiful oil will diminish incentives to reduce reliance on fossil fuels
26
Global Economy
Size of economy
US

21.6%

China

10.4%

EU

26%

Japan

8.4%

Brazil

3.6%

UK

3.5%

Russia

2.6%

Est. growth 2014
China

8.2%

India

6.2%

Russia

3.8%

Brazil

4%

US

3%

Australia

3%

UK

1.5%

Europe

1.1%

World

4.00%

Emerging Regions

5.70%

Advanced Economies

2.20%
Europe’s deficit problem

28
Europe: signs of economic recovery are visible


Recovery still fragile – deflation becoming the biggest danger



Euro zone expected to
expand by 1.2%

Forecast growth for 2014 at 0.5%
Short of the pace needed to head off deflation & address the on-going debt crisis



Germany and France slowing but Italy and Spain performing better



Spain, Italy & Portugal also showing economic gains
Spain out of recession, growing at 0.1% in Q3



EU needs to increase growth potential, enhance job creation &
boost European competitiveness



The origins of the disaster lies with excessive private borrowing



Euro zone blighted
Greece got into trouble because its government spent too much anddebt even more thanby private
Govt debt
collected too little in taxes



The bust followed a private sector binge: mortgage debt in Ireland
and Spain, corporate borrowing in Portugal and Spain



Without growth, zombie firms are unable to invest or grow
Much like those wafting through Japan in the 1990s
29
UK: economy accelerates to fastest growth since 2010


UK economy growing at its fastest rate in 6 years



Unemployment at 3 year low



Recovery beginning to take hold



2013 growth upgraded to 1.6% from 1.4%



Forecast growth 2.8% for 2014



Interest rates could begin rising sometime in 2015, once
employment falls to 7%



“The economy is growing
robustly as lifting uncertainty &
thawing credit conditions start
to unlock pent up demand”
Mark Carney
Governor BOE / Chairman MPC

Unlikely that the recovery will fade significantly:
- Revival of the British housing market
- Youth unemployment falling
- Confidence returning
- Obstacles home and abroad remain
30
Japan: “Abenomics” a mix designed to jolt the economy

CPI
Japan’s economy will remain on track as the
government prepares a 5 trillion yen ($50.6bn)
stimulus package to offset the drag from a sales
tax increase scheduled for next April.
Economists expect the majority of the stimulus
package to be spent on infrastructure and tax
breaks for the corporate sector.

Reuters

31
Electrifying a nation that had lost faith in its political class

Nikkei
Japan’s economy recovering at moderate pace
despite slowing exports
Imports likely to remain strong due to solid
domestic demand, while business sentiment is
improving
Emerging Markets continue to disappoint


China grows at the slowest pace in 13 years



Indian Rupee falls to record lows – rates rising to stem outflows



Brazil’s fundamentals deteriorate on incoherent economic policy



Russia down on falling energy prices and tight corporate credit



Investors continue to withdraw from emerging markets even in the
face of Fed tapering talk

33
S&P500 vs MSCI Emerging Markets Index
Emerging Markets
Developed Markets

“Investors looking for
emerging market-like growth
rates should look to the US”
Meredith Whitney
China’s tectonic shift – the dawn of a new era


New regime acting more carefully, balancing growth, shifting
from a production oriented economy to one centred around
household consumption



Third Plenum:
Supported land reform, fiscal reform and judicial system
Disappointed on financial liberalisation, one-child policy & residency reform




Demand slowly recovering, expect growth around 7.5%
Structural reforms designed to improve the supply side of the •
economy



Reforms would help sustain the growth of productive capacity, •
improving the allocation of capital and labour



Cutting red tape and other regulatory barriers to entry would
help private firms invest in industries now dominated by state- •
owned enterprises

Consumption expected to overtake investment as the largest contributor to GDP
Investment
42% (2010 – 2020)
34% (2020 – 2030)

41% (2010 – 2020)
51% (2020 – 2030)

+ 24%

Household consumption
accounts for 38% of GDP
(US ~70%)
World’s largest car market,
19.3m cars sold in 2012

•

Largest internet market in
the world

•

Reduced the per-watt cost of
solar power from over $3
(2008) to under $1 (2011)

Consumption

- 23%

Home to 20% of the world’s
population
China’s growing middle class is demanding more
Western brands sell a lifestyle / image aiming
to attract the aspirant Chinese consumer

McDonalds

Haagan-Dazs

Nike
Adidas

Starbucks

Paul Frank
South Africa


Widespread labour unrest disrupting mining and manufacturing output



Falling commodity prices putting pressure on mine earnings



Rising input costs, electricity constraints, squeezing manufacturing
margins



Slowdown in household spending



Continued shift in fiscal policy to social spending from infrastructure



Corruption, poor skills, inefficiency
WEC ranks SA’s education system 146 out of 148 countries and last in Maths & Science



Hesitant domestic and foreign investor confidence



Pessimism about the long term outlook for the economy



Debt downgrade possible if deficits continue to deteriorate

37
JSE trading at all time highs
Breakdown of the JSE: +23% from 1st Nov 2012
The top 15 companies make up over 70% of the JSE (12 month return)
Market cap (ZAR)
1.1 tr

British Am Tobacco

25%

SABMiller

859 bn

Billiton

655 bn

Richemont

536 bn

Naspers

385 bn

69%

MTN

368 bn

29%

Anglo American

335 bn

-11%

Sasol

328 bn

37%

Standard Bank

203 bn

19%

Firstrand

202 bn

29%

41%
12%
85%

Vodacom

172 bn
158 bn
137 bn
129 bn

Pick ‘n Pay

23bn

Telkom

14bn

Adcock

12bn

JD Group

-21%

Barclarys

Market Cap

36%

Kumba Iron Ore

Market cap: R714bn

9%

Old Mutual

Xstrata/Glencore

7bn

9%

124 bn 75%

Aspen
0

200000

400000

600000

800000

1000000

1200000
Local Investment Ideas: Stick with the winners
Companies expanding offshore into high growth regions
Naspers, Aspen, Bidvest, BHP Billiton, Sasol, Glencore

Emerging market consumption growth
SABMiller, British American Tobacco, Richemont

Superior retail business models continue to hold
Famous Brands, Woolworths, Mr Price

Expansion into Africa
Imperial, MTN, Omnia, Shoprite

Expanding middle class exploring medicare options
Life Healthcare, Mediclinic, Discovery

40
JSE is more of a convenience store than a supermarket

JSE

Global Markets

41
Create a champions league portfolio

JSE

Global Markets

42
A guideline to our team’s offshore investment ideas

Escalating prosperity in developing nations
LVMH, Daimler, Prada, BMW

Increasing urbanisation
L’Oreal, Altria, Anheuser-Busch InBev

Competitive companies focusing on the consumer
Nestle, Unilever, Adidas, J&J

High yield in a low yielding environment
Royal Dutch Shell, AstraZeneca, Sanofi, Allianz, Vodafone

America: The next emerging market
General Electric, Wells Fargo, JPMorgan, Berkshire Hathaway

IT: Tech players transforming our lives
Google, Amazon, Microsoft

43
Thank You

David Shapiro

Kavita Patel

Craig Diesel

Carmen Solomons

Deputy Chairman / Director
david.shapiro@sasfin.com

Portfolio Manager
kavita.patel@sasfin.com

Portfolio Manager
craig.diesel@sasfin.com

Portfolio Assistant
44
carmen.solomons@sasfin.com

Sasfin Securities; Balancing the risks & global economic outlook; Nov 2013

  • 1.
  • 2.
    SASFIN WEALTH • Asa division of the Sasfin Group, Sasfin Wealth has for over 120 years been providing trusted advice and wealth management solutions. • We have a national presence and consult to and manage in excess of R70 billion.
  • 3.
  • 4.
  • 5.
  • 6.
    Competitive advantage • • • • • Experienced investmentteam Superior ability to read markets Adaptive investment style High conviction We optimise risk adjusted returns by consistently adding increments of return
  • 7.
    Awards 2012: Raging Bull broad-basedDomestic Equity Fund on a straight performance basis, being the • Best with the highest Profile Data total investment return ranking over three years in fund the ASISA Domestic Equity General, Value and Growth sectors 2012: Raging Bull • Best Domestic Equity Value Fund
  • 12.
    Sasfin Securities • Ourheritage dates back to 1890 when Otto Pollock became a member of the JSE. • Today we have in excess of R60 billion of assets under administration which makes us one of the largest and most experienced private client stockbroking businesses in South Africa. • We pride ourselves on our ability to offer truly bespoke investment solutions both locally and internationally, coupled with uncompromising levels of client support.
  • 13.
    We identified 6traits which are non-negotiable when it comes to successful investment management. • • • • • • Relationship: The successful investor interacts and builds a sound relationship with an investment professional that truly understand their needs and carefully manages the emotional aspects of investing. Independence: The successful investor chooses an advisor whose independence is unconstrained by investment bias. Trust: The successful investor invests with a wealth management company who they can trust – an entity that has a solid reputation and extensive history of successful wealth management. Expertise: The successful investor entrusts their wealth to capable and astute professionals who have the ability to navigate through difficult market cycles. Simplicity: The successful investor has a clear understanding of their portfolio and related fees. They steer clearfrom opaque investment products that aren’t fully understood. Global: The successful investor requires a globally diversified portfolio which is managed locally.
  • 14.
    Offering • • • • • Full Discretion: Sasfinassumes full responsibility for the management of the underlying portfolio. Referral managed: Sasfin advises on the underlying securities while the client is ultimately the decision maker. Deal & Execution: Our clients will be required to formulate and implement their own investment strategy. Offshore: Our global trading platforms and international research allow us to think globally while executing locally. Personalised share portfolio: We manage your client’s compulsory and voluntary money in a tax effective manner.
  • 15.
    Foundation Portfolios • FoundationFund Fact Sheets • Client proposal
  • 16.
    Our offering isavailable through: • • • • Glacier & Glacier International (Sanlam) Investec Momentum Old Mutual International.
  • 17.
  • 18.
    DISCLAIMER • • • This presentation hasbeen compiled by Sasfin Financial Advisory Services (Pty) Ltd - Co. No.1997/010819/07; a licensed Financial Services Provider - FSP No. 5711 (use the one or other as appropriate) Sasfin Asset Managers (Pty) Ltd - Co. No. 2007/018275/07; a licensed Financial Services Provider - FSP No. 21664 in the context of the services it provides. The contents are proprietary and may not be copied or disclosed without consent. Information and opinions are general and subjective in nature and do not constitute advice. Any references to historical data, assumptions, targets, benchmarks or examples are as indicators / illustrations only and are not fixed or guaranteed. Past investment performance is not necessarily indicative of future performance. While care is taken to provide current and accurate information, no liability is accepted for errors, omissions or subsequent changes and this presentation remains subject to revision, verification and amendment without notice and without liability to compensate or reimburse any party. Anyone acting on this presentation before taking appropriate advice does so at their own risk
  • 19.
  • 20.
    Shut happens!  Past fewweeks underscored by the debt ceiling debate, improving economic numbers and talk of tapering  Tea Party echoing same thinking Republican moderates have expressed for years, except at higher volume Abhorrence of ObamaCare, loathing of government, faith in tax cuts and free market etc.  Tactics nearly forced US default  Caused grievous harm to Republican brand – 53% of Americans blamed Republicans versus 29% Obama  Damaged Republicans’ business leaning image  Sequester lowered growth – Grand Bargain on spending cuts sought  Shutdown and debt ceiling protests hurt business confidence – cost of shutdown estimated at $24bn  Tapering delay until there is clear evidence that the economic recovery is on a sustainable path 20
  • 21.
    US economy –chugging along  Employment rising 24 months of successive job increases Oct job numbers well ahead of consensus  Housing recovering New houses sold double 2011 lows  Retail spending improving Above pre-crash levels  Trade balance shrinking Half ‘08 highs of -$70bn  Budget deficit falling An increased level of tax receipts and lower government spending  Oil & gas production exploding US fastest growing producer in 2012 lifting output by 1m barrels per day to 8.9m  Lower birth rate projections, aging work force and slowing productivity Gains likely to reduce GDP to 1.9% between 2012 and 2032 from post-war average of 3.5% 21
  • 22.
    S&P500 1990 - 2000 Techrevolution Globalisation Cell phone Internet 2000 - 2010 GFC (Collapse of Lehman) China emerges 9/11 crisis 2010 - 2020 End of commodity super cycle Shale, oil, gas revolution IT & communication transformation 3D printing, big data Aging demographics: US, Japan, China, Europe 22
  • 23.
  • 24.
  • 25.
    The Natural GasRevolution  Fracking has allowed energy companies to dig deeper than before unlocking unconventional oil deposits Crude Oil net Imports  North America has largest stores of unconventional oil 50% more than total conventional crude in the Middle East  US could overtake Saudi Arabia as the world’s largest oil producer by 2020 Crude Oil net Exports  Making it less dependent on oil from foreign nations whose interests conflict with theirs  Imports are down to 40% from 60% in 2005 25
  • 26.
    The Natural GasRevolution  Fracking has produced an abundance of inexpensive natural gas  Natural gas used to power ships, trains, heavy goods vehicles and power stations  Natural gas power stations have half the emissions of conventional BNSF carry 650k barrels coal plants a day, soon to increase to Emissions fallen 12% since 2007 on conversions 750k barrels a day, will  Boom in oil and gas drilling creating jobs in states hard hit by recession eventually reach over 1m barrels a day  Cheaper energy input costs attracting manufacturing back to the US 1m manufacturing jobs could be added by 2025  Plentiful oil will diminish incentives to reduce reliance on fossil fuels 26
  • 27.
    Global Economy Size ofeconomy US 21.6% China 10.4% EU 26% Japan 8.4% Brazil 3.6% UK 3.5% Russia 2.6% Est. growth 2014 China 8.2% India 6.2% Russia 3.8% Brazil 4% US 3% Australia 3% UK 1.5% Europe 1.1% World 4.00% Emerging Regions 5.70% Advanced Economies 2.20%
  • 28.
  • 29.
    Europe: signs ofeconomic recovery are visible  Recovery still fragile – deflation becoming the biggest danger  Euro zone expected to expand by 1.2% Forecast growth for 2014 at 0.5% Short of the pace needed to head off deflation & address the on-going debt crisis  Germany and France slowing but Italy and Spain performing better  Spain, Italy & Portugal also showing economic gains Spain out of recession, growing at 0.1% in Q3  EU needs to increase growth potential, enhance job creation & boost European competitiveness  The origins of the disaster lies with excessive private borrowing  Euro zone blighted Greece got into trouble because its government spent too much anddebt even more thanby private Govt debt collected too little in taxes  The bust followed a private sector binge: mortgage debt in Ireland and Spain, corporate borrowing in Portugal and Spain  Without growth, zombie firms are unable to invest or grow Much like those wafting through Japan in the 1990s 29
  • 30.
    UK: economy acceleratesto fastest growth since 2010  UK economy growing at its fastest rate in 6 years  Unemployment at 3 year low  Recovery beginning to take hold  2013 growth upgraded to 1.6% from 1.4%  Forecast growth 2.8% for 2014  Interest rates could begin rising sometime in 2015, once employment falls to 7%  “The economy is growing robustly as lifting uncertainty & thawing credit conditions start to unlock pent up demand” Mark Carney Governor BOE / Chairman MPC Unlikely that the recovery will fade significantly: - Revival of the British housing market - Youth unemployment falling - Confidence returning - Obstacles home and abroad remain 30
  • 31.
    Japan: “Abenomics” amix designed to jolt the economy CPI Japan’s economy will remain on track as the government prepares a 5 trillion yen ($50.6bn) stimulus package to offset the drag from a sales tax increase scheduled for next April. Economists expect the majority of the stimulus package to be spent on infrastructure and tax breaks for the corporate sector. Reuters 31
  • 32.
    Electrifying a nationthat had lost faith in its political class Nikkei Japan’s economy recovering at moderate pace despite slowing exports Imports likely to remain strong due to solid domestic demand, while business sentiment is improving
  • 33.
    Emerging Markets continueto disappoint  China grows at the slowest pace in 13 years  Indian Rupee falls to record lows – rates rising to stem outflows  Brazil’s fundamentals deteriorate on incoherent economic policy  Russia down on falling energy prices and tight corporate credit  Investors continue to withdraw from emerging markets even in the face of Fed tapering talk 33
  • 34.
    S&P500 vs MSCIEmerging Markets Index Emerging Markets Developed Markets “Investors looking for emerging market-like growth rates should look to the US” Meredith Whitney
  • 35.
    China’s tectonic shift– the dawn of a new era  New regime acting more carefully, balancing growth, shifting from a production oriented economy to one centred around household consumption  Third Plenum: Supported land reform, fiscal reform and judicial system Disappointed on financial liberalisation, one-child policy & residency reform   Demand slowly recovering, expect growth around 7.5% Structural reforms designed to improve the supply side of the • economy  Reforms would help sustain the growth of productive capacity, • improving the allocation of capital and labour  Cutting red tape and other regulatory barriers to entry would help private firms invest in industries now dominated by state- • owned enterprises Consumption expected to overtake investment as the largest contributor to GDP Investment 42% (2010 – 2020) 34% (2020 – 2030) 41% (2010 – 2020) 51% (2020 – 2030) + 24% Household consumption accounts for 38% of GDP (US ~70%) World’s largest car market, 19.3m cars sold in 2012 • Largest internet market in the world • Reduced the per-watt cost of solar power from over $3 (2008) to under $1 (2011) Consumption - 23% Home to 20% of the world’s population
  • 36.
    China’s growing middleclass is demanding more Western brands sell a lifestyle / image aiming to attract the aspirant Chinese consumer McDonalds Haagan-Dazs Nike Adidas Starbucks Paul Frank
  • 37.
    South Africa  Widespread labourunrest disrupting mining and manufacturing output  Falling commodity prices putting pressure on mine earnings  Rising input costs, electricity constraints, squeezing manufacturing margins  Slowdown in household spending  Continued shift in fiscal policy to social spending from infrastructure  Corruption, poor skills, inefficiency WEC ranks SA’s education system 146 out of 148 countries and last in Maths & Science  Hesitant domestic and foreign investor confidence  Pessimism about the long term outlook for the economy  Debt downgrade possible if deficits continue to deteriorate 37
  • 38.
    JSE trading atall time highs
  • 39.
    Breakdown of theJSE: +23% from 1st Nov 2012 The top 15 companies make up over 70% of the JSE (12 month return) Market cap (ZAR) 1.1 tr British Am Tobacco 25% SABMiller 859 bn Billiton 655 bn Richemont 536 bn Naspers 385 bn 69% MTN 368 bn 29% Anglo American 335 bn -11% Sasol 328 bn 37% Standard Bank 203 bn 19% Firstrand 202 bn 29% 41% 12% 85% Vodacom 172 bn 158 bn 137 bn 129 bn Pick ‘n Pay 23bn Telkom 14bn Adcock 12bn JD Group -21% Barclarys Market Cap 36% Kumba Iron Ore Market cap: R714bn 9% Old Mutual Xstrata/Glencore 7bn 9% 124 bn 75% Aspen 0 200000 400000 600000 800000 1000000 1200000
  • 40.
    Local Investment Ideas:Stick with the winners Companies expanding offshore into high growth regions Naspers, Aspen, Bidvest, BHP Billiton, Sasol, Glencore Emerging market consumption growth SABMiller, British American Tobacco, Richemont Superior retail business models continue to hold Famous Brands, Woolworths, Mr Price Expansion into Africa Imperial, MTN, Omnia, Shoprite Expanding middle class exploring medicare options Life Healthcare, Mediclinic, Discovery 40
  • 41.
    JSE is moreof a convenience store than a supermarket JSE Global Markets 41
  • 42.
    Create a championsleague portfolio JSE Global Markets 42
  • 43.
    A guideline toour team’s offshore investment ideas Escalating prosperity in developing nations LVMH, Daimler, Prada, BMW Increasing urbanisation L’Oreal, Altria, Anheuser-Busch InBev Competitive companies focusing on the consumer Nestle, Unilever, Adidas, J&J High yield in a low yielding environment Royal Dutch Shell, AstraZeneca, Sanofi, Allianz, Vodafone America: The next emerging market General Electric, Wells Fargo, JPMorgan, Berkshire Hathaway IT: Tech players transforming our lives Google, Amazon, Microsoft 43
  • 44.
    Thank You David Shapiro KavitaPatel Craig Diesel Carmen Solomons Deputy Chairman / Director david.shapiro@sasfin.com Portfolio Manager kavita.patel@sasfin.com Portfolio Manager craig.diesel@sasfin.com Portfolio Assistant 44 carmen.solomons@sasfin.com