This document introduces backpropagation, which is the core optimization process in deep neural networks. It summarizes backpropagation for both the output layer and hidden layers. For the output layer, the update rule for a single weight is given by uij ← uij - ηδjhi, where δj = (yj - tj)yj(1-yj). For the hidden layer, the update rule is more complex, with ∂L/∂wij = Σk(yk - tk)yk(1-yk)ujkhj(1-hj)xi. Finally, it provides a generalized backpropagation formula that combines these rules for both layers as ∂L
This presentation begins with explaining the basic algorithms of machine learning and using the same concepts, discusses in detail 2 supervised learning/deep learning algorithms - Artificial neural nets and Convolutional Neural Nets. The relationship between Artificial neural nets and basic machine learning algorithms such as logistic regression and soft max is also explored. For hands on the implementation of ANN's and CNN's on MNIST dataset is also explained.
SAMPLE QUESTIONExercise 1 Consider the functionf (x,C).docxanhlodge
SAMPLE QUESTION:
Exercise 1: Consider the function
f (x,C)=
sin(C x)
Cx
(a) Create a vector x with 100 elements from -3*pi to 3*pi. Write f as an inline or anonymous function
and generate the vectors y1 = f(x,C1), y2 = f(x,C2) and y3 = f(x,C3), where C1 = 1, C2 = 2 and
C3 = 3. Make sure you suppress the output of x and y's vectors. Plot the function f (for the three
C's above), name the axis, give a title to the plot and include a legend to identify the plots. Add a
grid to the plot.
(b) Without using inline or anonymous functions write a function+function structure m-file that does
the same job as in part (a)
SAMPLE LAB WRITEUP:
MAT 275 MATLAB LAB 1 NAME: __________________________
LAB DAY and TIME:______________
Instructor: _______________________
Exercise 1
(a)
x = linspace(-3*pi,3*pi); % generating x vector - default value for number
% of pts linspace is 100
f= @(x,C) sin(C*x)./(C*x) % C will be just a constant, no need for ".*"
C1 = 1, C2 = 2, C3 = 3 % Using commans to separate commands
y1 = f(x,C1); y2 = f(x,C2); y3 = f(x,C3); % supressing the y's
plot(x,y1,'b.-', x,y2,'ro-', x,y3,'ks-') % using different markers for
% black and white plots
xlabel('x'), ylabel('y') % labeling the axis
title('f(x,C) = sin(Cx)/(Cx)') % adding a title
legend('C = 1','C = 2','C = 3') % adding a legend
grid on
Command window output:
f =
@(x,C)sin(C*x)./(C*x)
C1 =
1
C2 =
2
C3 =
3
(b)
M-file of structure function+function
function ex1
x = linspace(-3*pi,3*pi); % generating x vector - default value for number
% of pts linspace is 100
C1 = 1, C2 = 2, C3 = 3 % Using commans to separate commands
y1 = f(x,C1); y2 = f(x,C2); y3 = f(x,C3); % function f is defined below
plot(x,y1,'b.-', x,y2,'ro-', x,y3,'ks-') % using different markers for
% black and white plots
xlabel('x'), ylabel('y') % labeling the axis
title('f(x,C) = sin(Cx)/(Cx)') % adding a title
legend('C = 1','C = 2','C = 3') % adding a legend
grid on
end
function y = f(x,C)
y = sin(C*x)./(C*x);
end
Command window output:
C1 =
1
C2 =
2
C3 =
3
More instructions for the lab write-up:
1) You are not obligated to use the 'diary' function. It was presented only for you convenience. You
should be copying and pasting your code, plots, and results into some sort of "Word" type editor that
will allow you to import graphs and such. Make sure you always include the commands to generate
what is been asked and include the outputs (from command window and plots), unless the pr.
the slides are aimed to give a brief introductory base to Neural Networks and its architectures. it covers logistic regression, shallow neural networks and deep neural networks. the slides were presented in Deep Learning IndabaX Sudan.
My paper for Domain Decomposition Conference in Strobl, Austria, 2005Alexander Litvinenko
We did a first step in solving, so-called, skin problem. We developed an efficient H-matrix preconditioner to solve diffusion problem with jumping coefficients
Recursive Formulation of Gradient in a Dense Feed-Forward Deep Neural NetworkAshwin Rao
Recursive Formulation of Gradient in a Dense Feed-Forward Deep Neural Network. Derived for a fairly general setting where the supervisory variable has a conditional probability density modeled as an arbitrary Generalized Linear Model's "normal-form" probability density, and whose output layer activation function is the GLM canonical link function.
The slide covers the basic concepts and designs of artificial neural networks. It explains and justifies the use of McCulloh Pitts Model, Adaline network, Perceptron algorithm, Backpropagation algorithm, Hopfield network and Kohonen network; along with its practical applications.
Deep neural networks & computational graphsRevanth Kumar
To improve the performance of a Deep Learning model. The goal is to reduce the optimization function which can be divided based on the classification and the regression problems.
This pdf is about the Schizophrenia.
For more details visit on YouTube; @SELF-EXPLANATORY;
https://www.youtube.com/channel/UCAiarMZDNhe1A3Rnpr_WkzA/videos
Thanks...!
More Related Content
Similar to Backpropagation - A peek into the Mathematics of optimization.pdf
My paper for Domain Decomposition Conference in Strobl, Austria, 2005Alexander Litvinenko
We did a first step in solving, so-called, skin problem. We developed an efficient H-matrix preconditioner to solve diffusion problem with jumping coefficients
Recursive Formulation of Gradient in a Dense Feed-Forward Deep Neural NetworkAshwin Rao
Recursive Formulation of Gradient in a Dense Feed-Forward Deep Neural Network. Derived for a fairly general setting where the supervisory variable has a conditional probability density modeled as an arbitrary Generalized Linear Model's "normal-form" probability density, and whose output layer activation function is the GLM canonical link function.
The slide covers the basic concepts and designs of artificial neural networks. It explains and justifies the use of McCulloh Pitts Model, Adaline network, Perceptron algorithm, Backpropagation algorithm, Hopfield network and Kohonen network; along with its practical applications.
Deep neural networks & computational graphsRevanth Kumar
To improve the performance of a Deep Learning model. The goal is to reduce the optimization function which can be divided based on the classification and the regression problems.
This pdf is about the Schizophrenia.
For more details visit on YouTube; @SELF-EXPLANATORY;
https://www.youtube.com/channel/UCAiarMZDNhe1A3Rnpr_WkzA/videos
Thanks...!
Cancer cell metabolism: special Reference to Lactate PathwayAADYARAJPANDEY1
Normal Cell Metabolism:
Cellular respiration describes the series of steps that cells use to break down sugar and other chemicals to get the energy we need to function.
Energy is stored in the bonds of glucose and when glucose is broken down, much of that energy is released.
Cell utilize energy in the form of ATP.
The first step of respiration is called glycolysis. In a series of steps, glycolysis breaks glucose into two smaller molecules - a chemical called pyruvate. A small amount of ATP is formed during this process.
Most healthy cells continue the breakdown in a second process, called the Kreb's cycle. The Kreb's cycle allows cells to “burn” the pyruvates made in glycolysis to get more ATP.
The last step in the breakdown of glucose is called oxidative phosphorylation (Ox-Phos).
It takes place in specialized cell structures called mitochondria. This process produces a large amount of ATP. Importantly, cells need oxygen to complete oxidative phosphorylation.
If a cell completes only glycolysis, only 2 molecules of ATP are made per glucose. However, if the cell completes the entire respiration process (glycolysis - Kreb's - oxidative phosphorylation), about 36 molecules of ATP are created, giving it much more energy to use.
IN CANCER CELL:
Unlike healthy cells that "burn" the entire molecule of sugar to capture a large amount of energy as ATP, cancer cells are wasteful.
Cancer cells only partially break down sugar molecules. They overuse the first step of respiration, glycolysis. They frequently do not complete the second step, oxidative phosphorylation.
This results in only 2 molecules of ATP per each glucose molecule instead of the 36 or so ATPs healthy cells gain. As a result, cancer cells need to use a lot more sugar molecules to get enough energy to survive.
introduction to WARBERG PHENOMENA:
WARBURG EFFECT Usually, cancer cells are highly glycolytic (glucose addiction) and take up more glucose than do normal cells from outside.
Otto Heinrich Warburg (; 8 October 1883 – 1 August 1970) In 1931 was awarded the Nobel Prize in Physiology for his "discovery of the nature and mode of action of the respiratory enzyme.
WARNBURG EFFECT : cancer cells under aerobic (well-oxygenated) conditions to metabolize glucose to lactate (aerobic glycolysis) is known as the Warburg effect. Warburg made the observation that tumor slices consume glucose and secrete lactate at a higher rate than normal tissues.
Richard's aventures in two entangled wonderlandsRichard Gill
Since the loophole-free Bell experiments of 2020 and the Nobel prizes in physics of 2022, critics of Bell's work have retreated to the fortress of super-determinism. Now, super-determinism is a derogatory word - it just means "determinism". Palmer, Hance and Hossenfelder argue that quantum mechanics and determinism are not incompatible, using a sophisticated mathematical construction based on a subtle thinning of allowed states and measurements in quantum mechanics, such that what is left appears to make Bell's argument fail, without altering the empirical predictions of quantum mechanics. I think however that it is a smoke screen, and the slogan "lost in math" comes to my mind. I will discuss some other recent disproofs of Bell's theorem using the language of causality based on causal graphs. Causal thinking is also central to law and justice. I will mention surprising connections to my work on serial killer nurse cases, in particular the Dutch case of Lucia de Berk and the current UK case of Lucy Letby.
Nutraceutical market, scope and growth: Herbal drug technologyLokesh Patil
As consumer awareness of health and wellness rises, the nutraceutical market—which includes goods like functional meals, drinks, and dietary supplements that provide health advantages beyond basic nutrition—is growing significantly. As healthcare expenses rise, the population ages, and people want natural and preventative health solutions more and more, this industry is increasing quickly. Further driving market expansion are product formulation innovations and the use of cutting-edge technology for customized nutrition. With its worldwide reach, the nutraceutical industry is expected to keep growing and provide significant chances for research and investment in a number of categories, including vitamins, minerals, probiotics, and herbal supplements.
Professional air quality monitoring systems provide immediate, on-site data for analysis, compliance, and decision-making.
Monitor common gases, weather parameters, particulates.
Slide 1: Title Slide
Extrachromosomal Inheritance
Slide 2: Introduction to Extrachromosomal Inheritance
Definition: Extrachromosomal inheritance refers to the transmission of genetic material that is not found within the nucleus.
Key Components: Involves genes located in mitochondria, chloroplasts, and plasmids.
Slide 3: Mitochondrial Inheritance
Mitochondria: Organelles responsible for energy production.
Mitochondrial DNA (mtDNA): Circular DNA molecule found in mitochondria.
Inheritance Pattern: Maternally inherited, meaning it is passed from mothers to all their offspring.
Diseases: Examples include Leber’s hereditary optic neuropathy (LHON) and mitochondrial myopathy.
Slide 4: Chloroplast Inheritance
Chloroplasts: Organelles responsible for photosynthesis in plants.
Chloroplast DNA (cpDNA): Circular DNA molecule found in chloroplasts.
Inheritance Pattern: Often maternally inherited in most plants, but can vary in some species.
Examples: Variegation in plants, where leaf color patterns are determined by chloroplast DNA.
Slide 5: Plasmid Inheritance
Plasmids: Small, circular DNA molecules found in bacteria and some eukaryotes.
Features: Can carry antibiotic resistance genes and can be transferred between cells through processes like conjugation.
Significance: Important in biotechnology for gene cloning and genetic engineering.
Slide 6: Mechanisms of Extrachromosomal Inheritance
Non-Mendelian Patterns: Do not follow Mendel’s laws of inheritance.
Cytoplasmic Segregation: During cell division, organelles like mitochondria and chloroplasts are randomly distributed to daughter cells.
Heteroplasmy: Presence of more than one type of organellar genome within a cell, leading to variation in expression.
Slide 7: Examples of Extrachromosomal Inheritance
Four O’clock Plant (Mirabilis jalapa): Shows variegated leaves due to different cpDNA in leaf cells.
Petite Mutants in Yeast: Result from mutations in mitochondrial DNA affecting respiration.
Slide 8: Importance of Extrachromosomal Inheritance
Evolution: Provides insight into the evolution of eukaryotic cells.
Medicine: Understanding mitochondrial inheritance helps in diagnosing and treating mitochondrial diseases.
Agriculture: Chloroplast inheritance can be used in plant breeding and genetic modification.
Slide 9: Recent Research and Advances
Gene Editing: Techniques like CRISPR-Cas9 are being used to edit mitochondrial and chloroplast DNA.
Therapies: Development of mitochondrial replacement therapy (MRT) for preventing mitochondrial diseases.
Slide 10: Conclusion
Summary: Extrachromosomal inheritance involves the transmission of genetic material outside the nucleus and plays a crucial role in genetics, medicine, and biotechnology.
Future Directions: Continued research and technological advancements hold promise for new treatments and applications.
Slide 11: Questions and Discussion
Invite Audience: Open the floor for any questions or further discussion on the topic.
(May 29th, 2024) Advancements in Intravital Microscopy- Insights for Preclini...Scintica Instrumentation
Intravital microscopy (IVM) is a powerful tool utilized to study cellular behavior over time and space in vivo. Much of our understanding of cell biology has been accomplished using various in vitro and ex vivo methods; however, these studies do not necessarily reflect the natural dynamics of biological processes. Unlike traditional cell culture or fixed tissue imaging, IVM allows for the ultra-fast high-resolution imaging of cellular processes over time and space and were studied in its natural environment. Real-time visualization of biological processes in the context of an intact organism helps maintain physiological relevance and provide insights into the progression of disease, response to treatments or developmental processes.
In this webinar we give an overview of advanced applications of the IVM system in preclinical research. IVIM technology is a provider of all-in-one intravital microscopy systems and solutions optimized for in vivo imaging of live animal models at sub-micron resolution. The system’s unique features and user-friendly software enables researchers to probe fast dynamic biological processes such as immune cell tracking, cell-cell interaction as well as vascularization and tumor metastasis with exceptional detail. This webinar will also give an overview of IVM being utilized in drug development, offering a view into the intricate interaction between drugs/nanoparticles and tissues in vivo and allows for the evaluation of therapeutic intervention in a variety of tissues and organs. This interdisciplinary collaboration continues to drive the advancements of novel therapeutic strategies.
Backpropagation - A peek into the Mathematics of optimization.pdf
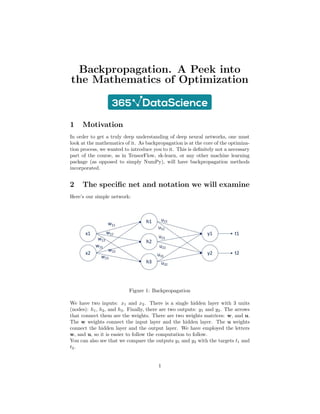
1. Backpropagation. A Peek into
the Mathematics of Optimization
1 Motivation
In order to get a truly deep understanding of deep neural networks, one must
look at the mathematics of it. As backpropagation is at the core of the optimiza-
tion process, we wanted to introduce you to it. This is definitely not a necessary
part of the course, as in TensorFlow, sk-learn, or any other machine learning
package (as opposed to simply NumPy), will have backpropagation methods
incorporated.
2 The specific net and notation we will examine
Here’s our simple network:
Figure 1: Backpropagation
We have two inputs: x1 and x2. There is a single hidden layer with 3 units
(nodes): h1, h2, and h3. Finally, there are two outputs: y1 and y2. The arrows
that connect them are the weights. There are two weights matrices: w, and u.
The w weights connect the input layer and the hidden layer. The u weights
connect the hidden layer and the output layer. We have employed the letters
w, and u, so it is easier to follow the computation to follow.
You can also see that we compare the outputs y1 and y2 with the targets t1 and
t2.
1
2. There is one last letter we need to introduce before we can get to the compu-
tations. Let a be the linear combination prior to activation. Thus, we have:
a(1)
= xw + b(1)
and a(2)
= hu + b(2)
.
Since we cannot exhaust all activation functions and all loss functions, we will
focus on two of the most common. A sigmoid activation and an L2-norm
loss.
With this new information and the new notation, the output y is equal to the ac-
tivated linear combination. Therefore, for the output layer, we have y = σ(a(2)
),
while for the hidden layer: h = σ(a(1)
).
We will examine backpropagation for the output layer and the hidden layer
separately, as the methodologies differ.
3 Useful formulas
I would like to remind you that:
L2-norm loss: L =
1
2
X
i
(yi − ti)2
The sigmoid function is:
σ(x) =
1
1 + e−x
and its derivative is:
σ0
(x) = σ(x)(1 − σ(x))
4 Backpropagation for the output layer
In order to obtain the update rule:
u ← u − η∇uL(u)
we must calculate
∇uL(u)
Let’s take a single weight uij. The partial derivative of the loss w.r.t. uij equals:
∂L
∂uij
=
∂L
∂yj
∂yj
∂a
(2)
j
∂a
(2)
j
∂uij
where i corresponds to the previous layer (input layer for this transformation)
and j corresponds to the next layer (output layer of the transformation). The
partial derivatives were computed simply following the chain rule.
∂L
∂yj
= (yj − tj)
2
3. following the L2-norm loss derivative.
∂yj
∂a
(2)
j
= σ(a
(2)
j )(1 − σ(a
(2)
j )) = yj(1 − yj)
following the sigmoid derivative.
Finally, the third partial derivative is simply the derivative of a(2)
= hu + b(2)
.
So,
∂a
(2)
j
∂uij
= hi
Replacing the partial derivatives in the expression above, we get:
∂L
∂uij
=
∂L
∂yj
∂yj
∂a
(2)
j
∂a
(2)
j
∂uij
= (yj − tj)yj(1 − yj)hi = δjhi
Therefore, the update rule for a single weight for the output layer is given by:
uij ← uij − ηδjhi
5 Backpropagation of a hidden layer
Similarly to the backpropagation of the output layer, the update rule for a single
weight, wij would depend on:
∂L
∂wij
=
∂L
∂hj
∂hj
∂a
(1)
j
∂a
(1)
j
∂wij
following the chain rule.
Taking advantage of the results we have so far for transformation using the
sigmoid activation and the linear model, we get:
∂hj
∂a
(1)
j
= σ(a
(1)
j )(1 − σ(a
(1)
j )) = hj(1 − hj)
and
∂a
(1)
j
∂wij
= xi
The actual problem for backpropagation comes from the term
∂L
∂hj
. That’s due
to the fact that there is no ”hidden” target. You can follow the solution for
weight w11 below. It is advisable to also check Figure 1, while going through
the computations.
3
4. ∂L
∂h1
=
∂L
∂y1
∂y1
∂a
(2)
1
∂a
(2)
1
∂h1
+
∂L
∂y2
∂y2
∂a
(2)
2
∂a
(2)
2
∂h1
=
= (y1 − t1)y1(1 − y1)u11 + (y2 − t2)y2(1 − y2)u12
From here, we can calculate
∂L
∂w11
, which was what we wanted. The final ex-
pression is:
∂L
∂w11
= [(y1 − t1)y1(1 − y1)u11 + (y2 − t2)y2(1 − y2)u12] h1(1 − h1)x1
The generalized form of this equation is:
∂L
∂wij
=
X
k
(yk − tk)yk(1 − yk)ujkhj(1 − hj)xi
6 Backpropagation generalization
Using the results for backpropagation for the output layer and the hidden layer,
we can put them together in one formula, summarizing backpropagation, in the
presence of L2-norm loss and sigmoid activations.
∂L
∂wij
= δjxi
where for a hidden layer
δj =
X
k
δkwjkyj(1 − yj)
Kudos to those of you who got to the end.
Thanks for reading.
4