PC pacientes neurologicos Varones B4
•
0 likes•583 views

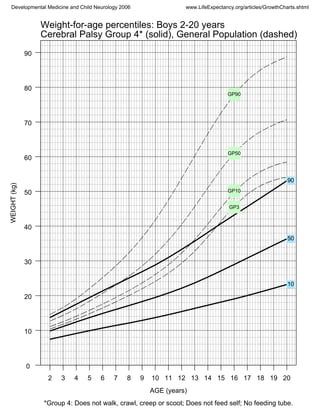
The document contains three growth charts comparing weight, height, and BMI percentiles of boys ages 2 to 20 years old with cerebral palsy in group 4 versus the general population. Group 4 consists of boys who cannot walk, crawl, creep, or scoot and cannot feed themselves without a feeding tube. The solid lines represent cerebral palsy group 4 and the dashed lines represent the general population percentiles.

Recommended
More Related Content
Similar to PC pacientes neurologicos Varones B4
Similar to PC pacientes neurologicos Varones B4 (20)
More from Andrés Dante Podestá
More from Andrés Dante Podestá (20)
PC pacientes neurologicos Varones B4
- 1. WEIGHT(kg) AGE (years) 0 10 20 30 40 50 60 70 80 90 2 3 4 5 6 7 8 9 10 11 12 13 14 15 16 17 18 19 20 90 50 10 GP90 GP50 GP10 GP3 Weight-for-age percentiles: Boys 2-20 years Cerebral Palsy Group 4* (solid), General Population (dashed) *Group 4: Does not walk, crawl, creep or scoot; Does not feed self; No feeding tube. Developmental Medicine and Child Neurology 2006 www.LifeExpectancy.org/articles/GrowthCharts.shtml
- 2. HEIGHT(cm) AGE (years) 50 60 70 80 90 100 110 120 130 140 150 160 170 180 190 2 3 4 5 6 7 8 9 10 11 12 13 14 15 16 17 18 19 20 90 50 10 GP90 GP50 GP10 Height-for-age percentiles: Boys 2-20 years Cerebral Palsy Group 4* (solid), General Population (dashed) *Group 4: Does not walk, crawl, creep or scoot; Does not feed self; No feeding tube. Developmental Medicine and Child Neurology 2006 www.LifeExpectancy.org/articles/GrowthCharts.shtml
- 3. BMI(kg/m2) AGE (years) 0 10 20 30 2 3 4 5 6 7 8 9 10 11 12 13 14 15 16 17 18 19 20 90 50 10 GP90 GP50 GP10 BMI-for-age percentiles: Boys 2-20 years Cerebral Palsy Group 4* (solid), General Population (dashed) *Group 4: Does not walk, crawl, creep or scoot; Does not feed self; No feeding tube. Developmental Medicine and Child Neurology 2006 www.LifeExpectancy.org/articles/GrowthCharts.shtml