SlideShare a Scribd company logo
1 of 7
Download to read offline
International Journal of Engineering Science Invention
ISSN (Online): 2319 – 6734, ISSN (Print): 2319 – 6726
www.ijesi.org ǁ Volume 3 ǁ Issue 1 ǁ January 2014 ǁ PP.07-13

Influence of a Chemical Industry Effluent on Water Quality of
GobindBallabh Pant Sagar – A Long Term Study
Kachhal Prabhakar1, Beena Anand2, SN Sharma3, Pankaj Sharma4, SL Gupta5
1-5

(Central Soil & Materials Research Station, Ministry of Water Resources, New Delhi – 110016 (INDIA)

ABSTRACT: GobindBallabh Pant Sagar was created in 1962 on the river Rihand. The Dam is located in the
state of Uttar Pradesh (24°12′9″N83°0′29″E 24.2025°N 83.00806°E). It was commissioned for the purposes like
irrigation, flood control, fishery and wild life conservation etc. along with electricity generation. Many thermal
power plants of different capacity have been raised around the reservoir. Abundance of power promoted
establishment of chemical industries. The industrial effluents discharged in the reservoir without proper
treatment contaminate the hydro-environment. For the purpose of monitoring the degree of pollution, a long
term detailed investigation program was initiated in the region near one of the major industries. The studies aim
at monitoring the degree of chemical pollution of reservoir water which will have multifold impacts on both
biotic as well as abiotic components. The studies clearly indicate that further deterioration in the quality of the
reservoir water has been arrested since monitoring of the quality of reservoir water was initiated. This paper
presents the details of the observations carried out in the region around this in different seasons during the
period October 2002 to August 2012.

KEYWORDS: Chemical effluents; pH; Conductivity; Suspended matter; Total dissolved salts; Pollution
I.

INTRODUCTION

GobindBallabh Pant Sagar (GBS), also known as Rihand reservoir was created in 1962 on the river
Rihand, a tributary to Sone, which in turn joins the Ganga on its right flank. The river originates from the hills
of Madhya Pradesh, draining a catchment of 13 344 km2. Rihand Dam on it is located in the state of Uttar
Pradesh (24°12′9″N83°0′29″E 24.2025°N 83.00806°E). The reservoir has a capacity of 10 625 million m3 at the
FRL of 268’ above MSL and a surface area of 46538 ha, which shrinks to 13759 ha at the dead storage (mean
30149 ha). It has a maximum length of 48 km and the mean depth at FRL is 22.8 m. Annual rate of inflow is
estimated at 6 301 million m3.

Fig. 1: Location of the Investigated Region of GBS around CHI

www.ijesi.org

7 | Page
Influence of a Chemical Industry Effluent…
Large quantities of readily available reservoir water and the abundance of coal from nearby open cast
mines led to the installation of a number of thermal power plants (TPP). Availability of power promoted many
chemical industries around it. For the study the region around one of these chemical industries situated in
northern region of GBS (CHI) (Fig 1) have been selected for carrying out observations. The CHI use water from
reservoir for discharging its run off in the reservoir. The discharged effluents increase the percentage of
suspended solids in the reservoir waters[1]. The contaminated water discharged from it in the reservoir increase
the temperature of reservoir[1] and change the chemical composition of reservoir water [2]. For the purpose of
monitoring the degree of pollution caused by CHI, a long term detailed investigation program was initiated. The
study aims at long term monitoring and highlighting the degree of pollution of reservoir water so that measures
to regulate it can be timely administered to arrest multifold impacts on both biotic as well as abiotic
components.

II.

SALIENT FEATURES OF CHI

The CHI is built aside GovindBallabh Pant Sagar Lake. It produces caustic soda on a very large scale.
CHI is one of the leading industries in the chlor-alkali segment in India.

III.

ANTICIPATED PROBLEMS

Some of the anticipated problems associated likely to be encountered in the project are





Increase in average temperature of the reservoir water.
Change in pH of reservoir water over a long period of time.
Change in the total dissolved salts (TDS)
Increase in aggressivity of water which may affect the concrete structures.

IV.

FOCUS OF INVESTIGATION

Continuous monitoring of the quality of water has been carried out for assessing degree and rate of
contamination. Following important aspects were taken into consideration during investigation




Quality of water in the immediate vicinity of the confluence of effluents from CHI with the reservoir
water .
Quality of the chemical effluent water
Identifying the effluent samples from CHI going into the reservoir and Reservoir water from various
locations (RW) conforming/not conforming to Central Pollution Control Board of India (CPCB) standard
for emission or discharge of environmental pollutants, in a ash pond [3] and ISI standards for potable
water[4]Suspended solid contents and pH value of the effluent samples of CHI for pollution studies was
carried out apart from determining other chemical parameters

V.

MATERIAL S AND METHODS

Sampling location was selected for collection of CHI effluent and RW samples (Fig 1). During the
period from October 2002 to August 2012 samples were collected during pre monsoon, monsoon and post
monsoon periods. The samples were analyzed as per analytical procedure laid down in IS 3025-1986[5].
Wherever necessary, reference was also made to the procedure laid down by American Public Health
Association and Water Pollution Control Federation, USA [6].

VI.

FIELD INVESTIGATIONS

The in situ parameters viz. pH, Conductivity, Temperature, CaCO3 Saturated pH, NH4+ and S2- of water
samples collected from various locations were determined immediately after collection of each sample.

VII.

LABORATORY INVESTIGATIONS

Detailed laboratory chemical analysis was carried out on water samples collected from various
locations. Chloride, Sulphate, Bicarbonate, Carbonate, Calcium, Magnesium, Sodium, Potassium, Copper, Zinc,
Manganese, Lead, Chromium and Iron content is determined using state of the Art equipment like

www.ijesi.org

8 | Page
Influence of a Chemical Industry Effluent…
AtomicAbsorption Spectrophotometer,microprocessor based flame photometer, UV Visible Spectrophotometer
etc. In addition, amount of suspended solids was also determined using gravimetric method.

VIII.

OBSERVATIONS

8.1 Temperature
The observed insitu temperature for the CHI effluent RW samples collected during different seasons is
presented in Fig. 2.
CHI Effluent

Temperature oC

50

Reservoir Water near CHI

40
30
20
10

Oct.2011

Aug. 2012

Oct. 2009

Oct. 2008

May. 2009

Mar. 2008

Aug. 2007

Jul. 2006

Sep. 2005

May. 2005

Oct. 2004

May. 2004

Nov. 2003

Jan. 2003

Jun. 2003

Oct. 2002

0

Fig. 2: Insitu Temperature of Samples collected in Different Seasons

8.2 pH values

Aug. 2012

Oct.2011

Oct. 2009

May. 2009

Oct. 2008

Mar. 2008

Jul. 2006

Sep. 2005

Reservoir Water near CHI

May. 2005

Oct. 2004

May. 2004

Nov. 2003

Jun. 2003

Jan. 2003

CHI Effluent

Aug. 2007

12
11
10
9
8
7
6
5
4

Oct. 2002

pH

pH values of CHI effluent and RW the samples is presented in Fig 3.

Fig. 3: pH of Samples collected in Different Seasons

8.3 Conductivity values
The conductivity value of CHI effluent and RW samples is presented in Fig 4.
CHI Effluent x 10

Reservoir Water near CHI

800
600
400
200

Aug. 2012

Oct.2011

Oct. 2009

May. 2009

Oct. 2008

Mar. 2008

Aug. 2007

Jul. 2006

Sep. 2005

May. 2005

Oct. 2004

May. 2004

Jun. 2003

Nov. 2003

Jan. 2003

0

Oct. 2002

Conductivity (mmhos/cm)

1000

Fig. 4: Conductivity of Samples collected in Different Seasons

www.ijesi.org

9 | Page
Influence of a Chemical Industry Effluent…
8.4 Suspended solids
The observed value for CHI effluent and RW presented in Fig. 5.
CHI Effluents

Suspended Solids (mg/lit)

200

Reservoir Water near CHI

160
120
80
40
Aug. 2012

Oct.2011

Oct. 2009

May. 2009

Oct. 2008

Mar. 2008

Aug. 2007

Jul. 2006

Sep. 2005

May. 2005

Oct. 2004

May. 2004

Nov. 2003

Oct. 2002

Jan. 2003

Jun. 2003

0

Fig. 5: Results of Suspended Solids in the Samples collected in Different Seasons

8.5 Chloride (Cl -)
Chloride (Cl -) concentration in CHI effluent and RW samples is presented in Fig 6.

Chloride (mg/lit)

100

CHI Effluent x 100

Reservoir Water near CHI

80
60
40
20

Aug. 2012

Oct.2011

Oct. 2009

May. 2009

Oct. 2008

Mar. 2008

Aug. 2007

Jul. 2006

Sep. 2005

May. 2005

Oct. 2004

May. 2004

Jun. 2003

Nov. 2003

Jan. 2003

Oct. 2002

0

Fig. 6: Results of Chloride Content in the Samples collected in Different Seasons

8.6 Sulphate (SO42-)
Sulphate (SO42-) concentration in CHI effluent and RW samples are presented in Fig. 7 .

Sulphate (mg/lit)

50

CHI Effluent x 10

Reservoir Water near CHI

40
30
20
10

Aug. 2012

Oct.2011

Oct. 2009

May. 2009

Oct. 2008

Mar. 2008

Aug. 2007

Jul. 2006

Sep. 2005

May. 2005

Oct. 2004

May. 2004

Nov. 2003

Jun. 2003

Jan. 2003

Oct. 2002

0

Fig. 7: Results of Sulphate Content in the Samples collected in Different Seasons

www.ijesi.org

10 | Page
Influence of a Chemical Industry Effluent…
8.7 Calcium (Ca2+)
The Calcium (Ca2+) concentration for CHI effluent and RW samples is presented in Fig 8.

Calcium (mg/lit)

50

CHI Effluent x 10

Reservoir Water near CHI

40
30
20
10

Aug. 2012

Oct.2011

Oct. 2009

May. 2009

Oct. 2008

Mar. 2008

Aug. 2007

Jul. 2006

Sep. 2005

May. 2005

Oct. 2004

May. 2004

Nov. 2003

Jun. 2003

Jan. 2003

Oct. 2002

0

Fig. 8: Results of Calcium Content in the Samples collected in Different Seasons
8.8 Magnesium (Mg2+)
The Magnesium (Mg2+) concentration for CHI effluent and RW samples is presented in Fig 9.
CHI Effluent x 10

Magnesium (mg/lit)

30

Reservoir Water near CHI

25
20
15
10
5

Aug. 2012

Oct.2011

Oct. 2009

May. 2009

Oct. 2008

Mar. 2008

Aug. 2007

Jul. 2006

Sep. 2005

May. 2005

Oct. 2004

May. 2004

Nov. 2003

Jun. 2003

Jan. 2003

Oct. 2002

0

Fig. 9: Results of Magnesium Content in the Samples collected in Different Seasons
8.9 Total dissolved salts
The result of total dissolved salts for different samples is presented in Fig 10.
CHI Effluent x 100

300

Reservoir Water near CHI

TDS (mg/lit)

250
200
150
100
50

Aug. 2012

Oct.2011

Oct. 2009

May. 2009

Oct. 2008

Mar. 2008

Aug. 2007

Jul. 2006

Sep. 2005

May. 2005

Oct. 2004

May. 2004

Nov. 2003

Jun. 2003

Jan. 2003

Oct. 2002

0

Fig. 10: Results of Total Dissolved Solids in the Samples from Various Locations
8.10 Ammonium (NH4+)
Ammonium content of water samples collected from various locations was found to be nil. The ammonia level
of such water drastically reduces[2].

www.ijesi.org

11 | Page
Influence of a Chemical Industry Effluent…
8.11 Copper, Manganese, Iron, Lead, Chromium and Zinc
Heavy metals like copper, manganese, iron, lead, chromium, zinc are found absent or in very low concentration.

IX.

DISCUSSIONS OF RESULTS

9.1 Temperature
The main ecological consequence of polluted water discharged by CHI into the aquatic ecosystem is
increase in water temperature. Elevation of temperature of reservoir water by 8 to 10 °C[2] has been reported
by many observers. During the period of observations the average temperature of the CHI effluent varied in the
range 21.1 to 31.9°C and that of RW samples between 21.4 to 34.1°C.
9.2 Assessment of pH, suspended solids, conductivity, total dissolved salts and chloridewith respect to the
standard parameters for discharge of environmental pollutants
CHI effluent may cause pollution hazards and ecological damage in the reservoirs. Further it is high in
total alkalinity, specific conductivity and chloride[1], [2]. Results of pH, suspended solids, conductivity, total
dissolved salts and chloride for the tests conducted on the CHI effluents and RW samples [7, 8, 9, 10, 11] are
discussed w.r.t standard values (Table 1).
Table - 1
Assessment of TPP AS and RW Samples w. r. t. Recommended Standards
Sample
Parameter
Observed range
CPCB
Samples
Samples
for the collected
prescribed
confirming
exceeding
samples
limits[4]* and
to CPCB or
CPCB or ISI
ISI prescribed
ISI
prescribed
limits[5]**
prescribed
limits
limits
pH
7.1 – 10.9
6.5 – 8.5*
8
8
*
CHI
Suspended
9.6 – 189.0
100mg/l
11
5
Effluent
solids, mg/l
Conductivityμm
hos/cm
Total dissolved
solid, mg/l
Chloride, mg/l

1152 – 8720

15

-

16

4.0 – 13.10

200 mg/l**

-

16

pH

6.85 – 8.96

6.5 – 8.5*

5

9

Conductivityμm
hos/cm
Total dissolved
solid, mg/l
Chloride, mg/l

71.3 – 205

14

-

28.8 – 152

Less than 1500
μmhos/cm**
500 mg/l. **

14

-

2.8 – 20.0

200 mg/l**

13

-

Suspended
solids, mg/l

RW

1

29.6 – 195.0

Less than 1500
μmhos/cm**
500 mg/l. **

6.7 – 181.4

100mg/l*

11

2

X.

CONCLUSION

Sensing these concerns as raised by many authors a long term detailed investigation program was
initiated for the purpose of monitoring the degree of pollution caused by ever growing industries. Constant
monitoring of the hydro-environment in GBS in the region around CHI have arrested further deterioration in the
quality of the reservoir water.

www.ijesi.org

12 | Page
Influence of a Chemical Industry Effluent…
XI.

ACKNOWLEDGEMENT

The authors extend their sincere thanks to officers and staff of Concrete Chemistry Division of
CSMRS and GBS Management authorities for the help extended by them. We also extend our sincere gratitude
to all the authors whose publications provided us directional information from time to time.

REFERENCES
[1.]
[2.]
[3.]
[4.]
[5.]
[6.]
[7.]

[8.]
[9.]
[10.]
[11.]

Chandra, K., R. S. Panwar and D. N. Singh, 1985. “Possible pollution problems from wastes of thermal power plants in India-A
case study of Rihand Reservoir, Mirzapur (U.P.)”, Proceedings of the Symposium on Environmental Pollution, pp 283–294.
Davies, I., 1966. “Chemical Changes in cooling water towers”.Int. J. Air Water Pollut., 10: 853.
Central Pollution Control Board, India “Standards for Emission or Discharge of Environmental Pollutants, in a ash pond effluent
- Pollution Control Acts, Rules and Notifications, 1996”
A.M. Shaikh, P.N. Mandre, 2009 “Seasonal study of physico-chemical parameters of drinking water in khed ( lote ) industrial
area”Shodh, SamikshaaurMulyankan , Vol. II, Issue-7, 169-171.
IS 3025-1986 "Methods of Sampling and Test (Physical and Chemical) for Water used in the Industry”[American Public Health Association and Water Pollution Control Federation, USA, 1985
“Standard Methods for the Examination of Water and Waste Water”
Central Soil and Materials Research Station, New Delhi, 2009 “Investigation report on the effect of pollutants from the thermal
power plants/chemical factory on the quality of water in the dam reservoir and its effects on the concrete durability for Rihand
dam project, UP.”
Central Soil & Materials Research Station, New Delhi, October 2011, “Investigation report on “Chemical analysis of reservoir
water, seepage water and ash slurry/effluent samples from Rihand Dam Project, UP”.
Central Soil & Materials Research Station, New Delhi, August 2012 “Investigation report on “Chemical analysis of reservoir water,
seepage water and ash slurry/effluent samples from Rihand Dam Project, UP”.
Sharma Pankaj et al,” Monitoring The Contamination In The GobindBallabh Pant Sagar, Rihand, U.P. India” International
Journal of Environmental Sciences, Volume 3, No 1, 2012 (487-497).
Sharma SN, Sharma Pankaj, Pathak RP, “Effect of contamination on long term durability of Rihand Dam, U.P.-A case study”
International Journal of Research in Chemistry and Environment, Volume 2 (4), October, 2012, (192-199).

www.ijesi.org

13 | Page

More Related Content

What's hot

IRJET- Assessment of Ground Water Pollution Near Landfill Site at Pune and Su...
IRJET- Assessment of Ground Water Pollution Near Landfill Site at Pune and Su...IRJET- Assessment of Ground Water Pollution Near Landfill Site at Pune and Su...
IRJET- Assessment of Ground Water Pollution Near Landfill Site at Pune and Su...IRJET Journal
 
CHARACTERIZATION OF LEACHATE FROM MUNCIPAL LANDFILL AND ITS EFFECT ON SURROUN...
CHARACTERIZATION OF LEACHATE FROM MUNCIPAL LANDFILL AND ITS EFFECT ON SURROUN...CHARACTERIZATION OF LEACHATE FROM MUNCIPAL LANDFILL AND ITS EFFECT ON SURROUN...
CHARACTERIZATION OF LEACHATE FROM MUNCIPAL LANDFILL AND ITS EFFECT ON SURROUN...Dr. Naveen BP
 
Seasonal Variations in Physico-Chemical Parameter of Groundwater in Bhimavara...
Seasonal Variations in Physico-Chemical Parameter of Groundwater in Bhimavara...Seasonal Variations in Physico-Chemical Parameter of Groundwater in Bhimavara...
Seasonal Variations in Physico-Chemical Parameter of Groundwater in Bhimavara...IJERD Editor
 
Assessment of Water Quality Status of Godavari river around process industrie...
Assessment of Water Quality Status of Godavari river around process industrie...Assessment of Water Quality Status of Godavari river around process industrie...
Assessment of Water Quality Status of Godavari river around process industrie...ijtsrd
 
IrEnvironmental Presence of Heavy Metal Contamination of Industrial Tributary...
IrEnvironmental Presence of Heavy Metal Contamination of Industrial Tributary...IrEnvironmental Presence of Heavy Metal Contamination of Industrial Tributary...
IrEnvironmental Presence of Heavy Metal Contamination of Industrial Tributary...IRJET Journal
 
ASSESSMENT OF WATER QUALITY OF GODAVARI RIVER AT NASHIK, MAHARASHTRA, INDIA
ASSESSMENT OF WATER QUALITY OF GODAVARI RIVER AT NASHIK, MAHARASHTRA, INDIAASSESSMENT OF WATER QUALITY OF GODAVARI RIVER AT NASHIK, MAHARASHTRA, INDIA
ASSESSMENT OF WATER QUALITY OF GODAVARI RIVER AT NASHIK, MAHARASHTRA, INDIAIAEME Publication
 
10 a study of heavy metal pollution of ghaggar river ravi pareek
10 a study of heavy metal pollution of ghaggar river ravi pareek10 a study of heavy metal pollution of ghaggar river ravi pareek
10 a study of heavy metal pollution of ghaggar river ravi pareekBIOLOGICAL FORUM
 
Pollution Status of Mithi River
Pollution Status of Mithi RiverPollution Status of Mithi River
Pollution Status of Mithi RiverAM Publications
 
Study of Seasonal Variations in Oxygen Consumption of Estuarine Clam, Meretri...
Study of Seasonal Variations in Oxygen Consumption of Estuarine Clam, Meretri...Study of Seasonal Variations in Oxygen Consumption of Estuarine Clam, Meretri...
Study of Seasonal Variations in Oxygen Consumption of Estuarine Clam, Meretri...ijtsrd
 
OJC_Vol_31(3)_p1835-1839 (1)
OJC_Vol_31(3)_p1835-1839 (1)OJC_Vol_31(3)_p1835-1839 (1)
OJC_Vol_31(3)_p1835-1839 (1)Susan Jacob
 
Separation, characterization and leaching behaviors of heavy metals in contam...
Separation, characterization and leaching behaviors of heavy metals in contam...Separation, characterization and leaching behaviors of heavy metals in contam...
Separation, characterization and leaching behaviors of heavy metals in contam...Alexander Decker
 
11.identification of heavy metals contamination by multivariate statistical a...
11.identification of heavy metals contamination by multivariate statistical a...11.identification of heavy metals contamination by multivariate statistical a...
11.identification of heavy metals contamination by multivariate statistical a...Alexander Decker
 
Identification of heavy metals contamination by multivariate statistical anal...
Identification of heavy metals contamination by multivariate statistical anal...Identification of heavy metals contamination by multivariate statistical anal...
Identification of heavy metals contamination by multivariate statistical anal...Alexander Decker
 
Sub critical water as a green solvent for production of valuable materials
Sub critical water as a green solvent for production of valuable materialsSub critical water as a green solvent for production of valuable materials
Sub critical water as a green solvent for production of valuable materialsGJESM Publication
 
Arsenic in Tube Well Water in Six Blocks of Supaul District, Bihar
Arsenic in Tube Well Water in Six Blocks of Supaul District, BiharArsenic in Tube Well Water in Six Blocks of Supaul District, Bihar
Arsenic in Tube Well Water in Six Blocks of Supaul District, Bihariosrjce
 

What's hot (19)

IRJET- Assessment of Ground Water Pollution Near Landfill Site at Pune and Su...
IRJET- Assessment of Ground Water Pollution Near Landfill Site at Pune and Su...IRJET- Assessment of Ground Water Pollution Near Landfill Site at Pune and Su...
IRJET- Assessment of Ground Water Pollution Near Landfill Site at Pune and Su...
 
CHARACTERIZATION OF LEACHATE FROM MUNCIPAL LANDFILL AND ITS EFFECT ON SURROUN...
CHARACTERIZATION OF LEACHATE FROM MUNCIPAL LANDFILL AND ITS EFFECT ON SURROUN...CHARACTERIZATION OF LEACHATE FROM MUNCIPAL LANDFILL AND ITS EFFECT ON SURROUN...
CHARACTERIZATION OF LEACHATE FROM MUNCIPAL LANDFILL AND ITS EFFECT ON SURROUN...
 
Seasonal Variations in Physico-Chemical Parameter of Groundwater in Bhimavara...
Seasonal Variations in Physico-Chemical Parameter of Groundwater in Bhimavara...Seasonal Variations in Physico-Chemical Parameter of Groundwater in Bhimavara...
Seasonal Variations in Physico-Chemical Parameter of Groundwater in Bhimavara...
 
Assessment of Water Quality Status of Godavari river around process industrie...
Assessment of Water Quality Status of Godavari river around process industrie...Assessment of Water Quality Status of Godavari river around process industrie...
Assessment of Water Quality Status of Godavari river around process industrie...
 
IrEnvironmental Presence of Heavy Metal Contamination of Industrial Tributary...
IrEnvironmental Presence of Heavy Metal Contamination of Industrial Tributary...IrEnvironmental Presence of Heavy Metal Contamination of Industrial Tributary...
IrEnvironmental Presence of Heavy Metal Contamination of Industrial Tributary...
 
ASSESSMENT OF WATER QUALITY OF GODAVARI RIVER AT NASHIK, MAHARASHTRA, INDIA
ASSESSMENT OF WATER QUALITY OF GODAVARI RIVER AT NASHIK, MAHARASHTRA, INDIAASSESSMENT OF WATER QUALITY OF GODAVARI RIVER AT NASHIK, MAHARASHTRA, INDIA
ASSESSMENT OF WATER QUALITY OF GODAVARI RIVER AT NASHIK, MAHARASHTRA, INDIA
 
10 a study of heavy metal pollution of ghaggar river ravi pareek
10 a study of heavy metal pollution of ghaggar river ravi pareek10 a study of heavy metal pollution of ghaggar river ravi pareek
10 a study of heavy metal pollution of ghaggar river ravi pareek
 
Pollution Status of Mithi River
Pollution Status of Mithi RiverPollution Status of Mithi River
Pollution Status of Mithi River
 
Ep35806817
Ep35806817Ep35806817
Ep35806817
 
Study of Seasonal Variations in Oxygen Consumption of Estuarine Clam, Meretri...
Study of Seasonal Variations in Oxygen Consumption of Estuarine Clam, Meretri...Study of Seasonal Variations in Oxygen Consumption of Estuarine Clam, Meretri...
Study of Seasonal Variations in Oxygen Consumption of Estuarine Clam, Meretri...
 
OJC_Vol_31(3)_p1835-1839 (1)
OJC_Vol_31(3)_p1835-1839 (1)OJC_Vol_31(3)_p1835-1839 (1)
OJC_Vol_31(3)_p1835-1839 (1)
 
Carbon capture
Carbon capture Carbon capture
Carbon capture
 
JSEHR 1(1)-1
JSEHR 1(1)-1JSEHR 1(1)-1
JSEHR 1(1)-1
 
Separation, characterization and leaching behaviors of heavy metals in contam...
Separation, characterization and leaching behaviors of heavy metals in contam...Separation, characterization and leaching behaviors of heavy metals in contam...
Separation, characterization and leaching behaviors of heavy metals in contam...
 
11.identification of heavy metals contamination by multivariate statistical a...
11.identification of heavy metals contamination by multivariate statistical a...11.identification of heavy metals contamination by multivariate statistical a...
11.identification of heavy metals contamination by multivariate statistical a...
 
Identification of heavy metals contamination by multivariate statistical anal...
Identification of heavy metals contamination by multivariate statistical anal...Identification of heavy metals contamination by multivariate statistical anal...
Identification of heavy metals contamination by multivariate statistical anal...
 
Aijrfans14 219
Aijrfans14 219Aijrfans14 219
Aijrfans14 219
 
Sub critical water as a green solvent for production of valuable materials
Sub critical water as a green solvent for production of valuable materialsSub critical water as a green solvent for production of valuable materials
Sub critical water as a green solvent for production of valuable materials
 
Arsenic in Tube Well Water in Six Blocks of Supaul District, Bihar
Arsenic in Tube Well Water in Six Blocks of Supaul District, BiharArsenic in Tube Well Water in Six Blocks of Supaul District, Bihar
Arsenic in Tube Well Water in Six Blocks of Supaul District, Bihar
 

Similar to International Journal of Engineering and Science Invention (IJESI)

An analytical study on impact of industrial effluent on the karun river, raip...
An analytical study on impact of industrial effluent on the karun river, raip...An analytical study on impact of industrial effluent on the karun river, raip...
An analytical study on impact of industrial effluent on the karun river, raip...Manoj Kumar Tiwari
 
IRJET- Study and Analysis of Changes in Water Quality of Gomti River at diffe...
IRJET- Study and Analysis of Changes in Water Quality of Gomti River at diffe...IRJET- Study and Analysis of Changes in Water Quality of Gomti River at diffe...
IRJET- Study and Analysis of Changes in Water Quality of Gomti River at diffe...IRJET Journal
 
Grds international conference on pure and applied science (8)
Grds international conference on pure and applied science (8)Grds international conference on pure and applied science (8)
Grds international conference on pure and applied science (8)Global R & D Services
 
Determination-Of-Sources-Of-Water-Pollution
Determination-Of-Sources-Of-Water-PollutionDetermination-Of-Sources-Of-Water-Pollution
Determination-Of-Sources-Of-Water-PollutionCOLLINS KUFFOUR
 
IRJET- Treatment of Ground Water Affected by Heavy Metals by Reverse Osmosis
IRJET- Treatment of Ground Water Affected by Heavy Metals by Reverse OsmosisIRJET- Treatment of Ground Water Affected by Heavy Metals by Reverse Osmosis
IRJET- Treatment of Ground Water Affected by Heavy Metals by Reverse OsmosisIRJET Journal
 
Study of Solar Distillation on Domestic Wastewater Treatment
Study of Solar Distillation on Domestic Wastewater TreatmentStudy of Solar Distillation on Domestic Wastewater Treatment
Study of Solar Distillation on Domestic Wastewater TreatmentIRJET Journal
 
Study on groundwater quality in and around sipcot industrial complex, area cu...
Study on groundwater quality in and around sipcot industrial complex, area cu...Study on groundwater quality in and around sipcot industrial complex, area cu...
Study on groundwater quality in and around sipcot industrial complex, area cu...ijceronline
 
Assessment of Physico-Chemical Properties and Toxic Heavy Metals in Water Fro...
Assessment of Physico-Chemical Properties and Toxic Heavy Metals in Water Fro...Assessment of Physico-Chemical Properties and Toxic Heavy Metals in Water Fro...
Assessment of Physico-Chemical Properties and Toxic Heavy Metals in Water Fro...IRJET Journal
 
Physico Chemical Analysis of Ceramic Industries Wastewater in Khurja District...
Physico Chemical Analysis of Ceramic Industries Wastewater in Khurja District...Physico Chemical Analysis of Ceramic Industries Wastewater in Khurja District...
Physico Chemical Analysis of Ceramic Industries Wastewater in Khurja District...ijtsrd
 
Modelling the Effect of Industrial Effluents on Water Quality: “A Case Study ...
Modelling the Effect of Industrial Effluents on Water Quality: “A Case Study ...Modelling the Effect of Industrial Effluents on Water Quality: “A Case Study ...
Modelling the Effect of Industrial Effluents on Water Quality: “A Case Study ...IJMER
 
The International Journal of Engineering and Science (The IJES)
The International Journal of Engineering and Science (The IJES)The International Journal of Engineering and Science (The IJES)
The International Journal of Engineering and Science (The IJES)theijes
 
Evaluation of Water Quality of Kharun River Stretch Near the Raipur City
Evaluation of Water Quality of Kharun River Stretch Near the Raipur CityEvaluation of Water Quality of Kharun River Stretch Near the Raipur City
Evaluation of Water Quality of Kharun River Stretch Near the Raipur CityIRJET Journal
 
Comparative Analysis of Physicochemical Parameters and Heavy Metals of Public...
Comparative Analysis of Physicochemical Parameters and Heavy Metals of Public...Comparative Analysis of Physicochemical Parameters and Heavy Metals of Public...
Comparative Analysis of Physicochemical Parameters and Heavy Metals of Public...iosrjce
 
Trace metals contamination of groundwater in and around tannery industrial ar...
Trace metals contamination of groundwater in and around tannery industrial ar...Trace metals contamination of groundwater in and around tannery industrial ar...
Trace metals contamination of groundwater in and around tannery industrial ar...eSAT Publishing House
 
Impact on Aquatic Environment for Water Pollution in the Vahirab River
Impact on Aquatic Environment for Water Pollution in the Vahirab RiverImpact on Aquatic Environment for Water Pollution in the Vahirab River
Impact on Aquatic Environment for Water Pollution in the Vahirab Rivertheijes
 

Similar to International Journal of Engineering and Science Invention (IJESI) (20)

An analytical study on impact of industrial effluent on the karun river, raip...
An analytical study on impact of industrial effluent on the karun river, raip...An analytical study on impact of industrial effluent on the karun river, raip...
An analytical study on impact of industrial effluent on the karun river, raip...
 
Ijciet 10 02_018
Ijciet 10 02_018Ijciet 10 02_018
Ijciet 10 02_018
 
An33233237
An33233237An33233237
An33233237
 
An33233237
An33233237An33233237
An33233237
 
IRJET- Study and Analysis of Changes in Water Quality of Gomti River at diffe...
IRJET- Study and Analysis of Changes in Water Quality of Gomti River at diffe...IRJET- Study and Analysis of Changes in Water Quality of Gomti River at diffe...
IRJET- Study and Analysis of Changes in Water Quality of Gomti River at diffe...
 
Grds international conference on pure and applied science (8)
Grds international conference on pure and applied science (8)Grds international conference on pure and applied science (8)
Grds international conference on pure and applied science (8)
 
Determination-Of-Sources-Of-Water-Pollution
Determination-Of-Sources-Of-Water-PollutionDetermination-Of-Sources-Of-Water-Pollution
Determination-Of-Sources-Of-Water-Pollution
 
IRJET- Treatment of Ground Water Affected by Heavy Metals by Reverse Osmosis
IRJET- Treatment of Ground Water Affected by Heavy Metals by Reverse OsmosisIRJET- Treatment of Ground Water Affected by Heavy Metals by Reverse Osmosis
IRJET- Treatment of Ground Water Affected by Heavy Metals by Reverse Osmosis
 
Aijrfans14 233
Aijrfans14 233Aijrfans14 233
Aijrfans14 233
 
Study of Solar Distillation on Domestic Wastewater Treatment
Study of Solar Distillation on Domestic Wastewater TreatmentStudy of Solar Distillation on Domestic Wastewater Treatment
Study of Solar Distillation on Domestic Wastewater Treatment
 
Study on groundwater quality in and around sipcot industrial complex, area cu...
Study on groundwater quality in and around sipcot industrial complex, area cu...Study on groundwater quality in and around sipcot industrial complex, area cu...
Study on groundwater quality in and around sipcot industrial complex, area cu...
 
C012311114
C012311114C012311114
C012311114
 
Assessment of Physico-Chemical Properties and Toxic Heavy Metals in Water Fro...
Assessment of Physico-Chemical Properties and Toxic Heavy Metals in Water Fro...Assessment of Physico-Chemical Properties and Toxic Heavy Metals in Water Fro...
Assessment of Physico-Chemical Properties and Toxic Heavy Metals in Water Fro...
 
Physico Chemical Analysis of Ceramic Industries Wastewater in Khurja District...
Physico Chemical Analysis of Ceramic Industries Wastewater in Khurja District...Physico Chemical Analysis of Ceramic Industries Wastewater in Khurja District...
Physico Chemical Analysis of Ceramic Industries Wastewater in Khurja District...
 
Modelling the Effect of Industrial Effluents on Water Quality: “A Case Study ...
Modelling the Effect of Industrial Effluents on Water Quality: “A Case Study ...Modelling the Effect of Industrial Effluents on Water Quality: “A Case Study ...
Modelling the Effect of Industrial Effluents on Water Quality: “A Case Study ...
 
The International Journal of Engineering and Science (The IJES)
The International Journal of Engineering and Science (The IJES)The International Journal of Engineering and Science (The IJES)
The International Journal of Engineering and Science (The IJES)
 
Evaluation of Water Quality of Kharun River Stretch Near the Raipur City
Evaluation of Water Quality of Kharun River Stretch Near the Raipur CityEvaluation of Water Quality of Kharun River Stretch Near the Raipur City
Evaluation of Water Quality of Kharun River Stretch Near the Raipur City
 
Comparative Analysis of Physicochemical Parameters and Heavy Metals of Public...
Comparative Analysis of Physicochemical Parameters and Heavy Metals of Public...Comparative Analysis of Physicochemical Parameters and Heavy Metals of Public...
Comparative Analysis of Physicochemical Parameters and Heavy Metals of Public...
 
Trace metals contamination of groundwater in and around tannery industrial ar...
Trace metals contamination of groundwater in and around tannery industrial ar...Trace metals contamination of groundwater in and around tannery industrial ar...
Trace metals contamination of groundwater in and around tannery industrial ar...
 
Impact on Aquatic Environment for Water Pollution in the Vahirab River
Impact on Aquatic Environment for Water Pollution in the Vahirab RiverImpact on Aquatic Environment for Water Pollution in the Vahirab River
Impact on Aquatic Environment for Water Pollution in the Vahirab River
 

International Journal of Engineering and Science Invention (IJESI)

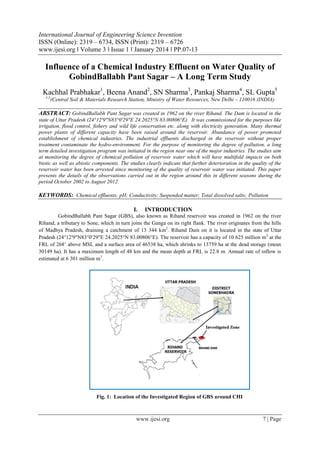
  • 1. International Journal of Engineering Science Invention ISSN (Online): 2319 – 6734, ISSN (Print): 2319 – 6726 www.ijesi.org ǁ Volume 3 ǁ Issue 1 ǁ January 2014 ǁ PP.07-13 Influence of a Chemical Industry Effluent on Water Quality of GobindBallabh Pant Sagar – A Long Term Study Kachhal Prabhakar1, Beena Anand2, SN Sharma3, Pankaj Sharma4, SL Gupta5 1-5 (Central Soil & Materials Research Station, Ministry of Water Resources, New Delhi – 110016 (INDIA) ABSTRACT: GobindBallabh Pant Sagar was created in 1962 on the river Rihand. The Dam is located in the state of Uttar Pradesh (24°12′9″N83°0′29″E 24.2025°N 83.00806°E). It was commissioned for the purposes like irrigation, flood control, fishery and wild life conservation etc. along with electricity generation. Many thermal power plants of different capacity have been raised around the reservoir. Abundance of power promoted establishment of chemical industries. The industrial effluents discharged in the reservoir without proper treatment contaminate the hydro-environment. For the purpose of monitoring the degree of pollution, a long term detailed investigation program was initiated in the region near one of the major industries. The studies aim at monitoring the degree of chemical pollution of reservoir water which will have multifold impacts on both biotic as well as abiotic components. The studies clearly indicate that further deterioration in the quality of the reservoir water has been arrested since monitoring of the quality of reservoir water was initiated. This paper presents the details of the observations carried out in the region around this in different seasons during the period October 2002 to August 2012. KEYWORDS: Chemical effluents; pH; Conductivity; Suspended matter; Total dissolved salts; Pollution I. INTRODUCTION GobindBallabh Pant Sagar (GBS), also known as Rihand reservoir was created in 1962 on the river Rihand, a tributary to Sone, which in turn joins the Ganga on its right flank. The river originates from the hills of Madhya Pradesh, draining a catchment of 13 344 km2. Rihand Dam on it is located in the state of Uttar Pradesh (24°12′9″N83°0′29″E 24.2025°N 83.00806°E). The reservoir has a capacity of 10 625 million m3 at the FRL of 268’ above MSL and a surface area of 46538 ha, which shrinks to 13759 ha at the dead storage (mean 30149 ha). It has a maximum length of 48 km and the mean depth at FRL is 22.8 m. Annual rate of inflow is estimated at 6 301 million m3. Fig. 1: Location of the Investigated Region of GBS around CHI www.ijesi.org 7 | Page
  • 2. Influence of a Chemical Industry Effluent… Large quantities of readily available reservoir water and the abundance of coal from nearby open cast mines led to the installation of a number of thermal power plants (TPP). Availability of power promoted many chemical industries around it. For the study the region around one of these chemical industries situated in northern region of GBS (CHI) (Fig 1) have been selected for carrying out observations. The CHI use water from reservoir for discharging its run off in the reservoir. The discharged effluents increase the percentage of suspended solids in the reservoir waters[1]. The contaminated water discharged from it in the reservoir increase the temperature of reservoir[1] and change the chemical composition of reservoir water [2]. For the purpose of monitoring the degree of pollution caused by CHI, a long term detailed investigation program was initiated. The study aims at long term monitoring and highlighting the degree of pollution of reservoir water so that measures to regulate it can be timely administered to arrest multifold impacts on both biotic as well as abiotic components. II. SALIENT FEATURES OF CHI The CHI is built aside GovindBallabh Pant Sagar Lake. It produces caustic soda on a very large scale. CHI is one of the leading industries in the chlor-alkali segment in India. III. ANTICIPATED PROBLEMS Some of the anticipated problems associated likely to be encountered in the project are     Increase in average temperature of the reservoir water. Change in pH of reservoir water over a long period of time. Change in the total dissolved salts (TDS) Increase in aggressivity of water which may affect the concrete structures. IV. FOCUS OF INVESTIGATION Continuous monitoring of the quality of water has been carried out for assessing degree and rate of contamination. Following important aspects were taken into consideration during investigation    Quality of water in the immediate vicinity of the confluence of effluents from CHI with the reservoir water . Quality of the chemical effluent water Identifying the effluent samples from CHI going into the reservoir and Reservoir water from various locations (RW) conforming/not conforming to Central Pollution Control Board of India (CPCB) standard for emission or discharge of environmental pollutants, in a ash pond [3] and ISI standards for potable water[4]Suspended solid contents and pH value of the effluent samples of CHI for pollution studies was carried out apart from determining other chemical parameters V. MATERIAL S AND METHODS Sampling location was selected for collection of CHI effluent and RW samples (Fig 1). During the period from October 2002 to August 2012 samples were collected during pre monsoon, monsoon and post monsoon periods. The samples were analyzed as per analytical procedure laid down in IS 3025-1986[5]. Wherever necessary, reference was also made to the procedure laid down by American Public Health Association and Water Pollution Control Federation, USA [6]. VI. FIELD INVESTIGATIONS The in situ parameters viz. pH, Conductivity, Temperature, CaCO3 Saturated pH, NH4+ and S2- of water samples collected from various locations were determined immediately after collection of each sample. VII. LABORATORY INVESTIGATIONS Detailed laboratory chemical analysis was carried out on water samples collected from various locations. Chloride, Sulphate, Bicarbonate, Carbonate, Calcium, Magnesium, Sodium, Potassium, Copper, Zinc, Manganese, Lead, Chromium and Iron content is determined using state of the Art equipment like www.ijesi.org 8 | Page
  • 3. Influence of a Chemical Industry Effluent… AtomicAbsorption Spectrophotometer,microprocessor based flame photometer, UV Visible Spectrophotometer etc. In addition, amount of suspended solids was also determined using gravimetric method. VIII. OBSERVATIONS 8.1 Temperature The observed insitu temperature for the CHI effluent RW samples collected during different seasons is presented in Fig. 2. CHI Effluent Temperature oC 50 Reservoir Water near CHI 40 30 20 10 Oct.2011 Aug. 2012 Oct. 2009 Oct. 2008 May. 2009 Mar. 2008 Aug. 2007 Jul. 2006 Sep. 2005 May. 2005 Oct. 2004 May. 2004 Nov. 2003 Jan. 2003 Jun. 2003 Oct. 2002 0 Fig. 2: Insitu Temperature of Samples collected in Different Seasons 8.2 pH values Aug. 2012 Oct.2011 Oct. 2009 May. 2009 Oct. 2008 Mar. 2008 Jul. 2006 Sep. 2005 Reservoir Water near CHI May. 2005 Oct. 2004 May. 2004 Nov. 2003 Jun. 2003 Jan. 2003 CHI Effluent Aug. 2007 12 11 10 9 8 7 6 5 4 Oct. 2002 pH pH values of CHI effluent and RW the samples is presented in Fig 3. Fig. 3: pH of Samples collected in Different Seasons 8.3 Conductivity values The conductivity value of CHI effluent and RW samples is presented in Fig 4. CHI Effluent x 10 Reservoir Water near CHI 800 600 400 200 Aug. 2012 Oct.2011 Oct. 2009 May. 2009 Oct. 2008 Mar. 2008 Aug. 2007 Jul. 2006 Sep. 2005 May. 2005 Oct. 2004 May. 2004 Jun. 2003 Nov. 2003 Jan. 2003 0 Oct. 2002 Conductivity (mmhos/cm) 1000 Fig. 4: Conductivity of Samples collected in Different Seasons www.ijesi.org 9 | Page
  • 4. Influence of a Chemical Industry Effluent… 8.4 Suspended solids The observed value for CHI effluent and RW presented in Fig. 5. CHI Effluents Suspended Solids (mg/lit) 200 Reservoir Water near CHI 160 120 80 40 Aug. 2012 Oct.2011 Oct. 2009 May. 2009 Oct. 2008 Mar. 2008 Aug. 2007 Jul. 2006 Sep. 2005 May. 2005 Oct. 2004 May. 2004 Nov. 2003 Oct. 2002 Jan. 2003 Jun. 2003 0 Fig. 5: Results of Suspended Solids in the Samples collected in Different Seasons 8.5 Chloride (Cl -) Chloride (Cl -) concentration in CHI effluent and RW samples is presented in Fig 6. Chloride (mg/lit) 100 CHI Effluent x 100 Reservoir Water near CHI 80 60 40 20 Aug. 2012 Oct.2011 Oct. 2009 May. 2009 Oct. 2008 Mar. 2008 Aug. 2007 Jul. 2006 Sep. 2005 May. 2005 Oct. 2004 May. 2004 Jun. 2003 Nov. 2003 Jan. 2003 Oct. 2002 0 Fig. 6: Results of Chloride Content in the Samples collected in Different Seasons 8.6 Sulphate (SO42-) Sulphate (SO42-) concentration in CHI effluent and RW samples are presented in Fig. 7 . Sulphate (mg/lit) 50 CHI Effluent x 10 Reservoir Water near CHI 40 30 20 10 Aug. 2012 Oct.2011 Oct. 2009 May. 2009 Oct. 2008 Mar. 2008 Aug. 2007 Jul. 2006 Sep. 2005 May. 2005 Oct. 2004 May. 2004 Nov. 2003 Jun. 2003 Jan. 2003 Oct. 2002 0 Fig. 7: Results of Sulphate Content in the Samples collected in Different Seasons www.ijesi.org 10 | Page
  • 5. Influence of a Chemical Industry Effluent… 8.7 Calcium (Ca2+) The Calcium (Ca2+) concentration for CHI effluent and RW samples is presented in Fig 8. Calcium (mg/lit) 50 CHI Effluent x 10 Reservoir Water near CHI 40 30 20 10 Aug. 2012 Oct.2011 Oct. 2009 May. 2009 Oct. 2008 Mar. 2008 Aug. 2007 Jul. 2006 Sep. 2005 May. 2005 Oct. 2004 May. 2004 Nov. 2003 Jun. 2003 Jan. 2003 Oct. 2002 0 Fig. 8: Results of Calcium Content in the Samples collected in Different Seasons 8.8 Magnesium (Mg2+) The Magnesium (Mg2+) concentration for CHI effluent and RW samples is presented in Fig 9. CHI Effluent x 10 Magnesium (mg/lit) 30 Reservoir Water near CHI 25 20 15 10 5 Aug. 2012 Oct.2011 Oct. 2009 May. 2009 Oct. 2008 Mar. 2008 Aug. 2007 Jul. 2006 Sep. 2005 May. 2005 Oct. 2004 May. 2004 Nov. 2003 Jun. 2003 Jan. 2003 Oct. 2002 0 Fig. 9: Results of Magnesium Content in the Samples collected in Different Seasons 8.9 Total dissolved salts The result of total dissolved salts for different samples is presented in Fig 10. CHI Effluent x 100 300 Reservoir Water near CHI TDS (mg/lit) 250 200 150 100 50 Aug. 2012 Oct.2011 Oct. 2009 May. 2009 Oct. 2008 Mar. 2008 Aug. 2007 Jul. 2006 Sep. 2005 May. 2005 Oct. 2004 May. 2004 Nov. 2003 Jun. 2003 Jan. 2003 Oct. 2002 0 Fig. 10: Results of Total Dissolved Solids in the Samples from Various Locations 8.10 Ammonium (NH4+) Ammonium content of water samples collected from various locations was found to be nil. The ammonia level of such water drastically reduces[2]. www.ijesi.org 11 | Page
  • 6. Influence of a Chemical Industry Effluent… 8.11 Copper, Manganese, Iron, Lead, Chromium and Zinc Heavy metals like copper, manganese, iron, lead, chromium, zinc are found absent or in very low concentration. IX. DISCUSSIONS OF RESULTS 9.1 Temperature The main ecological consequence of polluted water discharged by CHI into the aquatic ecosystem is increase in water temperature. Elevation of temperature of reservoir water by 8 to 10 °C[2] has been reported by many observers. During the period of observations the average temperature of the CHI effluent varied in the range 21.1 to 31.9°C and that of RW samples between 21.4 to 34.1°C. 9.2 Assessment of pH, suspended solids, conductivity, total dissolved salts and chloridewith respect to the standard parameters for discharge of environmental pollutants CHI effluent may cause pollution hazards and ecological damage in the reservoirs. Further it is high in total alkalinity, specific conductivity and chloride[1], [2]. Results of pH, suspended solids, conductivity, total dissolved salts and chloride for the tests conducted on the CHI effluents and RW samples [7, 8, 9, 10, 11] are discussed w.r.t standard values (Table 1). Table - 1 Assessment of TPP AS and RW Samples w. r. t. Recommended Standards Sample Parameter Observed range CPCB Samples Samples for the collected prescribed confirming exceeding samples limits[4]* and to CPCB or CPCB or ISI ISI prescribed ISI prescribed limits[5]** prescribed limits limits pH 7.1 – 10.9 6.5 – 8.5* 8 8 * CHI Suspended 9.6 – 189.0 100mg/l 11 5 Effluent solids, mg/l Conductivityμm hos/cm Total dissolved solid, mg/l Chloride, mg/l 1152 – 8720 15 - 16 4.0 – 13.10 200 mg/l** - 16 pH 6.85 – 8.96 6.5 – 8.5* 5 9 Conductivityμm hos/cm Total dissolved solid, mg/l Chloride, mg/l 71.3 – 205 14 - 28.8 – 152 Less than 1500 μmhos/cm** 500 mg/l. ** 14 - 2.8 – 20.0 200 mg/l** 13 - Suspended solids, mg/l RW 1 29.6 – 195.0 Less than 1500 μmhos/cm** 500 mg/l. ** 6.7 – 181.4 100mg/l* 11 2 X. CONCLUSION Sensing these concerns as raised by many authors a long term detailed investigation program was initiated for the purpose of monitoring the degree of pollution caused by ever growing industries. Constant monitoring of the hydro-environment in GBS in the region around CHI have arrested further deterioration in the quality of the reservoir water. www.ijesi.org 12 | Page
  • 7. Influence of a Chemical Industry Effluent… XI. ACKNOWLEDGEMENT The authors extend their sincere thanks to officers and staff of Concrete Chemistry Division of CSMRS and GBS Management authorities for the help extended by them. We also extend our sincere gratitude to all the authors whose publications provided us directional information from time to time. REFERENCES [1.] [2.] [3.] [4.] [5.] [6.] [7.] [8.] [9.] [10.] [11.] Chandra, K., R. S. Panwar and D. N. Singh, 1985. “Possible pollution problems from wastes of thermal power plants in India-A case study of Rihand Reservoir, Mirzapur (U.P.)”, Proceedings of the Symposium on Environmental Pollution, pp 283–294. Davies, I., 1966. “Chemical Changes in cooling water towers”.Int. J. Air Water Pollut., 10: 853. Central Pollution Control Board, India “Standards for Emission or Discharge of Environmental Pollutants, in a ash pond effluent - Pollution Control Acts, Rules and Notifications, 1996” A.M. Shaikh, P.N. Mandre, 2009 “Seasonal study of physico-chemical parameters of drinking water in khed ( lote ) industrial area”Shodh, SamikshaaurMulyankan , Vol. II, Issue-7, 169-171. IS 3025-1986 "Methods of Sampling and Test (Physical and Chemical) for Water used in the Industry”[American Public Health Association and Water Pollution Control Federation, USA, 1985 “Standard Methods for the Examination of Water and Waste Water” Central Soil and Materials Research Station, New Delhi, 2009 “Investigation report on the effect of pollutants from the thermal power plants/chemical factory on the quality of water in the dam reservoir and its effects on the concrete durability for Rihand dam project, UP.” Central Soil & Materials Research Station, New Delhi, October 2011, “Investigation report on “Chemical analysis of reservoir water, seepage water and ash slurry/effluent samples from Rihand Dam Project, UP”. Central Soil & Materials Research Station, New Delhi, August 2012 “Investigation report on “Chemical analysis of reservoir water, seepage water and ash slurry/effluent samples from Rihand Dam Project, UP”. Sharma Pankaj et al,” Monitoring The Contamination In The GobindBallabh Pant Sagar, Rihand, U.P. India” International Journal of Environmental Sciences, Volume 3, No 1, 2012 (487-497). Sharma SN, Sharma Pankaj, Pathak RP, “Effect of contamination on long term durability of Rihand Dam, U.P.-A case study” International Journal of Research in Chemistry and Environment, Volume 2 (4), October, 2012, (192-199). www.ijesi.org 13 | Page