SlideShare a Scribd company logo
1 of 8
Download to read offline
IOSR Journal of Computer Engineering (IOSR-JCE)
e-ISSN: 2278-0661,p-ISSN: 2278-8727, Volume 17, Issue 3, Ver. III (May – Jun. 2015), PP 09-16
www.iosrjournals.org
DOI: 10.9790/0661-17330916 www.iosrjournals.org 9 | Page
Creating a Vehicle Proportion, Form, and Color Matching Model
Shuntaro Toyoda1
, Yoshinori Nishio2
, Kakuro Amasaka3
1
(Graduate School of Science and Engineering, Aoyama Gakuin University, Japan)
2
(Faculty of Science and Engineering, Aoyama Gakuin University, Japan)
3
(Faculty of Science and Engineering, Aoyama Gakuin University, Japan)
Abstract: Product design in the manufacturing industry is one of the most critical elements influencing
consumer purchase behavior. As consumer values become increasingly diverse, design is becoming an
important element for automakers as well. To address this issue, the authors took a Customer Science approach,
creating supporting ideas for product development that capture the customers' sense. One original idea was
creating a Vehicle Proportion, Form, and Color Matching approach method, and the effectiveness of this tool
was then verified. The first step in the research process was to conduct a survey of sensory words and then
perform a principal component analysis and cluster analysis to identify the elements that influence vehicle
preference. Next, an eye camera and electroencephalograph (EEG) was used to analyze line of sight and
discover the areas that caught customers’ attention. The insights gained from these investigations were then
used to create 3D-CAD model cars with different proportions and forms, which were in turn analyzed using
experimental design (DE) and analytic hierarchy process (AHP) methods to identify ideal relationships among
proportion, form, and color. The effectiveness of the proposed model in supporting idea generation during
actual vehicle design and development was then verified.
Keywords: vehicle, Proportion, Form, Color, Matching Approach Model
I. Introduction
Product design in the manufacturing industry is one of the most critical elements influencing consumer
purchase behavior. As consumer values become increasingly diverse, design is becoming an important element
for automakers as well. Unfortunately, as people’s values and subjective preferences become more varied and
complex, it becomes increasingly difficult to accurately define their wants and needs. To address this issue, the
authors took a Customer Science approach, creating supporting ideas for product development that capture the
customers' sense. One original idea was creating a Vehicle Proportion, Form, and Color Matching approach
method, and the effectiveness of this tool was then verified. The first step in the research process was to conduct
a survey of sensory words and then perform a principal component analysis and cluster analysis to identify the
elements that influence vehicle preference. Next, an eye camera and electroencephalograph (EEG) was used to
analyze line of sight and discover the areas that caught customers’ attention. The insights gained from these
investigations were then used to create 3D-CAD model cars with different proportions and forms, which were in
turn analyzed using experimental design (DE) and analytic hierarchy process (AHP) methods to identify ideal
relationships among proportion, form, and color. The effectiveness of the proposed model in supporting idea
generation during actual vehicle design and development was then verified.
II. Background
The development of a Customer Science approach able to identify customer wants for the purpose of
market creation has become increasingly critical in recent years. The core challenge is using better overall
vehicle quality—in other words, employing statistics—as a means of scientifically (numerically) representing
the customers’ unspoken senses (customer preferences) in design work. Reforming this business process is
absolutely essential to successfully creating attractive vehicles.
Figure 1 shows the sensory elements of design work. It starts with the three elements (1) proportion
(profile design), (2) form, and (3) color. Recent design work strategies make it a point to optimize business
processes so that they are in line with the vehicle design concept from the product planning stage. Next, each
element must be matched: (4) proportion and form, (5) form and color, and (6) proportion and color. Finally, all
three elements—(7) proportion, form, and color—must be integrated harmoniously to address modern market
demands.
As an example of a business process innovation that addresses profile design (1), the authors
(Amasaka, 2005) applied the Customer Science approach to Lexus design work and used it to spur the
development of design. The authors have simultaneously reported examples of other innovations in form (2) and
color (3), while additional research examples have focused on proportion and form matching (4) and form and
color matching (5).
Creating a Vehicle Proportion, Form, and Color Matching Model
DOI: 10.9790/0661-17330916 www.iosrjournals.org 10 | Page
Based on the insights gained from the above research, the authors (Toyoda,Nishio, 2014)now
attempt to develop a Matching Approach Method to integrate proportion and color (6) as well as the three
elements (proportion, form, and color) together (7). Details are given in the following sections .
Fig 1. The sensory elements of design work
III. Developing A Vehicle Proportion, Form, And Color Matching Approach Model.
This study quantitatively determines the customers’ senses in order to clearly and rationally identify the
unspoken characteristics of vehicle design with the purpose of developing optimum proportion, form, and color
matching. The approach is shown in figure 2.
Fig 2. A vehicle proportion, form, and color matching model
3.1 Identifying Key Issues (STEP 0)
To better understand today’s auto industry, the authors began by conducting interviews with key
automakers and dealers as well as with customers. They also consulted prior research to see which issues had
already been addressed and which have yet to be clearly identified.
3.2 Customer Preference Survey (STEP 1)
The authors conducted a customer preference survey based on the key issues identified above. In this
step, customers were given a questionnaire to find out which vehicles they were interested in and to pinpoint the
main factors they considered when purchasing a vehicle. Once the data was collected, the authors subjected it to
a principal component analysis and a cluster analysis in order to quantitatively determine the relationships
among different customer senses.
3.3 Identifying Focus Areas (STEP 2)
In this step, the authors used the insights gained from the customer preference survey in STEP 1 to
recruit test subjects that resembled target customers. Once the test subjects were selected, they were each fitted
with an eye camera to analyze line-of-sight information. This told the authors where the subjects placed their
attention when looking at vehicles. At the same time, an electroencephalograph (EEG) was used to measure
brain waves. This device ascertained how the subjects were feeling when they looked at certain parts of the car.
Creating a Vehicle Proportion, Form, and Color Matching Model
DOI: 10.9790/0661-17330916 www.iosrjournals.org 11 | Page
3.4 Identifying the Relationship between Proportion and Form (STEP 3)
The authors continued to build upon the information gained in the previous steps in order to identify
the relationship between proportion and form, two of the critical elements in exterior automotive design. To do
this, they used 3D-CAD software to actually convert vehicle characteristics into numerical specifications, thus
actually creating the vehicle designs that customers want.
3.5 Identifying the Relationships among Proportion, Form, and Color (STEP 4)
The models designed in STEP 3 were then analyzed using statistics (Design of Experiments (DOE) and
AHP) to select the model that had the optimum combination of design elements.
3.6 Developing a Verification and Approach Model (STEP 5)
Finally, the authors evaluated the success of the model selected in STEP 4. Test subjects were again
fitted with EEG equipment as the authors compared their reactions to the selected model and other vehicle
designs. The effectiveness of the model developed using their approach method was thus confirmed.
IV. Application: Development And Effectiveness Of The Vehicle Proportion, Form,
And Color Matching Approach Model.
The development of the Vehicle Proportion, Form, and Color Matching Approach Model outlined in
the previous section was applied to young men in their 20s to see whether the model selected by the method
would match their preferences. The effectiveness of the research was thus confirmed.
4.1 Customer Preference Survey (STEP 1)
In order to identify the current state of vehicle sales and design, the authors conducted interviews
between June and August with automotive companies (Nissan, Toyota, Honda), design firms (Kansai pain,
Toyota design institute), dealers (Netz Toyota Fuchinobe), and customers (51 men in their 20s) to find out what
they prioritized when building cars and/or the kinds of cars they hoped to drive. The interviews revealed a gap
between the vehicle concepts held by automotive companies and design firms on the one hand, and the look of
the vehicles that customers wanted.
Interviews with dealers also revealed that customer demands were not being sufficiently addressed.
One of the reasons for the key issues identified in the interviews was that customer demands were often
unexpressed and therefore difficult to identify. The authors thus sought to develop the Vehicle Proportion,
Form, and Color Matching Approach Method based on customers’ senses with the idea of clearly, rationally,
and numerically identifying previously unspoken customer desires. The model was then used to help resolve the
key issues listed above.
Table 1. The factor loading
Variable Name
Principle Component
Scores 1
Principle Component
Scores 2
1 0.572 -0.208
2 0.094 0.252
3 0.521 -0.562
4 0.709 0.303
5 0.825 -0.002
6 0.343 0.055
7 0.277 -0.592
8 0.263 0.304
9 0.700 0.202
10 0.409 -0.446
11 0.533 -0.420
12 0.359 0.644
13 0.615 0.052
14 0.448 -0.142
15 0.531 0.295
16 0.361 -0.253
17 0.748 -0.017
18 0.295 -0.028
19 0.780 0.113
Creating a Vehicle Proportion, Form, and Color Matching Model
DOI: 10.9790/0661-17330916 www.iosrjournals.org 12 | Page
Table 2. Principle component scores
Sample Name
Principle Component
Scores 1
Principle Component
Scores 2
Refined 1.141 0.266
Traditional -1.469 0.820
Eye-catching -1.265 -1.717
Smart -0.025 0.804
Modern -0.268 -1.956
Calm 0.138 1.342
Orthodox -0.946 1.529
Individual -*0.143 -1.635
Roundish -1.136 0.028
Advanced 0.862 -0.650
Sporty 0.443 -0.179
Luxurious 1.291 0.140
Sophisticated 1.203 0.460
Stylish 1.226 -0.034
Compact -0.843 0.939
Square -1.373 0.352
Practical 0.389 0.874
Feeling of oppression -0.841 0.238
Cool 1.841 -0.194
Youthful 0.218 0.139
Showy -0.433 -1.567
The first step was to survey young men in their 20s and subject the collected data to a principal
component analysis and a cluster analysis. Tables 1 and 2 show the factor loading and principle component
scores from the principal component analysis; these were used to identify 21 sensory words (refined, eye-
catching, traditional, etc.) and the correlations among them as well as to assign meaning to the principle
components.
Figure 3 shows the subjects categorized into five purchase behavior groups based on the cluster
analysis: (1) disinterested, (2) functionality-oriented, (3) self-expression-oriented, (4) outward appearance–
oriented, and (5) practicality-oriented. The self-expression and outward appearance group were combined into
an ―exterior design-oriented‖ group and selected as targets for further research. To identify more specifically the
core preferences of these customers, the cluster analysis data was transposed and sensory words for the exterior
design group were summarized into five clusters (see figure 4).
In line with the results of the principal component analysis, it was found that four sensory words from
the clusters (luxurious, sophisticated, stylish, and cool) represent the demands of the members of the exterior
design group.
Fig 3. Five purchase behavior groups based on the cluster analysis
Creating a Vehicle Proportion, Form, and Color Matching Model
DOI: 10.9790/0661-17330916 www.iosrjournals.org 13 | Page
Fig 4. Identify more specifically the core preferences of these customers
In line with the results of the principal component analysis, it was found that four sensory words from
the clusters (luxurious, sophisticated, stylish, and cool) represent the demands of the members of the exterior
design group.
4.2 Identifying Focus Areas (STEP 2)
During this step, male subjects in their 20s were fitted with optical cameras and EEG equipment for
testing. The optical cameras measured line-of-sight information using a camera mounted on a headpiece as well
as a camera that detects pupil movement. The areas viewed by the subjects are shown in red marker in figure 5,
providing quantitative information on where they were looking. The EEG is a device that measures electrical
signals emitted from each part of the cerebrum, and allows researchers to predict correlations between human
behavior and brain activity. Figure 6 shows the alpha waves measured with the EEG equipment. The solid red
line represents high alpha waves, while the blue line represents low alpha waves. The size of these values makes
it possible to quantitatively determine the parts of the vehicle subjects were giving the most attention.
Fig 5. Providing quantitative information on where they were looking
Fig 6. The alpha waves measured with the EEG equipment
Creating a Vehicle Proportion, Form, and Color Matching Model
DOI: 10.9790/0661-17330916 www.iosrjournals.org 14 | Page
4.3 Identifying the Relationship between Proportion and Form (STEP 3)
The authors next used 3D-CAD software to actually design a vehicle exterior that reflected the critical
proportion and form element as indicated in the results obtained above (see figure 7). The study used a mid-size
sedan and selected standard proportion and form dimensions based on collections of dimensional body drawings
from Jidosha Koronsha (see table 3) and then numerically represented them at three levels. The authors then
created models that combined different front (length of the front windshield, edge and groove lines), side (hood
bulge, strength of character lines), and rear (C pillar angle, rear bumper width) form elements.
Fig 7. Designing a vehicle exterior that reflected the critical proportion and form element
Table 3. Selected standard proportion and form dimensions
Model length of the front windshield hood bulge edge and groove lines
A 730 40 40
B 655 25 15
C 805 25 15
D 655 50 15
E 805 50 15
F 655 25 45
G 805 25 45
H 655 50 45
I 805 50 45
4.4 Identifying the Relationships among Proportion, Form, and Color (STEP 4)
The nine models designed in STEP 3 were analyzed using Design of Experiments (DOE) to determine
the optimum combination of design elements. As shown in table 4, the analysis revealed that factor A (length of
the front windshield), factor B (hood bulge), factor C (edge and groove lines), and the interplay between factors
B and C had a 5% significance—indicating that shallow edge and groove lines were more significant than
differences in hood bulge. Similarly, table 5 shows that when it came to the side areas, the interplay between the
strength of the character lines and the angle of the A pillar also had a 5% significance. These results allowed the
authors to identify two front patterns, one side pattern, and one rear pattern.
Table 4. Analysis result (Front part)
Factor Sum of Squares Flexibility Variance Variance Ratio Test
A 20.816 1 20.816 21.575 **
B 11.391 1 11.391 11.806 **
C 5.348 1 5.348 5.543 *
AB 0.660 1 0.660 0.684
AC 1.266 1 1.266 1.312
BC 7.223 1 7.223 7.486 *
ABC 2.250 1 2.250 2.332
Error 7.719 8 0.965 0.558
Creating a Vehicle Proportion, Form, and Color Matching Model
DOI: 10.9790/0661-17330916 www.iosrjournals.org 15 | Page
Table 5. Analysis result (Side part)
Factor Sum of Squares Flexibility Variance Variance Ratio Test
A 3.754 1 3.754 2.099
B 10.160 1 10.160 5.682 *
C 14.063 1 14.063 7.864 *
AB 1.129 1 1.129 0.631
AC 1.266 1 1.266 0.708
BC 16.000 1 16.000 8.948 *
Error 16.094 9 1.788 1.042
Three colors (black, white, red) were added to the model to create six alternatives (Type A, Type B ,
Type C, Type D, Type E, Type F). They were then subjected to an analytic hierarchy process (AHP) in order to
identify the model that optimally matched the sensory words that represent the demands of the exterior design
group. Models created using 3D-CAD software were given to subjects to visually compare using a paired
comparison method in order to assign priority levels to the different standards and alternatives. The test
subjects’ subjective responses were gathered using a questionnaire. Table 6 shows the relative priority of each
standard (sensory word) and alternative (CAD model). This information was then comprehensively evaluated to
identify the model with the best proportion, form, and color combination.
Table 6. The relative priority (Standard)
Subject Alternative 1 Alternative 2 Alternative 3 Alternative 4 Alternative 5 Alternative 6
1 0.13 0.17 0.12 0.10 0.16 0.32
2 0.13 0.15 0.10 0.13 0.18 0.30
3 0.09 0.10 0.26 0.39 0.06 0.11
4 0.25 0.29 0.03 0.04 0.15 0.24
5 0.33 0.31 0.19 0.09 0.02 0.06
6 0.31 0.34 0.16 0.10 0.06 0.03
7 0.31 0.34 0.16 0.10 0.06 0.03
8 0.06 0.11 0.08 0.07 0.21 0.48
9 0.17 0.16 0.06 0.08 0.31 0.21
10 0.19 0.23 0.09 0.25 0.11 0.13
The analysis indicated that among young men in their 20s within the exterior design group (the target
of the study), two models created using this method (Type B, Type F) received the highest evaluation score of
0.21 (see figure 8). The results indicate that the Type B model, with a front windshield length of 805 mm, a
hood bulge of 50º, edge and groove lines of 45º, emphasized strong character lines, an A pillar angle of 30º, and
black paint, has the ―cool‖ sensory word as its main focus. The Type F model had the same proportions and
form as Type B in red, and has the ―luxurious‖ sensory word as its main focus.
Fig 8. Two models created using this method (Type B, Type F)
4.5 Verification, Creating a Vehicle Matching Approach Model (STEP 5)
The models identified in STEP 4 were verified, and the authors were then able to develop the Vehicle
Proportion, Form, and Color Matching Approach Model. Here, EEG equipment was used to measure the
subjects’ alpha waves as they looked in random order at the models they were asked about in the STEP 4
questionnaire. Figure 9 shows the results of this test; namely, that the models triggering the highest alpha wave
Creating a Vehicle Proportion, Form, and Color Matching Model
DOI: 10.9790/0661-17330916 www.iosrjournals.org 16 | Page
values were the same models that the study predicted through the Matching Approach Model. The effectiveness
of the model was thus confirmed.
V. Conclusion
This study focused on three vehicle design elements that were handled separately in the past
(proportion, form, and color) and attempted to match them all while pinpointing their correlations to customer
senses. In order to get this information, the authors made full use of statistical tools (multivariate analysis, DOE,
AHP), optical cameras, EEG equipment, and 3D-CAD software to develop a Matching Approach Model. Their
research demonstrated that this model can be used to clearly and rationally identify previously unspoken
customer senses. In future studies, the effectiveness of the model will be tested with other age groups as well.
References
Journal Papers:
[1]. Amasaka, K., (2002), New JIT, A New Management Technology Principle at Toyota, International Journal of Production
Economics, Vol. 80, pp.135-144.
[2]. Amasaka, K., (2005), Constructing a Customer Science Application System ―CS-CIANS‖- Development of a Global Strategic
Vehicle ―Lexus‖ Utilizing New JIT –, WSEAS (World Scientific and Transactions on Business and Economics, Issue3, Vol.2,
pp.135-142.
[3]. Asami, H., Owada, H., Murata, Y., Takebuchi, S. and Amasaka, K. (2008), The A-VEDAM Model for Approaching Vehicle
Exterior Design, Journal of Business Case Studies, Vol. 7, No. 5,.pp.1-8.
[4]. Asami, H., Ando, T., Yamaji,M. and Amasaka, K. (2010), A Study on Automobile Form Design Support Method ―AFD-SM‖,
The Journal of Business & Economics Research, Vol.8, No.11, pp. 13-19.
[5]. Muto, M., Miyake, R. and Amasaka, K. (2011), Constructing an Automobile Body Color Development Approach Model, Journal of
Management Science, Vol.2, pp. 175-183.
[6]. Takebuchi, S., Asami, H. and Amasaka, K. (2012), An Automobile Exterior Design Approach Model Linking Form and Color,
China-USA Business Review, Vol.11, No.8, pp. 1113-1123.
[7]. Muto, M., Takebuchi, S. and Amasaka, K. (2013), Creating A New Automotive Exterior Design Approach Model -The
Relationship Between Form and Body Color Qualities-, Journal of Business Case Studies, Vol.9 No.5, pp. 367-374
Books:
[8]. Amasaka, K., (2004), Science SQC, New Quality Control Principle: The Quality Strategy of Toyota」, Springer.
[9]. Amasaka, K. ed., (2012), Science TQM, New Quality Management Principle: The Quality Management Strategy of Toyota」
Bentham e-Books: Bentham Science Publisher.
[10]. Amasaka, K., (2014), New JIT, New Management Technology Principle, Tayler and Francis Group (Forthcoming).

More Related Content

Viewers also liked

Evaluation of titanium in hydrochloric acid solutions containing corrosion in...
Evaluation of titanium in hydrochloric acid solutions containing corrosion in...Evaluation of titanium in hydrochloric acid solutions containing corrosion in...
Evaluation of titanium in hydrochloric acid solutions containing corrosion in...IOSR Journals
 
Enhance the Throughput of Wireless Network Using Multicast Routing
Enhance the Throughput of Wireless Network Using Multicast RoutingEnhance the Throughput of Wireless Network Using Multicast Routing
Enhance the Throughput of Wireless Network Using Multicast RoutingIOSR Journals
 
Thermal conductivity Characterization of Bamboo fiber reinforced in Epoxy Resin
Thermal conductivity Characterization of Bamboo fiber reinforced in Epoxy ResinThermal conductivity Characterization of Bamboo fiber reinforced in Epoxy Resin
Thermal conductivity Characterization of Bamboo fiber reinforced in Epoxy ResinIOSR Journals
 
A New Speech Enhancement Technique to Reduce Residual Noise Using Perceptual ...
A New Speech Enhancement Technique to Reduce Residual Noise Using Perceptual ...A New Speech Enhancement Technique to Reduce Residual Noise Using Perceptual ...
A New Speech Enhancement Technique to Reduce Residual Noise Using Perceptual ...IOSR Journals
 
Flower Classification Using Neural Network Based Image Processing
Flower Classification Using Neural Network Based Image ProcessingFlower Classification Using Neural Network Based Image Processing
Flower Classification Using Neural Network Based Image ProcessingIOSR Journals
 
Polymer Concrete Made With Recycled Glass Aggregates, Flyash and Metakaolin
Polymer Concrete Made With Recycled Glass Aggregates, Flyash and MetakaolinPolymer Concrete Made With Recycled Glass Aggregates, Flyash and Metakaolin
Polymer Concrete Made With Recycled Glass Aggregates, Flyash and MetakaolinIOSR Journals
 
Static and Dynamic Behavior of Reinforced Concrete Framed Building: A Compara...
Static and Dynamic Behavior of Reinforced Concrete Framed Building: A Compara...Static and Dynamic Behavior of Reinforced Concrete Framed Building: A Compara...
Static and Dynamic Behavior of Reinforced Concrete Framed Building: A Compara...IOSR Journals
 

Viewers also liked (20)

Evaluation of titanium in hydrochloric acid solutions containing corrosion in...
Evaluation of titanium in hydrochloric acid solutions containing corrosion in...Evaluation of titanium in hydrochloric acid solutions containing corrosion in...
Evaluation of titanium in hydrochloric acid solutions containing corrosion in...
 
Enhance the Throughput of Wireless Network Using Multicast Routing
Enhance the Throughput of Wireless Network Using Multicast RoutingEnhance the Throughput of Wireless Network Using Multicast Routing
Enhance the Throughput of Wireless Network Using Multicast Routing
 
I010324954
I010324954I010324954
I010324954
 
N1304029496
N1304029496N1304029496
N1304029496
 
P01262101104
P01262101104P01262101104
P01262101104
 
B1303040911
B1303040911B1303040911
B1303040911
 
M010128086
M010128086M010128086
M010128086
 
K017135461
K017135461K017135461
K017135461
 
J010125765
J010125765J010125765
J010125765
 
G1302034147
G1302034147G1302034147
G1302034147
 
R01732105109
R01732105109R01732105109
R01732105109
 
E012513749
E012513749E012513749
E012513749
 
F017353539
F017353539F017353539
F017353539
 
G017143640
G017143640G017143640
G017143640
 
Thermal conductivity Characterization of Bamboo fiber reinforced in Epoxy Resin
Thermal conductivity Characterization of Bamboo fiber reinforced in Epoxy ResinThermal conductivity Characterization of Bamboo fiber reinforced in Epoxy Resin
Thermal conductivity Characterization of Bamboo fiber reinforced in Epoxy Resin
 
A New Speech Enhancement Technique to Reduce Residual Noise Using Perceptual ...
A New Speech Enhancement Technique to Reduce Residual Noise Using Perceptual ...A New Speech Enhancement Technique to Reduce Residual Noise Using Perceptual ...
A New Speech Enhancement Technique to Reduce Residual Noise Using Perceptual ...
 
Flower Classification Using Neural Network Based Image Processing
Flower Classification Using Neural Network Based Image ProcessingFlower Classification Using Neural Network Based Image Processing
Flower Classification Using Neural Network Based Image Processing
 
Polymer Concrete Made With Recycled Glass Aggregates, Flyash and Metakaolin
Polymer Concrete Made With Recycled Glass Aggregates, Flyash and MetakaolinPolymer Concrete Made With Recycled Glass Aggregates, Flyash and Metakaolin
Polymer Concrete Made With Recycled Glass Aggregates, Flyash and Metakaolin
 
Static and Dynamic Behavior of Reinforced Concrete Framed Building: A Compara...
Static and Dynamic Behavior of Reinforced Concrete Framed Building: A Compara...Static and Dynamic Behavior of Reinforced Concrete Framed Building: A Compara...
Static and Dynamic Behavior of Reinforced Concrete Framed Building: A Compara...
 
S130403131140
S130403131140S130403131140
S130403131140
 

Similar to B017330916

Innovation in product form and function: customer perception of their value
Innovation in product form and function: customer perception of their valueInnovation in product form and function: customer perception of their value
Innovation in product form and function: customer perception of their valueGurdal Ertek
 
Innovation in Product Form And Function: Customer Perception Of Their Value
Innovation in Product Form And Function: Customer Perception Of Their ValueInnovation in Product Form And Function: Customer Perception Of Their Value
Innovation in Product Form And Function: Customer Perception Of Their Valueertekg
 
Creating a Bicycle Design Approach Model Based on Fashion Styles
Creating a Bicycle Design Approach Model Based on Fashion StylesCreating a Bicycle Design Approach Model Based on Fashion Styles
Creating a Bicycle Design Approach Model Based on Fashion Stylesiosrjce
 
A Study of Customer Purchasing Behaviour of Automobiles in Kukatpally, Hyderabad
A Study of Customer Purchasing Behaviour of Automobiles in Kukatpally, HyderabadA Study of Customer Purchasing Behaviour of Automobiles in Kukatpally, Hyderabad
A Study of Customer Purchasing Behaviour of Automobiles in Kukatpally, Hyderabadijtsrd
 
Dissertation on car market and buying behavior a study of consumer perception
Dissertation on car market and buying behavior a study of  consumer perceptionDissertation on car market and buying behavior a study of  consumer perception
Dissertation on car market and buying behavior a study of consumer perceptionProjects Kart
 
Analyzing target user group¡¦s preferences and product form design specificat...
Analyzing target user group¡¦s preferences and product form design specificat...Analyzing target user group¡¦s preferences and product form design specificat...
Analyzing target user group¡¦s preferences and product form design specificat...Waqas Tariq
 
An Analysis to Determine the Priority Emotional Design in Kansei Engineering ...
An Analysis to Determine the Priority Emotional Design in Kansei Engineering ...An Analysis to Determine the Priority Emotional Design in Kansei Engineering ...
An Analysis to Determine the Priority Emotional Design in Kansei Engineering ...Dr. Amarjeet Singh
 
selection of representative kansei adjectives using cluster analysis a case ...
selection of representative kansei adjectives using cluster analysis  a case ...selection of representative kansei adjectives using cluster analysis  a case ...
selection of representative kansei adjectives using cluster analysis a case ...INFOGAIN PUBLICATION
 
Video Commercial Image Preference Study Through The Web Analytical Tool
Video Commercial Image Preference Study Through The Web Analytical ToolVideo Commercial Image Preference Study Through The Web Analytical Tool
Video Commercial Image Preference Study Through The Web Analytical ToolCSCJournals
 
Analysis of Research in Consumer Behavior of Automobile Passenger Car Customer
Analysis of Research in Consumer Behavior  of Automobile Passenger Car CustomerAnalysis of Research in Consumer Behavior  of Automobile Passenger Car Customer
Analysis of Research in Consumer Behavior of Automobile Passenger Car CustomerGagan Gouda
 
A study of consumer behavior on small cars
A study of consumer behavior on small carsA study of consumer behavior on small cars
A study of consumer behavior on small carsProjects Kart
 
A usability evaluation framework for b2 c e commerce websites
A usability evaluation framework for b2 c e commerce websitesA usability evaluation framework for b2 c e commerce websites
A usability evaluation framework for b2 c e commerce websitesAlexander Decker
 
A usability evaluation framework for b2 c e commerce websites
A usability evaluation framework for b2 c e commerce websitesA usability evaluation framework for b2 c e commerce websites
A usability evaluation framework for b2 c e commerce websitesAlexander Decker
 
Cutting through Social Media noise to better understand customer sentiment an...
Cutting through Social Media noise to better understand customer sentiment an...Cutting through Social Media noise to better understand customer sentiment an...
Cutting through Social Media noise to better understand customer sentiment an...Anup Deshmukh
 
Car Recommendation System Using Customer Reviews
Car Recommendation System Using Customer ReviewsCar Recommendation System Using Customer Reviews
Car Recommendation System Using Customer ReviewsIRJET Journal
 
How digital marketing creates user engagement in xetlynx autocorp
How digital marketing creates user engagement in xetlynx autocorpHow digital marketing creates user engagement in xetlynx autocorp
How digital marketing creates user engagement in xetlynx autocorpPriyansh Kesarwani
 

Similar to B017330916 (20)

Innovation in product form and function: customer perception of their value
Innovation in product form and function: customer perception of their valueInnovation in product form and function: customer perception of their value
Innovation in product form and function: customer perception of their value
 
Innovation in Product Form And Function: Customer Perception Of Their Value
Innovation in Product Form And Function: Customer Perception Of Their ValueInnovation in Product Form And Function: Customer Perception Of Their Value
Innovation in Product Form And Function: Customer Perception Of Their Value
 
A017370108
A017370108A017370108
A017370108
 
Creating a Bicycle Design Approach Model Based on Fashion Styles
Creating a Bicycle Design Approach Model Based on Fashion StylesCreating a Bicycle Design Approach Model Based on Fashion Styles
Creating a Bicycle Design Approach Model Based on Fashion Styles
 
A Study of Customer Purchasing Behaviour of Automobiles in Kukatpally, Hyderabad
A Study of Customer Purchasing Behaviour of Automobiles in Kukatpally, HyderabadA Study of Customer Purchasing Behaviour of Automobiles in Kukatpally, Hyderabad
A Study of Customer Purchasing Behaviour of Automobiles in Kukatpally, Hyderabad
 
Dissertation on car market and buying behavior a study of consumer perception
Dissertation on car market and buying behavior a study of  consumer perceptionDissertation on car market and buying behavior a study of  consumer perception
Dissertation on car market and buying behavior a study of consumer perception
 
Analyzing target user group¡¦s preferences and product form design specificat...
Analyzing target user group¡¦s preferences and product form design specificat...Analyzing target user group¡¦s preferences and product form design specificat...
Analyzing target user group¡¦s preferences and product form design specificat...
 
An Analysis to Determine the Priority Emotional Design in Kansei Engineering ...
An Analysis to Determine the Priority Emotional Design in Kansei Engineering ...An Analysis to Determine the Priority Emotional Design in Kansei Engineering ...
An Analysis to Determine the Priority Emotional Design in Kansei Engineering ...
 
selection of representative kansei adjectives using cluster analysis a case ...
selection of representative kansei adjectives using cluster analysis  a case ...selection of representative kansei adjectives using cluster analysis  a case ...
selection of representative kansei adjectives using cluster analysis a case ...
 
Video Commercial Image Preference Study Through The Web Analytical Tool
Video Commercial Image Preference Study Through The Web Analytical ToolVideo Commercial Image Preference Study Through The Web Analytical Tool
Video Commercial Image Preference Study Through The Web Analytical Tool
 
Analysis of Research in Consumer Behavior of Automobile Passenger Car Customer
Analysis of Research in Consumer Behavior  of Automobile Passenger Car CustomerAnalysis of Research in Consumer Behavior  of Automobile Passenger Car Customer
Analysis of Research in Consumer Behavior of Automobile Passenger Car Customer
 
Synopsis
SynopsisSynopsis
Synopsis
 
CheskinWork
CheskinWorkCheskinWork
CheskinWork
 
A study of consumer behavior on small cars
A study of consumer behavior on small carsA study of consumer behavior on small cars
A study of consumer behavior on small cars
 
A usability evaluation framework for b2 c e commerce websites
A usability evaluation framework for b2 c e commerce websitesA usability evaluation framework for b2 c e commerce websites
A usability evaluation framework for b2 c e commerce websites
 
A usability evaluation framework for b2 c e commerce websites
A usability evaluation framework for b2 c e commerce websitesA usability evaluation framework for b2 c e commerce websites
A usability evaluation framework for b2 c e commerce websites
 
Cs
CsCs
Cs
 
Cutting through Social Media noise to better understand customer sentiment an...
Cutting through Social Media noise to better understand customer sentiment an...Cutting through Social Media noise to better understand customer sentiment an...
Cutting through Social Media noise to better understand customer sentiment an...
 
Car Recommendation System Using Customer Reviews
Car Recommendation System Using Customer ReviewsCar Recommendation System Using Customer Reviews
Car Recommendation System Using Customer Reviews
 
How digital marketing creates user engagement in xetlynx autocorp
How digital marketing creates user engagement in xetlynx autocorpHow digital marketing creates user engagement in xetlynx autocorp
How digital marketing creates user engagement in xetlynx autocorp
 

More from IOSR Journals (20)

A011140104
A011140104A011140104
A011140104
 
M0111397100
M0111397100M0111397100
M0111397100
 
L011138596
L011138596L011138596
L011138596
 
K011138084
K011138084K011138084
K011138084
 
J011137479
J011137479J011137479
J011137479
 
I011136673
I011136673I011136673
I011136673
 
G011134454
G011134454G011134454
G011134454
 
H011135565
H011135565H011135565
H011135565
 
F011134043
F011134043F011134043
F011134043
 
E011133639
E011133639E011133639
E011133639
 
D011132635
D011132635D011132635
D011132635
 
C011131925
C011131925C011131925
C011131925
 
B011130918
B011130918B011130918
B011130918
 
A011130108
A011130108A011130108
A011130108
 
I011125160
I011125160I011125160
I011125160
 
H011124050
H011124050H011124050
H011124050
 
G011123539
G011123539G011123539
G011123539
 
F011123134
F011123134F011123134
F011123134
 
E011122530
E011122530E011122530
E011122530
 
D011121524
D011121524D011121524
D011121524
 

Recently uploaded

Beyond Boundaries: Leveraging No-Code Solutions for Industry Innovation
Beyond Boundaries: Leveraging No-Code Solutions for Industry InnovationBeyond Boundaries: Leveraging No-Code Solutions for Industry Innovation
Beyond Boundaries: Leveraging No-Code Solutions for Industry InnovationSafe Software
 
Designing IA for AI - Information Architecture Conference 2024
Designing IA for AI - Information Architecture Conference 2024Designing IA for AI - Information Architecture Conference 2024
Designing IA for AI - Information Architecture Conference 2024Enterprise Knowledge
 
Injustice - Developers Among Us (SciFiDevCon 2024)
Injustice - Developers Among Us (SciFiDevCon 2024)Injustice - Developers Among Us (SciFiDevCon 2024)
Injustice - Developers Among Us (SciFiDevCon 2024)Allon Mureinik
 
FULL ENJOY 🔝 8264348440 🔝 Call Girls in Diplomatic Enclave | Delhi
FULL ENJOY 🔝 8264348440 🔝 Call Girls in Diplomatic Enclave | DelhiFULL ENJOY 🔝 8264348440 🔝 Call Girls in Diplomatic Enclave | Delhi
FULL ENJOY 🔝 8264348440 🔝 Call Girls in Diplomatic Enclave | Delhisoniya singh
 
AI as an Interface for Commercial Buildings
AI as an Interface for Commercial BuildingsAI as an Interface for Commercial Buildings
AI as an Interface for Commercial BuildingsMemoori
 
CloudStudio User manual (basic edition):
CloudStudio User manual (basic edition):CloudStudio User manual (basic edition):
CloudStudio User manual (basic edition):comworks
 
Streamlining Python Development: A Guide to a Modern Project Setup
Streamlining Python Development: A Guide to a Modern Project SetupStreamlining Python Development: A Guide to a Modern Project Setup
Streamlining Python Development: A Guide to a Modern Project SetupFlorian Wilhelm
 
08448380779 Call Girls In Diplomatic Enclave Women Seeking Men
08448380779 Call Girls In Diplomatic Enclave Women Seeking Men08448380779 Call Girls In Diplomatic Enclave Women Seeking Men
08448380779 Call Girls In Diplomatic Enclave Women Seeking MenDelhi Call girls
 
Install Stable Diffusion in windows machine
Install Stable Diffusion in windows machineInstall Stable Diffusion in windows machine
Install Stable Diffusion in windows machinePadma Pradeep
 
Automating Business Process via MuleSoft Composer | Bangalore MuleSoft Meetup...
Automating Business Process via MuleSoft Composer | Bangalore MuleSoft Meetup...Automating Business Process via MuleSoft Composer | Bangalore MuleSoft Meetup...
Automating Business Process via MuleSoft Composer | Bangalore MuleSoft Meetup...shyamraj55
 
Connect Wave/ connectwave Pitch Deck Presentation
Connect Wave/ connectwave Pitch Deck PresentationConnect Wave/ connectwave Pitch Deck Presentation
Connect Wave/ connectwave Pitch Deck PresentationSlibray Presentation
 
Unlocking the Potential of the Cloud for IBM Power Systems
Unlocking the Potential of the Cloud for IBM Power SystemsUnlocking the Potential of the Cloud for IBM Power Systems
Unlocking the Potential of the Cloud for IBM Power SystemsPrecisely
 
"LLMs for Python Engineers: Advanced Data Analysis and Semantic Kernel",Oleks...
"LLMs for Python Engineers: Advanced Data Analysis and Semantic Kernel",Oleks..."LLMs for Python Engineers: Advanced Data Analysis and Semantic Kernel",Oleks...
"LLMs for Python Engineers: Advanced Data Analysis and Semantic Kernel",Oleks...Fwdays
 
Maximizing Board Effectiveness 2024 Webinar.pptx
Maximizing Board Effectiveness 2024 Webinar.pptxMaximizing Board Effectiveness 2024 Webinar.pptx
Maximizing Board Effectiveness 2024 Webinar.pptxOnBoard
 
Scanning the Internet for External Cloud Exposures via SSL Certs
Scanning the Internet for External Cloud Exposures via SSL CertsScanning the Internet for External Cloud Exposures via SSL Certs
Scanning the Internet for External Cloud Exposures via SSL CertsRizwan Syed
 
Presentation on how to chat with PDF using ChatGPT code interpreter
Presentation on how to chat with PDF using ChatGPT code interpreterPresentation on how to chat with PDF using ChatGPT code interpreter
Presentation on how to chat with PDF using ChatGPT code interpreternaman860154
 
Transcript: New from BookNet Canada for 2024: BNC BiblioShare - Tech Forum 2024
Transcript: New from BookNet Canada for 2024: BNC BiblioShare - Tech Forum 2024Transcript: New from BookNet Canada for 2024: BNC BiblioShare - Tech Forum 2024
Transcript: New from BookNet Canada for 2024: BNC BiblioShare - Tech Forum 2024BookNet Canada
 
Enhancing Worker Digital Experience: A Hands-on Workshop for Partners
Enhancing Worker Digital Experience: A Hands-on Workshop for PartnersEnhancing Worker Digital Experience: A Hands-on Workshop for Partners
Enhancing Worker Digital Experience: A Hands-on Workshop for PartnersThousandEyes
 
Unleash Your Potential - Namagunga Girls Coding Club
Unleash Your Potential - Namagunga Girls Coding ClubUnleash Your Potential - Namagunga Girls Coding Club
Unleash Your Potential - Namagunga Girls Coding ClubKalema Edgar
 
Are Multi-Cloud and Serverless Good or Bad?
Are Multi-Cloud and Serverless Good or Bad?Are Multi-Cloud and Serverless Good or Bad?
Are Multi-Cloud and Serverless Good or Bad?Mattias Andersson
 

Recently uploaded (20)

Beyond Boundaries: Leveraging No-Code Solutions for Industry Innovation
Beyond Boundaries: Leveraging No-Code Solutions for Industry InnovationBeyond Boundaries: Leveraging No-Code Solutions for Industry Innovation
Beyond Boundaries: Leveraging No-Code Solutions for Industry Innovation
 
Designing IA for AI - Information Architecture Conference 2024
Designing IA for AI - Information Architecture Conference 2024Designing IA for AI - Information Architecture Conference 2024
Designing IA for AI - Information Architecture Conference 2024
 
Injustice - Developers Among Us (SciFiDevCon 2024)
Injustice - Developers Among Us (SciFiDevCon 2024)Injustice - Developers Among Us (SciFiDevCon 2024)
Injustice - Developers Among Us (SciFiDevCon 2024)
 
FULL ENJOY 🔝 8264348440 🔝 Call Girls in Diplomatic Enclave | Delhi
FULL ENJOY 🔝 8264348440 🔝 Call Girls in Diplomatic Enclave | DelhiFULL ENJOY 🔝 8264348440 🔝 Call Girls in Diplomatic Enclave | Delhi
FULL ENJOY 🔝 8264348440 🔝 Call Girls in Diplomatic Enclave | Delhi
 
AI as an Interface for Commercial Buildings
AI as an Interface for Commercial BuildingsAI as an Interface for Commercial Buildings
AI as an Interface for Commercial Buildings
 
CloudStudio User manual (basic edition):
CloudStudio User manual (basic edition):CloudStudio User manual (basic edition):
CloudStudio User manual (basic edition):
 
Streamlining Python Development: A Guide to a Modern Project Setup
Streamlining Python Development: A Guide to a Modern Project SetupStreamlining Python Development: A Guide to a Modern Project Setup
Streamlining Python Development: A Guide to a Modern Project Setup
 
08448380779 Call Girls In Diplomatic Enclave Women Seeking Men
08448380779 Call Girls In Diplomatic Enclave Women Seeking Men08448380779 Call Girls In Diplomatic Enclave Women Seeking Men
08448380779 Call Girls In Diplomatic Enclave Women Seeking Men
 
Install Stable Diffusion in windows machine
Install Stable Diffusion in windows machineInstall Stable Diffusion in windows machine
Install Stable Diffusion in windows machine
 
Automating Business Process via MuleSoft Composer | Bangalore MuleSoft Meetup...
Automating Business Process via MuleSoft Composer | Bangalore MuleSoft Meetup...Automating Business Process via MuleSoft Composer | Bangalore MuleSoft Meetup...
Automating Business Process via MuleSoft Composer | Bangalore MuleSoft Meetup...
 
Connect Wave/ connectwave Pitch Deck Presentation
Connect Wave/ connectwave Pitch Deck PresentationConnect Wave/ connectwave Pitch Deck Presentation
Connect Wave/ connectwave Pitch Deck Presentation
 
Unlocking the Potential of the Cloud for IBM Power Systems
Unlocking the Potential of the Cloud for IBM Power SystemsUnlocking the Potential of the Cloud for IBM Power Systems
Unlocking the Potential of the Cloud for IBM Power Systems
 
"LLMs for Python Engineers: Advanced Data Analysis and Semantic Kernel",Oleks...
"LLMs for Python Engineers: Advanced Data Analysis and Semantic Kernel",Oleks..."LLMs for Python Engineers: Advanced Data Analysis and Semantic Kernel",Oleks...
"LLMs for Python Engineers: Advanced Data Analysis and Semantic Kernel",Oleks...
 
Maximizing Board Effectiveness 2024 Webinar.pptx
Maximizing Board Effectiveness 2024 Webinar.pptxMaximizing Board Effectiveness 2024 Webinar.pptx
Maximizing Board Effectiveness 2024 Webinar.pptx
 
Scanning the Internet for External Cloud Exposures via SSL Certs
Scanning the Internet for External Cloud Exposures via SSL CertsScanning the Internet for External Cloud Exposures via SSL Certs
Scanning the Internet for External Cloud Exposures via SSL Certs
 
Presentation on how to chat with PDF using ChatGPT code interpreter
Presentation on how to chat with PDF using ChatGPT code interpreterPresentation on how to chat with PDF using ChatGPT code interpreter
Presentation on how to chat with PDF using ChatGPT code interpreter
 
Transcript: New from BookNet Canada for 2024: BNC BiblioShare - Tech Forum 2024
Transcript: New from BookNet Canada for 2024: BNC BiblioShare - Tech Forum 2024Transcript: New from BookNet Canada for 2024: BNC BiblioShare - Tech Forum 2024
Transcript: New from BookNet Canada for 2024: BNC BiblioShare - Tech Forum 2024
 
Enhancing Worker Digital Experience: A Hands-on Workshop for Partners
Enhancing Worker Digital Experience: A Hands-on Workshop for PartnersEnhancing Worker Digital Experience: A Hands-on Workshop for Partners
Enhancing Worker Digital Experience: A Hands-on Workshop for Partners
 
Unleash Your Potential - Namagunga Girls Coding Club
Unleash Your Potential - Namagunga Girls Coding ClubUnleash Your Potential - Namagunga Girls Coding Club
Unleash Your Potential - Namagunga Girls Coding Club
 
Are Multi-Cloud and Serverless Good or Bad?
Are Multi-Cloud and Serverless Good or Bad?Are Multi-Cloud and Serverless Good or Bad?
Are Multi-Cloud and Serverless Good or Bad?
 

B017330916

  • 1. IOSR Journal of Computer Engineering (IOSR-JCE) e-ISSN: 2278-0661,p-ISSN: 2278-8727, Volume 17, Issue 3, Ver. III (May – Jun. 2015), PP 09-16 www.iosrjournals.org DOI: 10.9790/0661-17330916 www.iosrjournals.org 9 | Page Creating a Vehicle Proportion, Form, and Color Matching Model Shuntaro Toyoda1 , Yoshinori Nishio2 , Kakuro Amasaka3 1 (Graduate School of Science and Engineering, Aoyama Gakuin University, Japan) 2 (Faculty of Science and Engineering, Aoyama Gakuin University, Japan) 3 (Faculty of Science and Engineering, Aoyama Gakuin University, Japan) Abstract: Product design in the manufacturing industry is one of the most critical elements influencing consumer purchase behavior. As consumer values become increasingly diverse, design is becoming an important element for automakers as well. To address this issue, the authors took a Customer Science approach, creating supporting ideas for product development that capture the customers' sense. One original idea was creating a Vehicle Proportion, Form, and Color Matching approach method, and the effectiveness of this tool was then verified. The first step in the research process was to conduct a survey of sensory words and then perform a principal component analysis and cluster analysis to identify the elements that influence vehicle preference. Next, an eye camera and electroencephalograph (EEG) was used to analyze line of sight and discover the areas that caught customers’ attention. The insights gained from these investigations were then used to create 3D-CAD model cars with different proportions and forms, which were in turn analyzed using experimental design (DE) and analytic hierarchy process (AHP) methods to identify ideal relationships among proportion, form, and color. The effectiveness of the proposed model in supporting idea generation during actual vehicle design and development was then verified. Keywords: vehicle, Proportion, Form, Color, Matching Approach Model I. Introduction Product design in the manufacturing industry is one of the most critical elements influencing consumer purchase behavior. As consumer values become increasingly diverse, design is becoming an important element for automakers as well. Unfortunately, as people’s values and subjective preferences become more varied and complex, it becomes increasingly difficult to accurately define their wants and needs. To address this issue, the authors took a Customer Science approach, creating supporting ideas for product development that capture the customers' sense. One original idea was creating a Vehicle Proportion, Form, and Color Matching approach method, and the effectiveness of this tool was then verified. The first step in the research process was to conduct a survey of sensory words and then perform a principal component analysis and cluster analysis to identify the elements that influence vehicle preference. Next, an eye camera and electroencephalograph (EEG) was used to analyze line of sight and discover the areas that caught customers’ attention. The insights gained from these investigations were then used to create 3D-CAD model cars with different proportions and forms, which were in turn analyzed using experimental design (DE) and analytic hierarchy process (AHP) methods to identify ideal relationships among proportion, form, and color. The effectiveness of the proposed model in supporting idea generation during actual vehicle design and development was then verified. II. Background The development of a Customer Science approach able to identify customer wants for the purpose of market creation has become increasingly critical in recent years. The core challenge is using better overall vehicle quality—in other words, employing statistics—as a means of scientifically (numerically) representing the customers’ unspoken senses (customer preferences) in design work. Reforming this business process is absolutely essential to successfully creating attractive vehicles. Figure 1 shows the sensory elements of design work. It starts with the three elements (1) proportion (profile design), (2) form, and (3) color. Recent design work strategies make it a point to optimize business processes so that they are in line with the vehicle design concept from the product planning stage. Next, each element must be matched: (4) proportion and form, (5) form and color, and (6) proportion and color. Finally, all three elements—(7) proportion, form, and color—must be integrated harmoniously to address modern market demands. As an example of a business process innovation that addresses profile design (1), the authors (Amasaka, 2005) applied the Customer Science approach to Lexus design work and used it to spur the development of design. The authors have simultaneously reported examples of other innovations in form (2) and color (3), while additional research examples have focused on proportion and form matching (4) and form and color matching (5).
  • 2. Creating a Vehicle Proportion, Form, and Color Matching Model DOI: 10.9790/0661-17330916 www.iosrjournals.org 10 | Page Based on the insights gained from the above research, the authors (Toyoda,Nishio, 2014)now attempt to develop a Matching Approach Method to integrate proportion and color (6) as well as the three elements (proportion, form, and color) together (7). Details are given in the following sections . Fig 1. The sensory elements of design work III. Developing A Vehicle Proportion, Form, And Color Matching Approach Model. This study quantitatively determines the customers’ senses in order to clearly and rationally identify the unspoken characteristics of vehicle design with the purpose of developing optimum proportion, form, and color matching. The approach is shown in figure 2. Fig 2. A vehicle proportion, form, and color matching model 3.1 Identifying Key Issues (STEP 0) To better understand today’s auto industry, the authors began by conducting interviews with key automakers and dealers as well as with customers. They also consulted prior research to see which issues had already been addressed and which have yet to be clearly identified. 3.2 Customer Preference Survey (STEP 1) The authors conducted a customer preference survey based on the key issues identified above. In this step, customers were given a questionnaire to find out which vehicles they were interested in and to pinpoint the main factors they considered when purchasing a vehicle. Once the data was collected, the authors subjected it to a principal component analysis and a cluster analysis in order to quantitatively determine the relationships among different customer senses. 3.3 Identifying Focus Areas (STEP 2) In this step, the authors used the insights gained from the customer preference survey in STEP 1 to recruit test subjects that resembled target customers. Once the test subjects were selected, they were each fitted with an eye camera to analyze line-of-sight information. This told the authors where the subjects placed their attention when looking at vehicles. At the same time, an electroencephalograph (EEG) was used to measure brain waves. This device ascertained how the subjects were feeling when they looked at certain parts of the car.
  • 3. Creating a Vehicle Proportion, Form, and Color Matching Model DOI: 10.9790/0661-17330916 www.iosrjournals.org 11 | Page 3.4 Identifying the Relationship between Proportion and Form (STEP 3) The authors continued to build upon the information gained in the previous steps in order to identify the relationship between proportion and form, two of the critical elements in exterior automotive design. To do this, they used 3D-CAD software to actually convert vehicle characteristics into numerical specifications, thus actually creating the vehicle designs that customers want. 3.5 Identifying the Relationships among Proportion, Form, and Color (STEP 4) The models designed in STEP 3 were then analyzed using statistics (Design of Experiments (DOE) and AHP) to select the model that had the optimum combination of design elements. 3.6 Developing a Verification and Approach Model (STEP 5) Finally, the authors evaluated the success of the model selected in STEP 4. Test subjects were again fitted with EEG equipment as the authors compared their reactions to the selected model and other vehicle designs. The effectiveness of the model developed using their approach method was thus confirmed. IV. Application: Development And Effectiveness Of The Vehicle Proportion, Form, And Color Matching Approach Model. The development of the Vehicle Proportion, Form, and Color Matching Approach Model outlined in the previous section was applied to young men in their 20s to see whether the model selected by the method would match their preferences. The effectiveness of the research was thus confirmed. 4.1 Customer Preference Survey (STEP 1) In order to identify the current state of vehicle sales and design, the authors conducted interviews between June and August with automotive companies (Nissan, Toyota, Honda), design firms (Kansai pain, Toyota design institute), dealers (Netz Toyota Fuchinobe), and customers (51 men in their 20s) to find out what they prioritized when building cars and/or the kinds of cars they hoped to drive. The interviews revealed a gap between the vehicle concepts held by automotive companies and design firms on the one hand, and the look of the vehicles that customers wanted. Interviews with dealers also revealed that customer demands were not being sufficiently addressed. One of the reasons for the key issues identified in the interviews was that customer demands were often unexpressed and therefore difficult to identify. The authors thus sought to develop the Vehicle Proportion, Form, and Color Matching Approach Method based on customers’ senses with the idea of clearly, rationally, and numerically identifying previously unspoken customer desires. The model was then used to help resolve the key issues listed above. Table 1. The factor loading Variable Name Principle Component Scores 1 Principle Component Scores 2 1 0.572 -0.208 2 0.094 0.252 3 0.521 -0.562 4 0.709 0.303 5 0.825 -0.002 6 0.343 0.055 7 0.277 -0.592 8 0.263 0.304 9 0.700 0.202 10 0.409 -0.446 11 0.533 -0.420 12 0.359 0.644 13 0.615 0.052 14 0.448 -0.142 15 0.531 0.295 16 0.361 -0.253 17 0.748 -0.017 18 0.295 -0.028 19 0.780 0.113
  • 4. Creating a Vehicle Proportion, Form, and Color Matching Model DOI: 10.9790/0661-17330916 www.iosrjournals.org 12 | Page Table 2. Principle component scores Sample Name Principle Component Scores 1 Principle Component Scores 2 Refined 1.141 0.266 Traditional -1.469 0.820 Eye-catching -1.265 -1.717 Smart -0.025 0.804 Modern -0.268 -1.956 Calm 0.138 1.342 Orthodox -0.946 1.529 Individual -*0.143 -1.635 Roundish -1.136 0.028 Advanced 0.862 -0.650 Sporty 0.443 -0.179 Luxurious 1.291 0.140 Sophisticated 1.203 0.460 Stylish 1.226 -0.034 Compact -0.843 0.939 Square -1.373 0.352 Practical 0.389 0.874 Feeling of oppression -0.841 0.238 Cool 1.841 -0.194 Youthful 0.218 0.139 Showy -0.433 -1.567 The first step was to survey young men in their 20s and subject the collected data to a principal component analysis and a cluster analysis. Tables 1 and 2 show the factor loading and principle component scores from the principal component analysis; these were used to identify 21 sensory words (refined, eye- catching, traditional, etc.) and the correlations among them as well as to assign meaning to the principle components. Figure 3 shows the subjects categorized into five purchase behavior groups based on the cluster analysis: (1) disinterested, (2) functionality-oriented, (3) self-expression-oriented, (4) outward appearance– oriented, and (5) practicality-oriented. The self-expression and outward appearance group were combined into an ―exterior design-oriented‖ group and selected as targets for further research. To identify more specifically the core preferences of these customers, the cluster analysis data was transposed and sensory words for the exterior design group were summarized into five clusters (see figure 4). In line with the results of the principal component analysis, it was found that four sensory words from the clusters (luxurious, sophisticated, stylish, and cool) represent the demands of the members of the exterior design group. Fig 3. Five purchase behavior groups based on the cluster analysis
  • 5. Creating a Vehicle Proportion, Form, and Color Matching Model DOI: 10.9790/0661-17330916 www.iosrjournals.org 13 | Page Fig 4. Identify more specifically the core preferences of these customers In line with the results of the principal component analysis, it was found that four sensory words from the clusters (luxurious, sophisticated, stylish, and cool) represent the demands of the members of the exterior design group. 4.2 Identifying Focus Areas (STEP 2) During this step, male subjects in their 20s were fitted with optical cameras and EEG equipment for testing. The optical cameras measured line-of-sight information using a camera mounted on a headpiece as well as a camera that detects pupil movement. The areas viewed by the subjects are shown in red marker in figure 5, providing quantitative information on where they were looking. The EEG is a device that measures electrical signals emitted from each part of the cerebrum, and allows researchers to predict correlations between human behavior and brain activity. Figure 6 shows the alpha waves measured with the EEG equipment. The solid red line represents high alpha waves, while the blue line represents low alpha waves. The size of these values makes it possible to quantitatively determine the parts of the vehicle subjects were giving the most attention. Fig 5. Providing quantitative information on where they were looking Fig 6. The alpha waves measured with the EEG equipment
  • 6. Creating a Vehicle Proportion, Form, and Color Matching Model DOI: 10.9790/0661-17330916 www.iosrjournals.org 14 | Page 4.3 Identifying the Relationship between Proportion and Form (STEP 3) The authors next used 3D-CAD software to actually design a vehicle exterior that reflected the critical proportion and form element as indicated in the results obtained above (see figure 7). The study used a mid-size sedan and selected standard proportion and form dimensions based on collections of dimensional body drawings from Jidosha Koronsha (see table 3) and then numerically represented them at three levels. The authors then created models that combined different front (length of the front windshield, edge and groove lines), side (hood bulge, strength of character lines), and rear (C pillar angle, rear bumper width) form elements. Fig 7. Designing a vehicle exterior that reflected the critical proportion and form element Table 3. Selected standard proportion and form dimensions Model length of the front windshield hood bulge edge and groove lines A 730 40 40 B 655 25 15 C 805 25 15 D 655 50 15 E 805 50 15 F 655 25 45 G 805 25 45 H 655 50 45 I 805 50 45 4.4 Identifying the Relationships among Proportion, Form, and Color (STEP 4) The nine models designed in STEP 3 were analyzed using Design of Experiments (DOE) to determine the optimum combination of design elements. As shown in table 4, the analysis revealed that factor A (length of the front windshield), factor B (hood bulge), factor C (edge and groove lines), and the interplay between factors B and C had a 5% significance—indicating that shallow edge and groove lines were more significant than differences in hood bulge. Similarly, table 5 shows that when it came to the side areas, the interplay between the strength of the character lines and the angle of the A pillar also had a 5% significance. These results allowed the authors to identify two front patterns, one side pattern, and one rear pattern. Table 4. Analysis result (Front part) Factor Sum of Squares Flexibility Variance Variance Ratio Test A 20.816 1 20.816 21.575 ** B 11.391 1 11.391 11.806 ** C 5.348 1 5.348 5.543 * AB 0.660 1 0.660 0.684 AC 1.266 1 1.266 1.312 BC 7.223 1 7.223 7.486 * ABC 2.250 1 2.250 2.332 Error 7.719 8 0.965 0.558
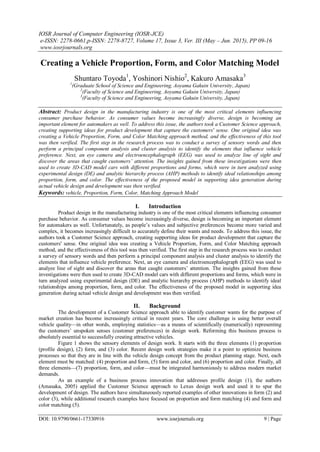
  • 7. Creating a Vehicle Proportion, Form, and Color Matching Model DOI: 10.9790/0661-17330916 www.iosrjournals.org 15 | Page Table 5. Analysis result (Side part) Factor Sum of Squares Flexibility Variance Variance Ratio Test A 3.754 1 3.754 2.099 B 10.160 1 10.160 5.682 * C 14.063 1 14.063 7.864 * AB 1.129 1 1.129 0.631 AC 1.266 1 1.266 0.708 BC 16.000 1 16.000 8.948 * Error 16.094 9 1.788 1.042 Three colors (black, white, red) were added to the model to create six alternatives (Type A, Type B , Type C, Type D, Type E, Type F). They were then subjected to an analytic hierarchy process (AHP) in order to identify the model that optimally matched the sensory words that represent the demands of the exterior design group. Models created using 3D-CAD software were given to subjects to visually compare using a paired comparison method in order to assign priority levels to the different standards and alternatives. The test subjects’ subjective responses were gathered using a questionnaire. Table 6 shows the relative priority of each standard (sensory word) and alternative (CAD model). This information was then comprehensively evaluated to identify the model with the best proportion, form, and color combination. Table 6. The relative priority (Standard) Subject Alternative 1 Alternative 2 Alternative 3 Alternative 4 Alternative 5 Alternative 6 1 0.13 0.17 0.12 0.10 0.16 0.32 2 0.13 0.15 0.10 0.13 0.18 0.30 3 0.09 0.10 0.26 0.39 0.06 0.11 4 0.25 0.29 0.03 0.04 0.15 0.24 5 0.33 0.31 0.19 0.09 0.02 0.06 6 0.31 0.34 0.16 0.10 0.06 0.03 7 0.31 0.34 0.16 0.10 0.06 0.03 8 0.06 0.11 0.08 0.07 0.21 0.48 9 0.17 0.16 0.06 0.08 0.31 0.21 10 0.19 0.23 0.09 0.25 0.11 0.13 The analysis indicated that among young men in their 20s within the exterior design group (the target of the study), two models created using this method (Type B, Type F) received the highest evaluation score of 0.21 (see figure 8). The results indicate that the Type B model, with a front windshield length of 805 mm, a hood bulge of 50º, edge and groove lines of 45º, emphasized strong character lines, an A pillar angle of 30º, and black paint, has the ―cool‖ sensory word as its main focus. The Type F model had the same proportions and form as Type B in red, and has the ―luxurious‖ sensory word as its main focus. Fig 8. Two models created using this method (Type B, Type F) 4.5 Verification, Creating a Vehicle Matching Approach Model (STEP 5) The models identified in STEP 4 were verified, and the authors were then able to develop the Vehicle Proportion, Form, and Color Matching Approach Model. Here, EEG equipment was used to measure the subjects’ alpha waves as they looked in random order at the models they were asked about in the STEP 4 questionnaire. Figure 9 shows the results of this test; namely, that the models triggering the highest alpha wave
  • 8. Creating a Vehicle Proportion, Form, and Color Matching Model DOI: 10.9790/0661-17330916 www.iosrjournals.org 16 | Page values were the same models that the study predicted through the Matching Approach Model. The effectiveness of the model was thus confirmed. V. Conclusion This study focused on three vehicle design elements that were handled separately in the past (proportion, form, and color) and attempted to match them all while pinpointing their correlations to customer senses. In order to get this information, the authors made full use of statistical tools (multivariate analysis, DOE, AHP), optical cameras, EEG equipment, and 3D-CAD software to develop a Matching Approach Model. Their research demonstrated that this model can be used to clearly and rationally identify previously unspoken customer senses. In future studies, the effectiveness of the model will be tested with other age groups as well. References Journal Papers: [1]. Amasaka, K., (2002), New JIT, A New Management Technology Principle at Toyota, International Journal of Production Economics, Vol. 80, pp.135-144. [2]. Amasaka, K., (2005), Constructing a Customer Science Application System ―CS-CIANS‖- Development of a Global Strategic Vehicle ―Lexus‖ Utilizing New JIT –, WSEAS (World Scientific and Transactions on Business and Economics, Issue3, Vol.2, pp.135-142. [3]. Asami, H., Owada, H., Murata, Y., Takebuchi, S. and Amasaka, K. (2008), The A-VEDAM Model for Approaching Vehicle Exterior Design, Journal of Business Case Studies, Vol. 7, No. 5,.pp.1-8. [4]. Asami, H., Ando, T., Yamaji,M. and Amasaka, K. (2010), A Study on Automobile Form Design Support Method ―AFD-SM‖, The Journal of Business & Economics Research, Vol.8, No.11, pp. 13-19. [5]. Muto, M., Miyake, R. and Amasaka, K. (2011), Constructing an Automobile Body Color Development Approach Model, Journal of Management Science, Vol.2, pp. 175-183. [6]. Takebuchi, S., Asami, H. and Amasaka, K. (2012), An Automobile Exterior Design Approach Model Linking Form and Color, China-USA Business Review, Vol.11, No.8, pp. 1113-1123. [7]. Muto, M., Takebuchi, S. and Amasaka, K. (2013), Creating A New Automotive Exterior Design Approach Model -The Relationship Between Form and Body Color Qualities-, Journal of Business Case Studies, Vol.9 No.5, pp. 367-374 Books: [8]. Amasaka, K., (2004), Science SQC, New Quality Control Principle: The Quality Strategy of Toyota」, Springer. [9]. Amasaka, K. ed., (2012), Science TQM, New Quality Management Principle: The Quality Management Strategy of Toyota」 Bentham e-Books: Bentham Science Publisher. [10]. Amasaka, K., (2014), New JIT, New Management Technology Principle, Tayler and Francis Group (Forthcoming).