Download to read offline

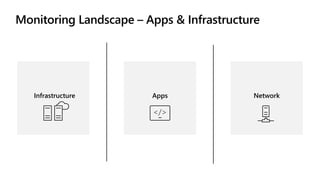
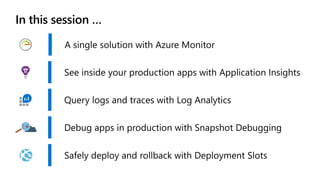
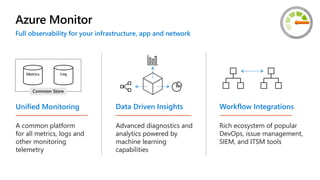
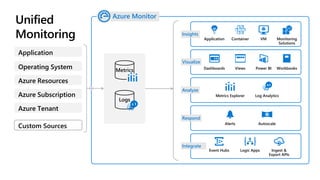
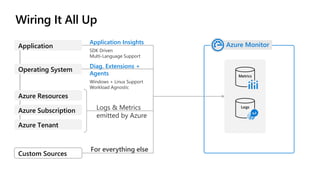

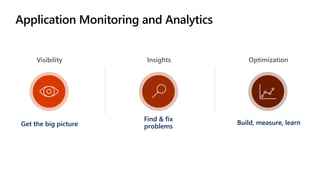
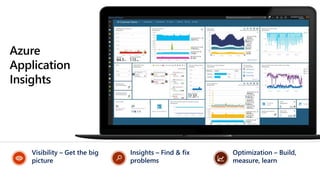
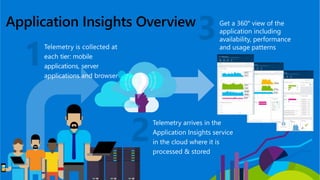
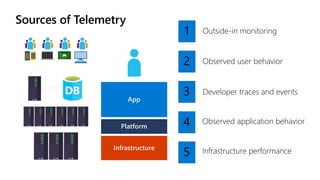
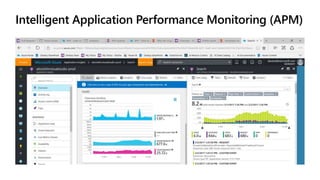
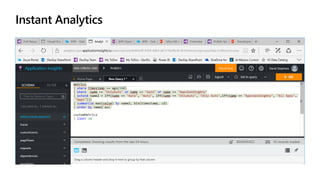
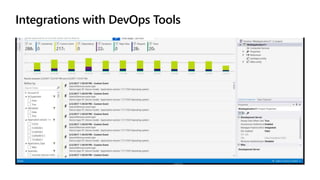
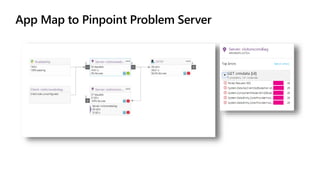
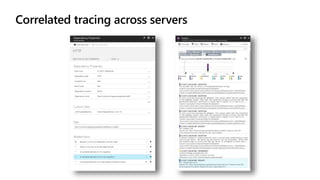

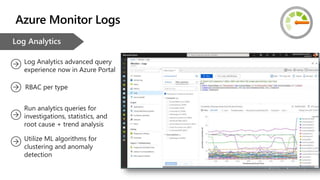
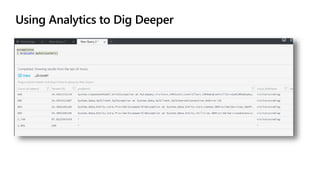

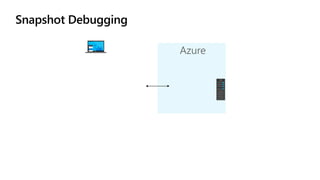
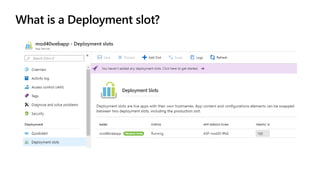
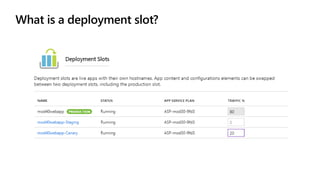
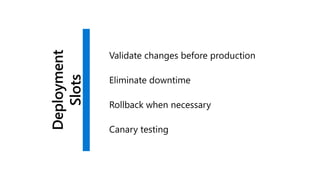
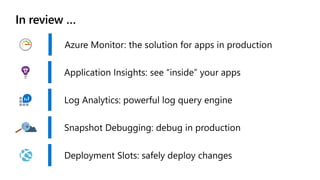


This document discusses debugging and monitoring applications in Microsoft Azure. It provides an overview of Azure Monitor, which offers unified monitoring of metrics, logs and other telemetry across infrastructure, applications and networks. Azure Monitor uses machine learning capabilities to provide data-driven insights. It also integrates with popular DevOps, issue management and IT security tools. Application Insights is highlighted as a key part of Azure Monitor for application monitoring and analytics. It provides visibility into applications, insights to find and fix problems, and helps with optimization. Features like instant analytics, integrations with DevOps tools, app mapping and correlated tracing are discussed. Snapshot debugging and deployment slots in Azure are also summarized.