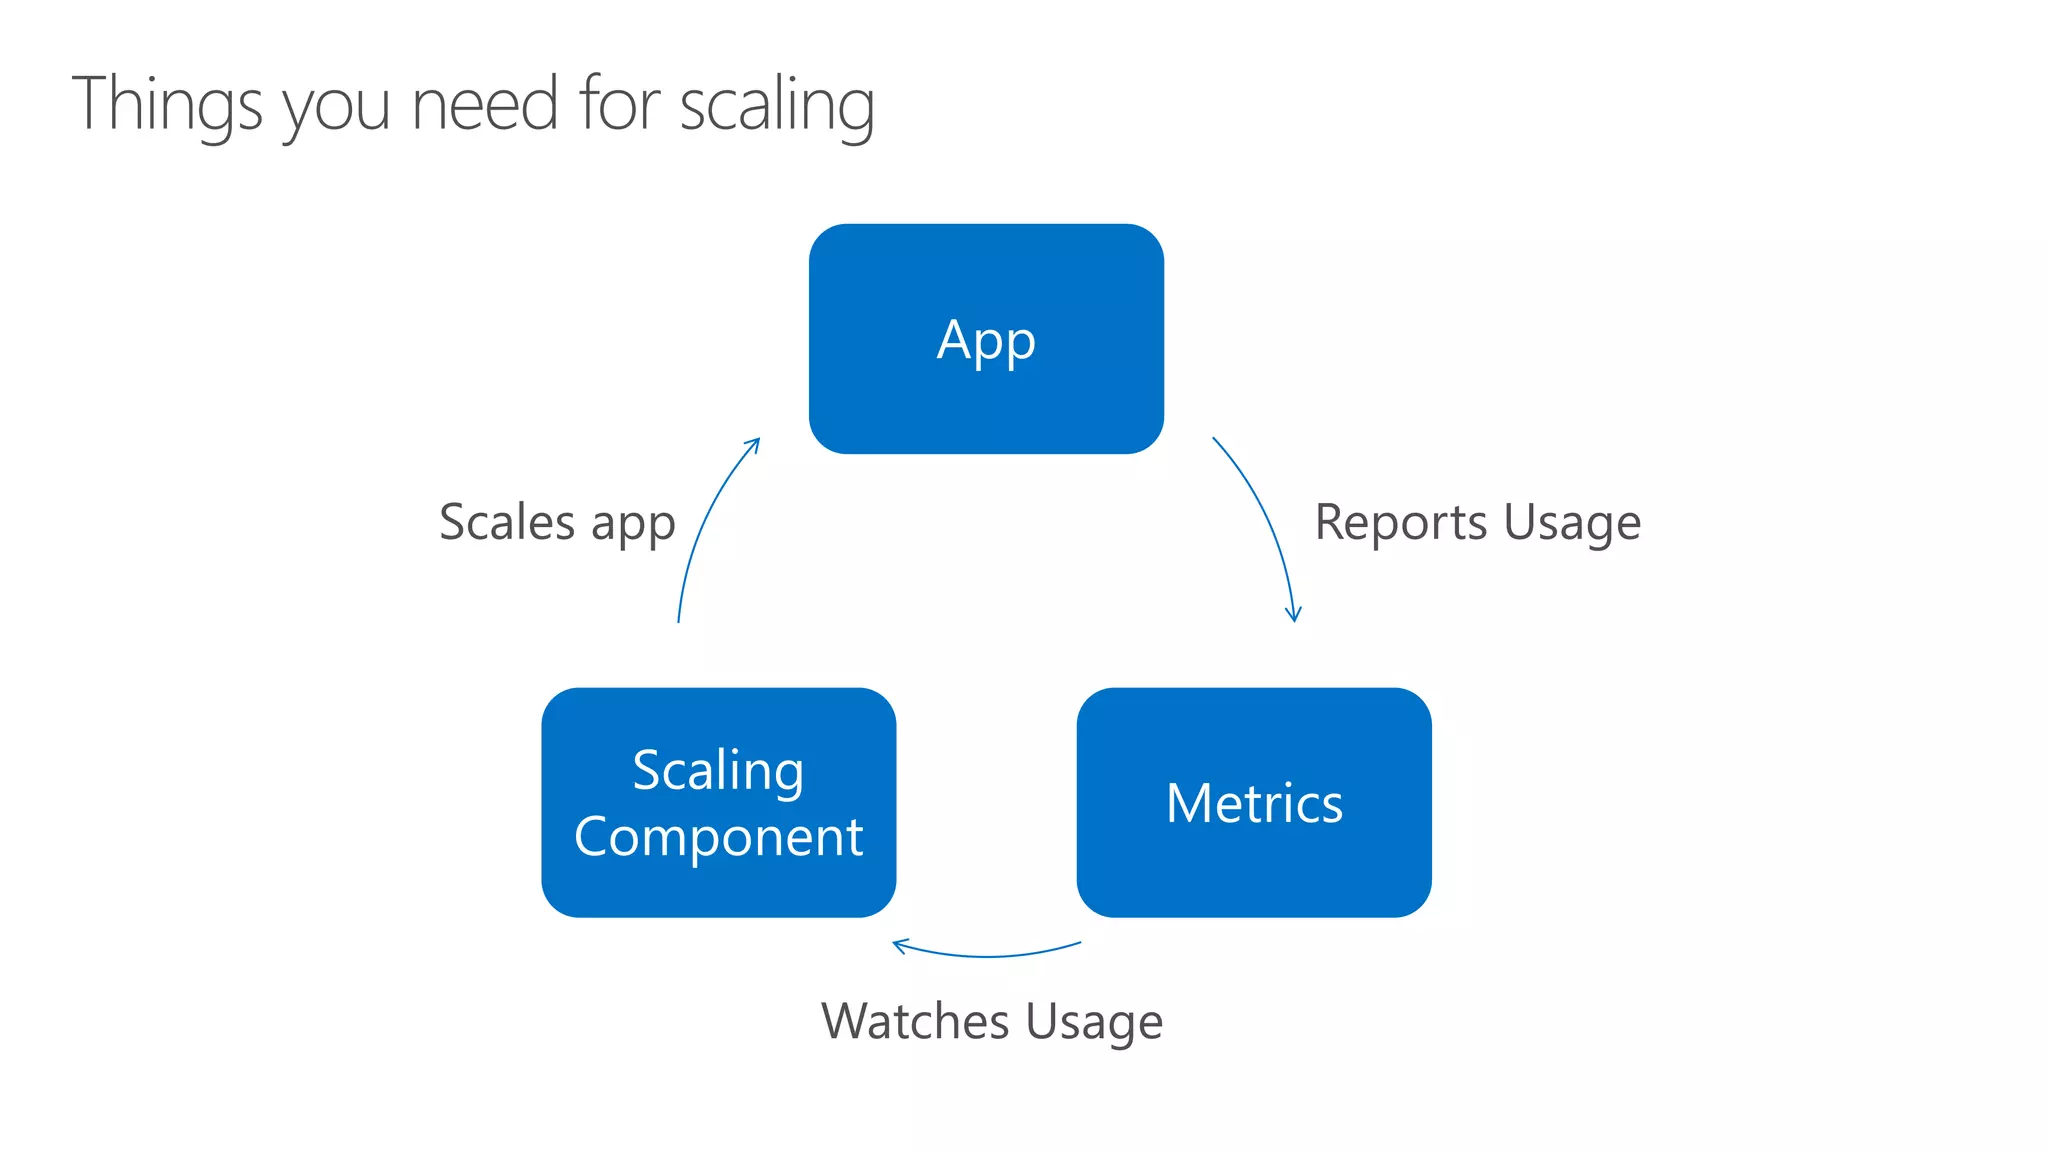
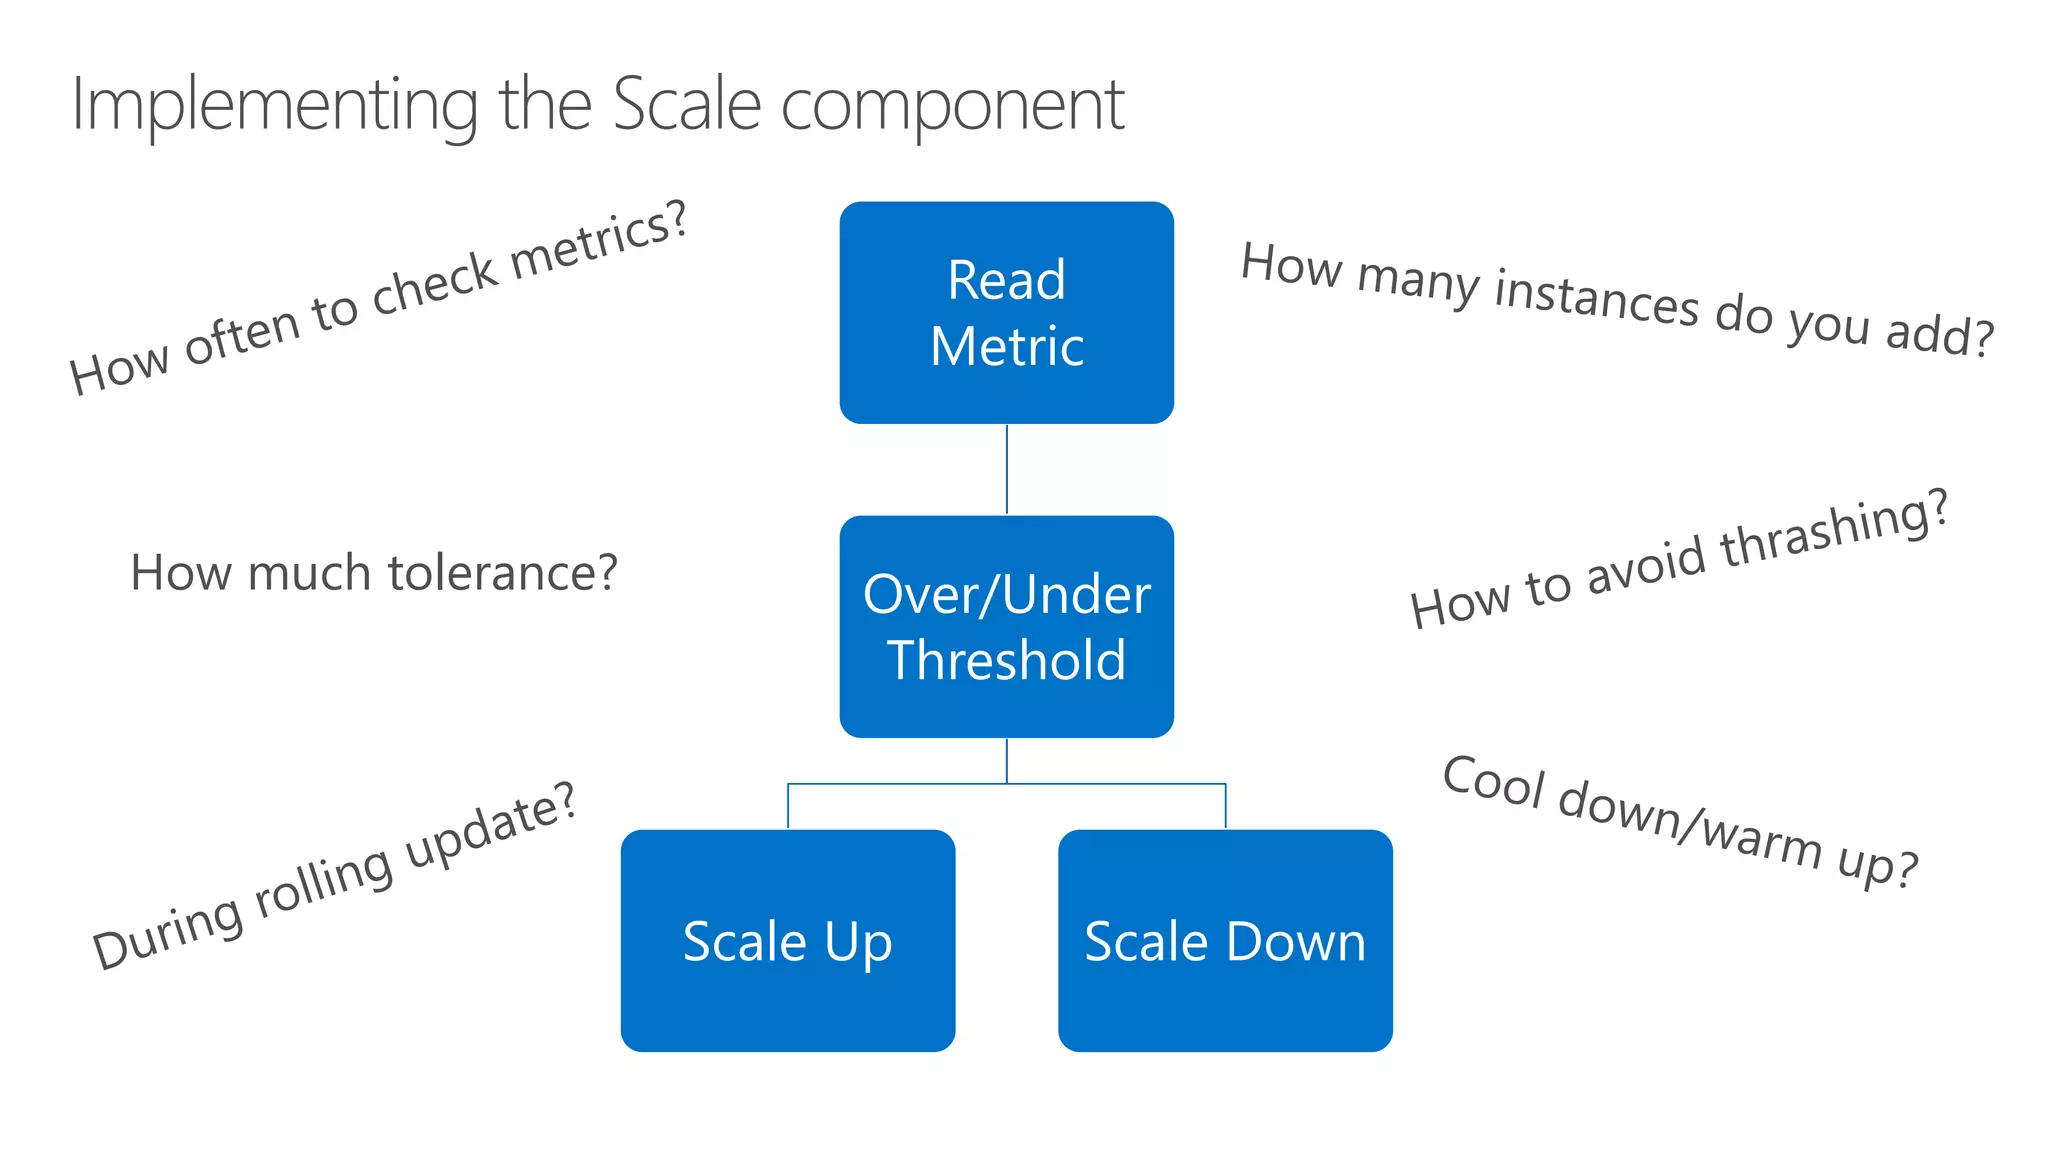
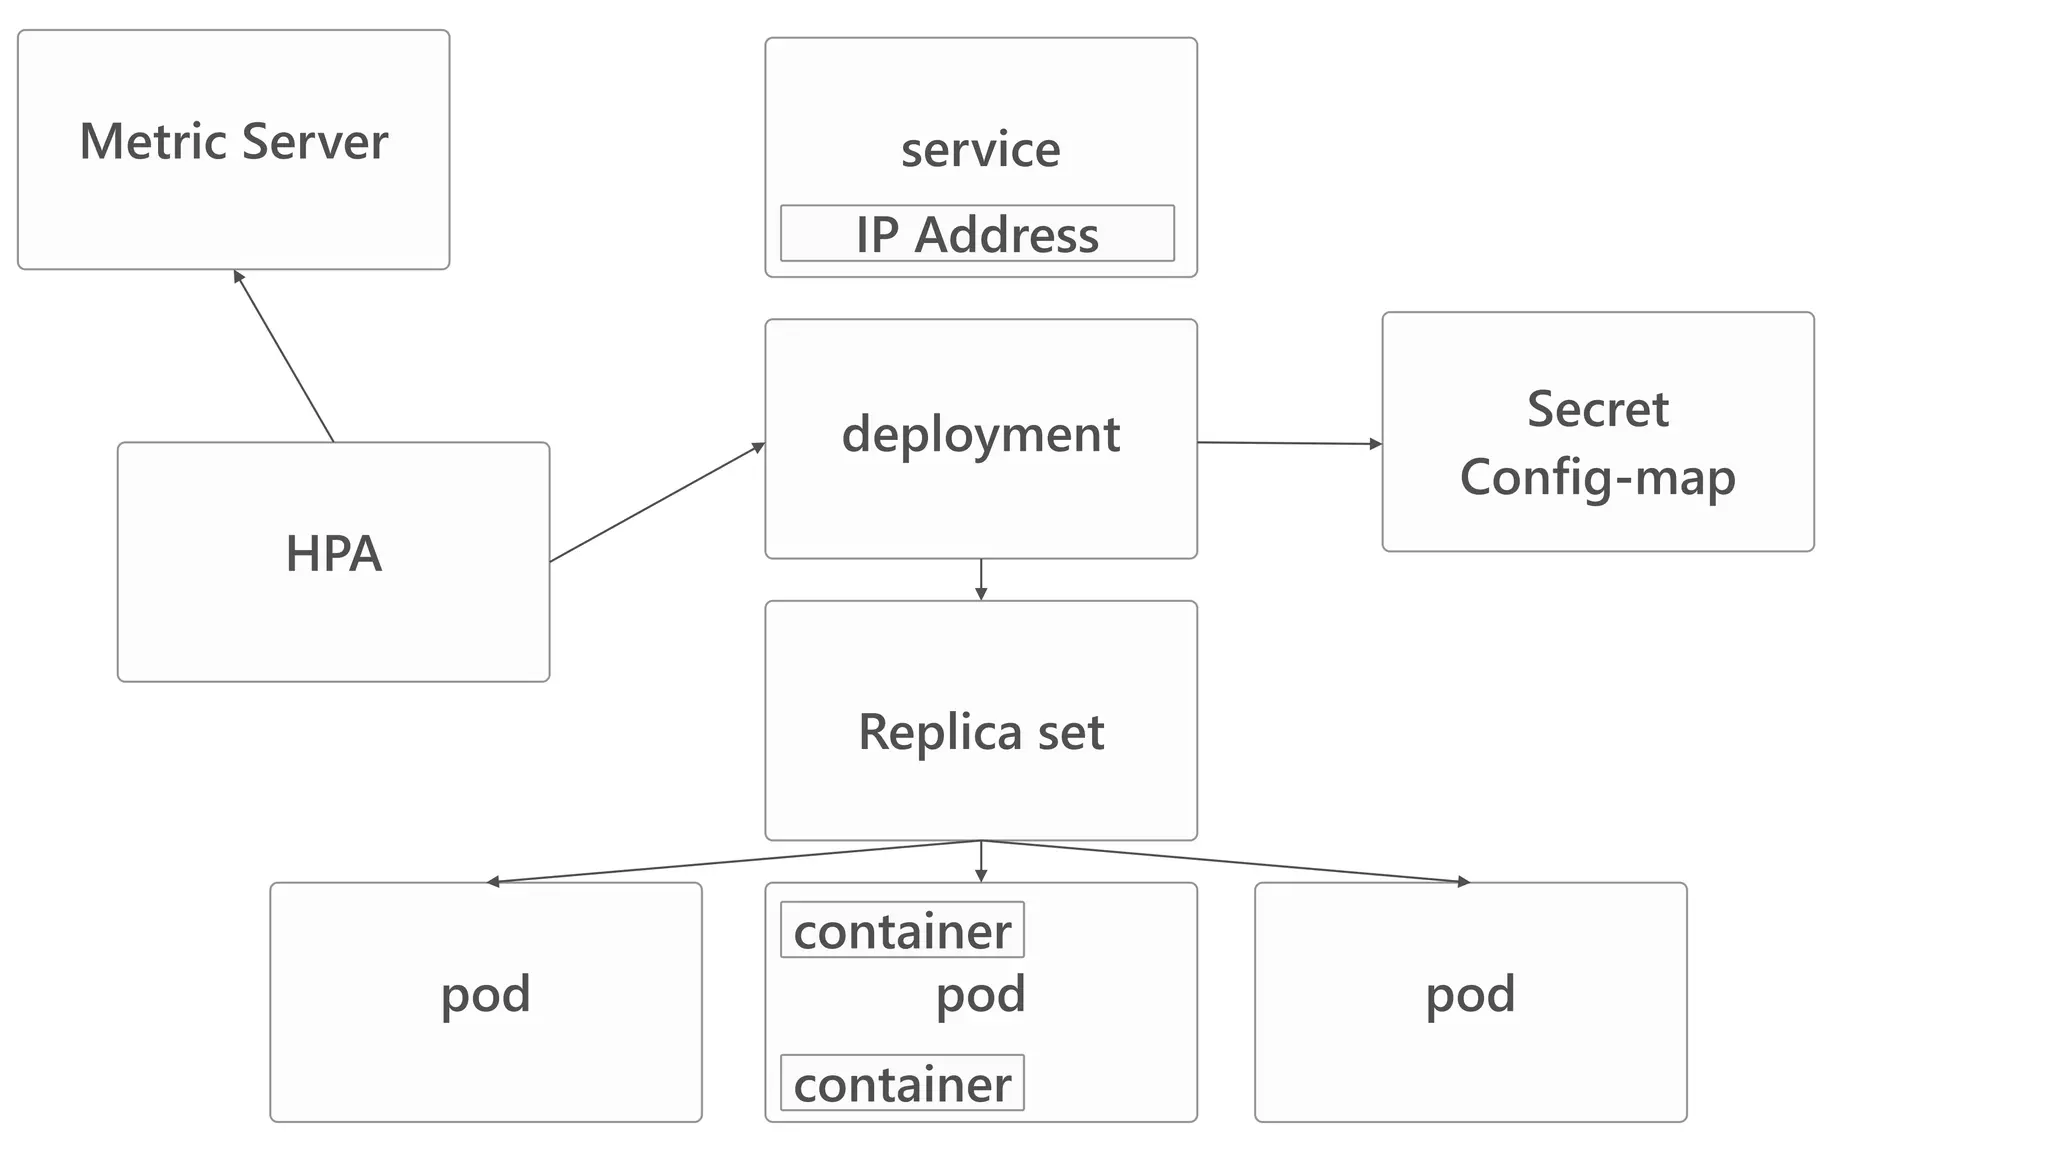
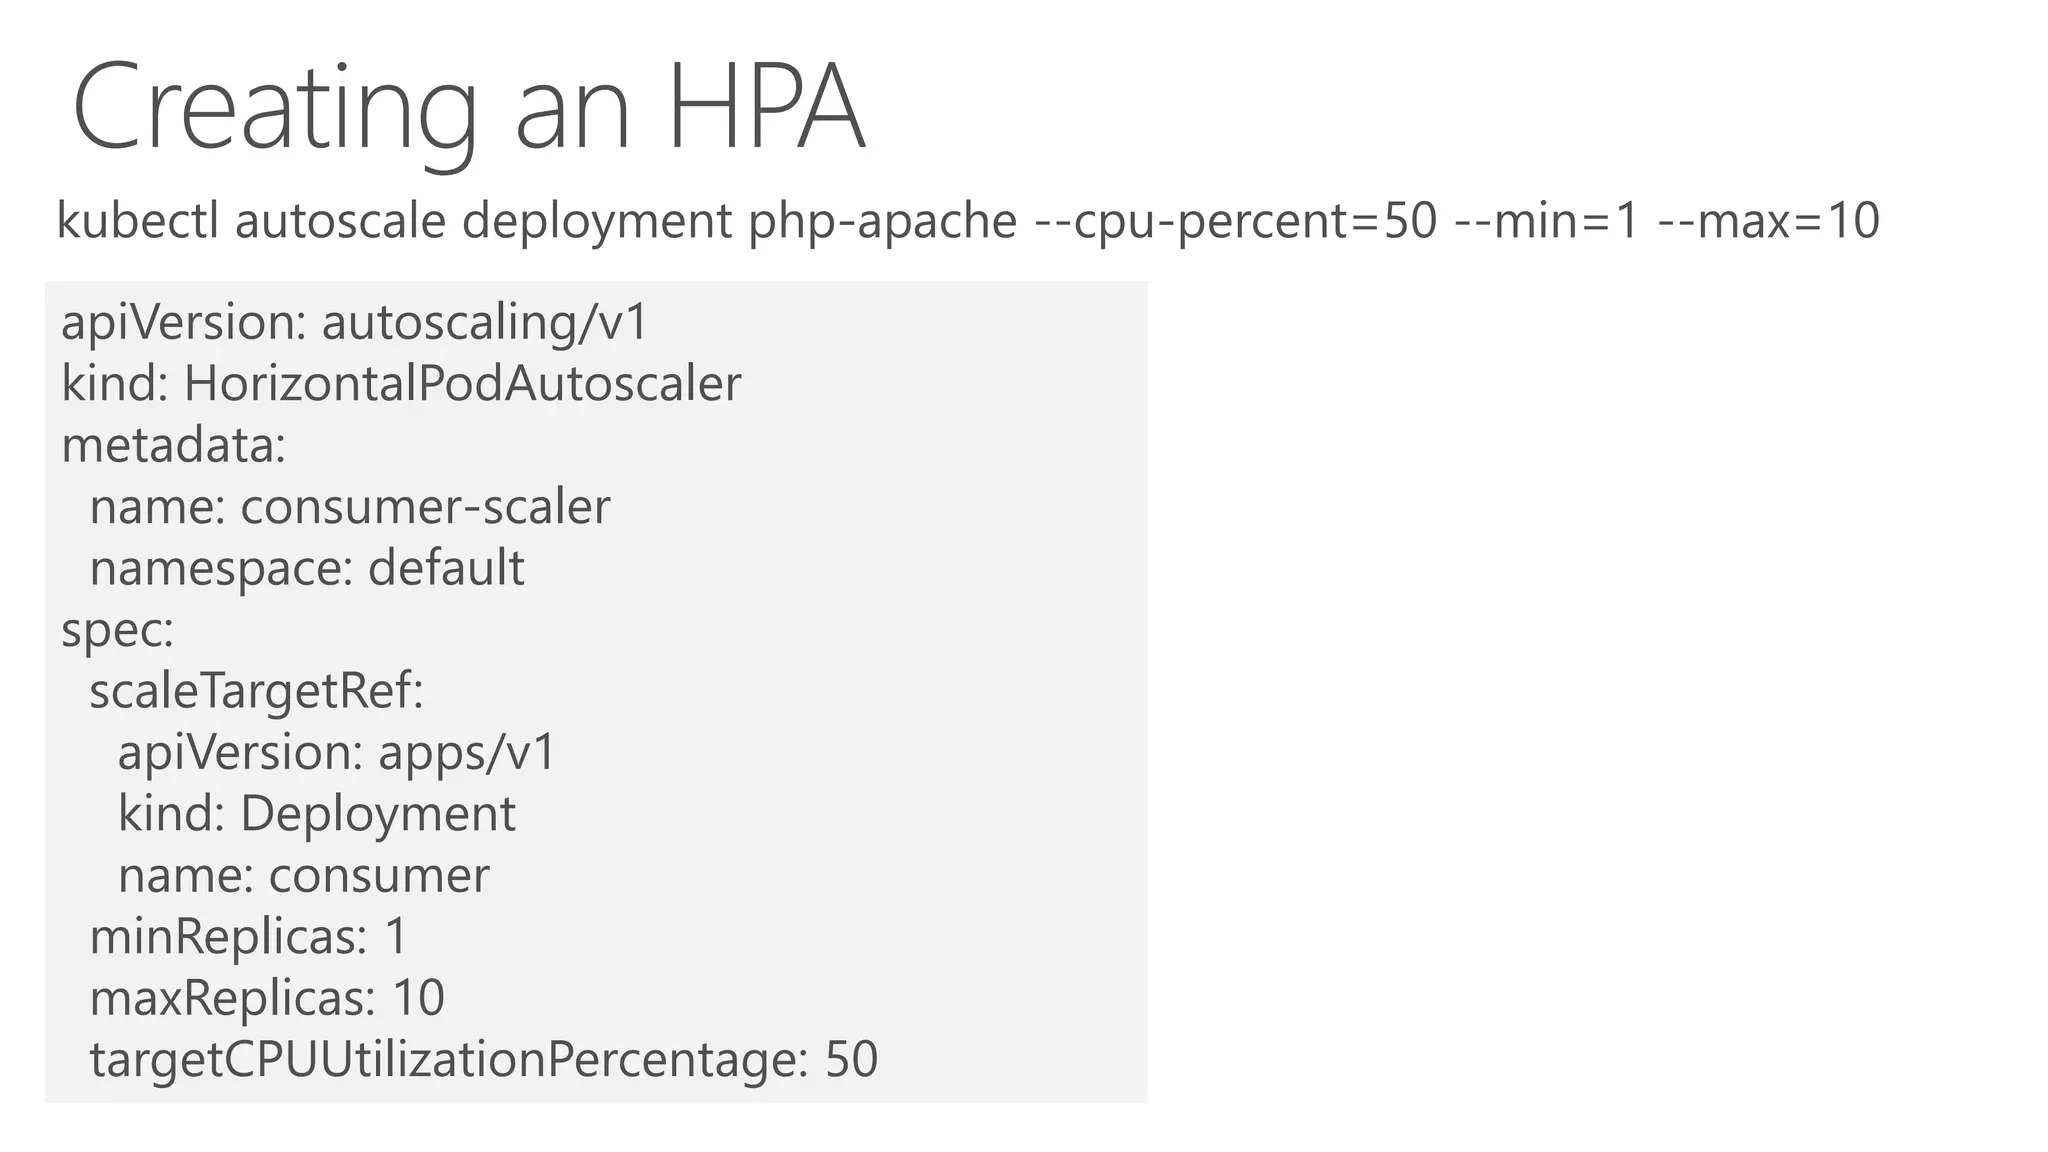
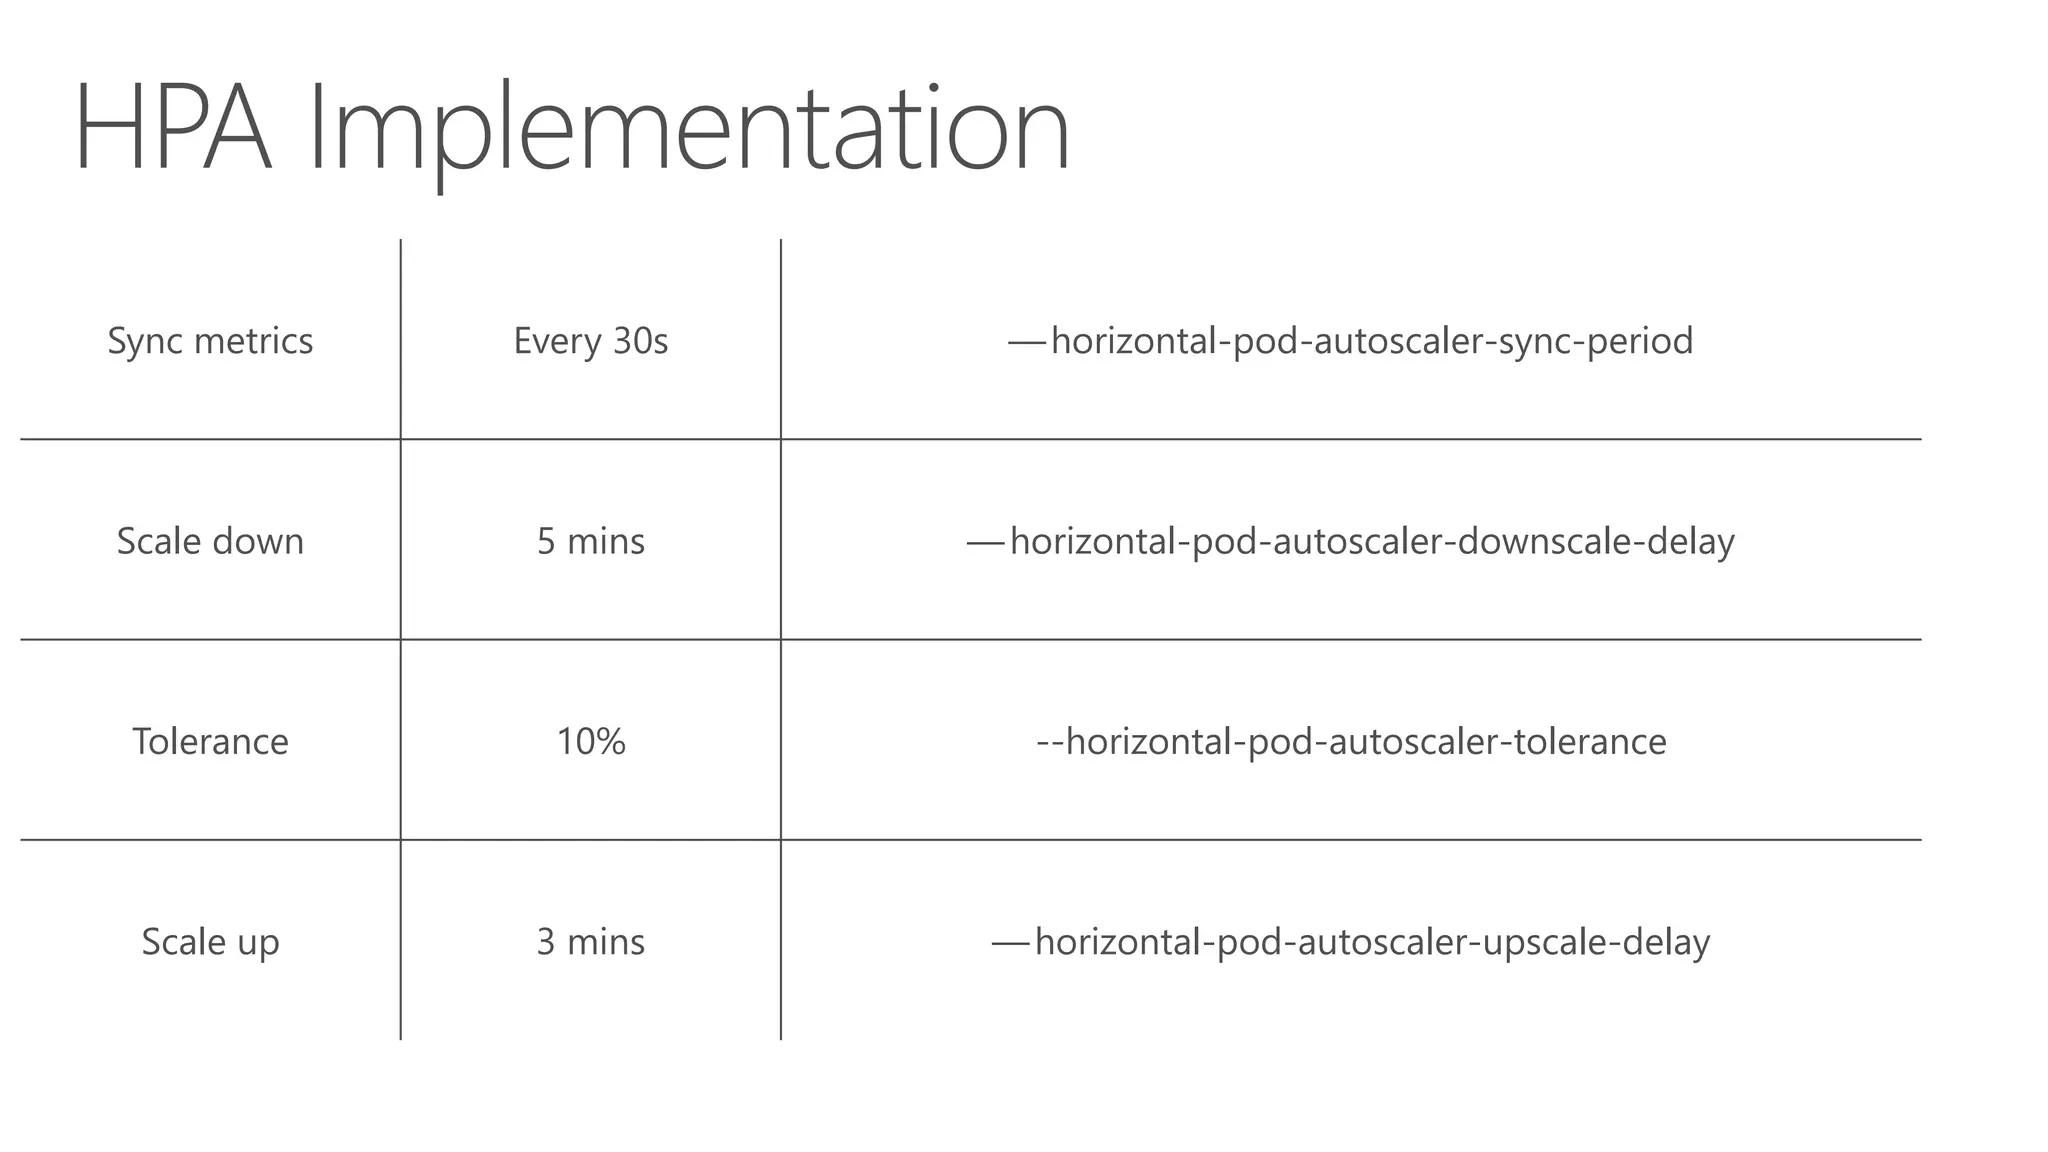
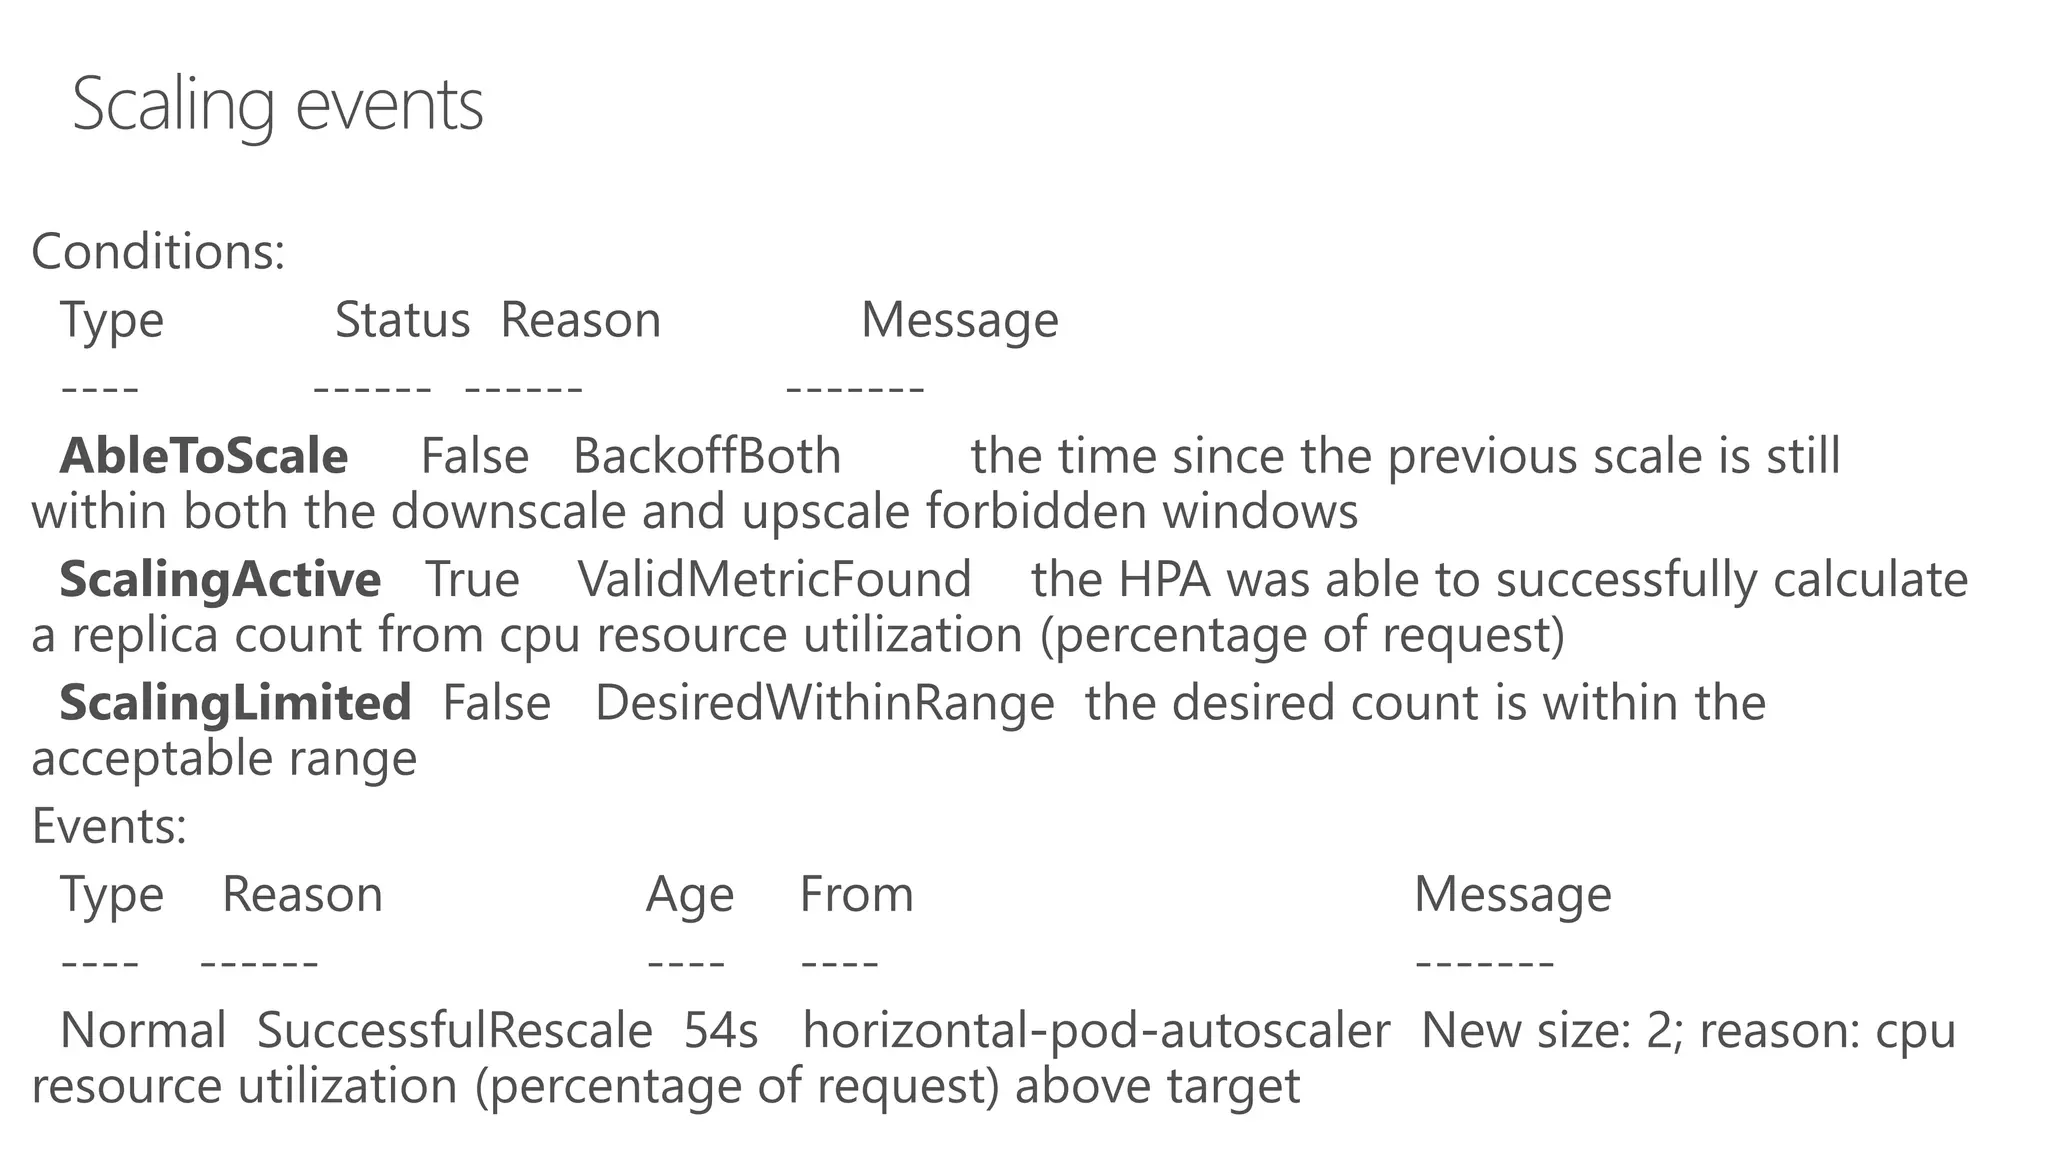
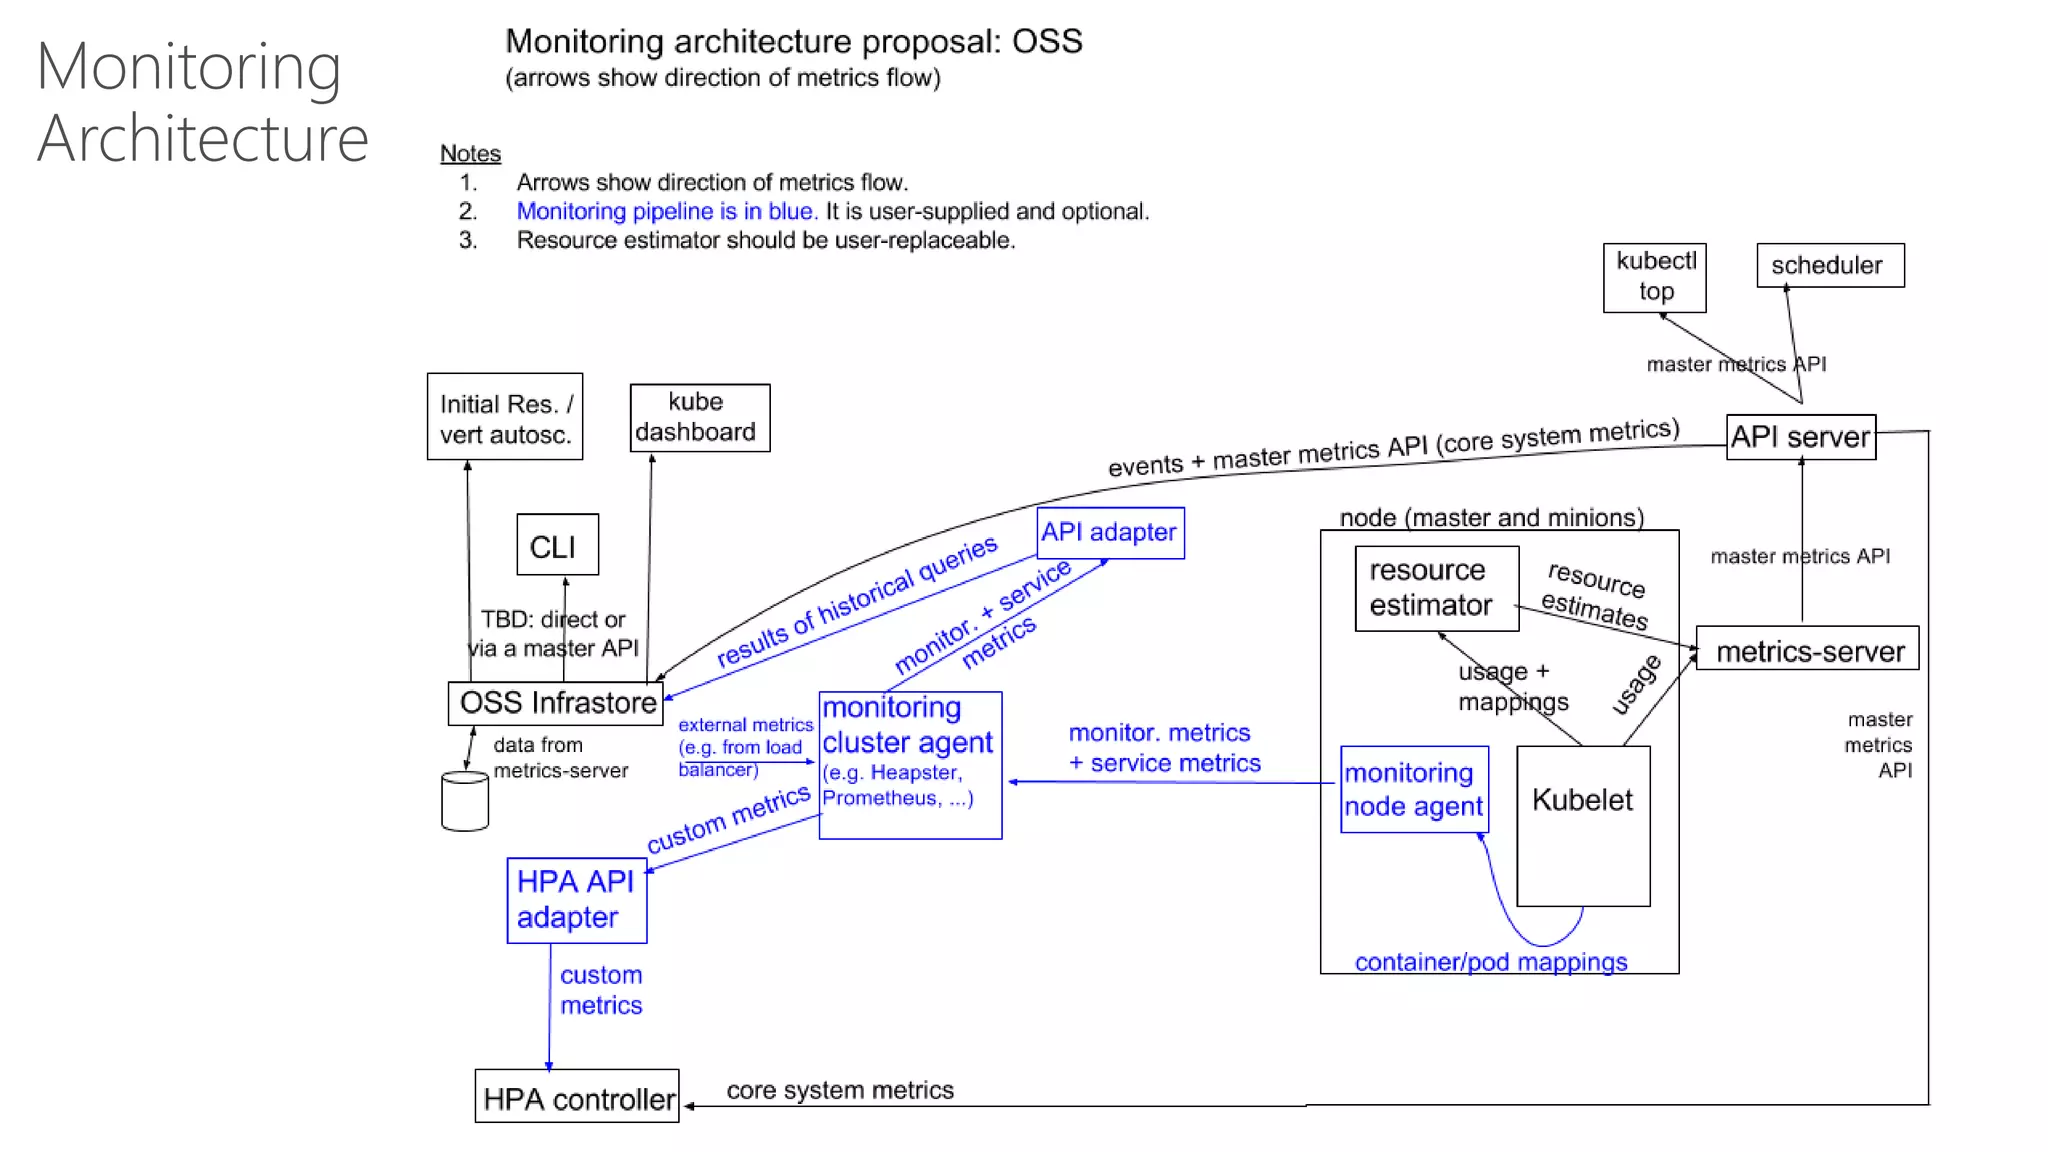
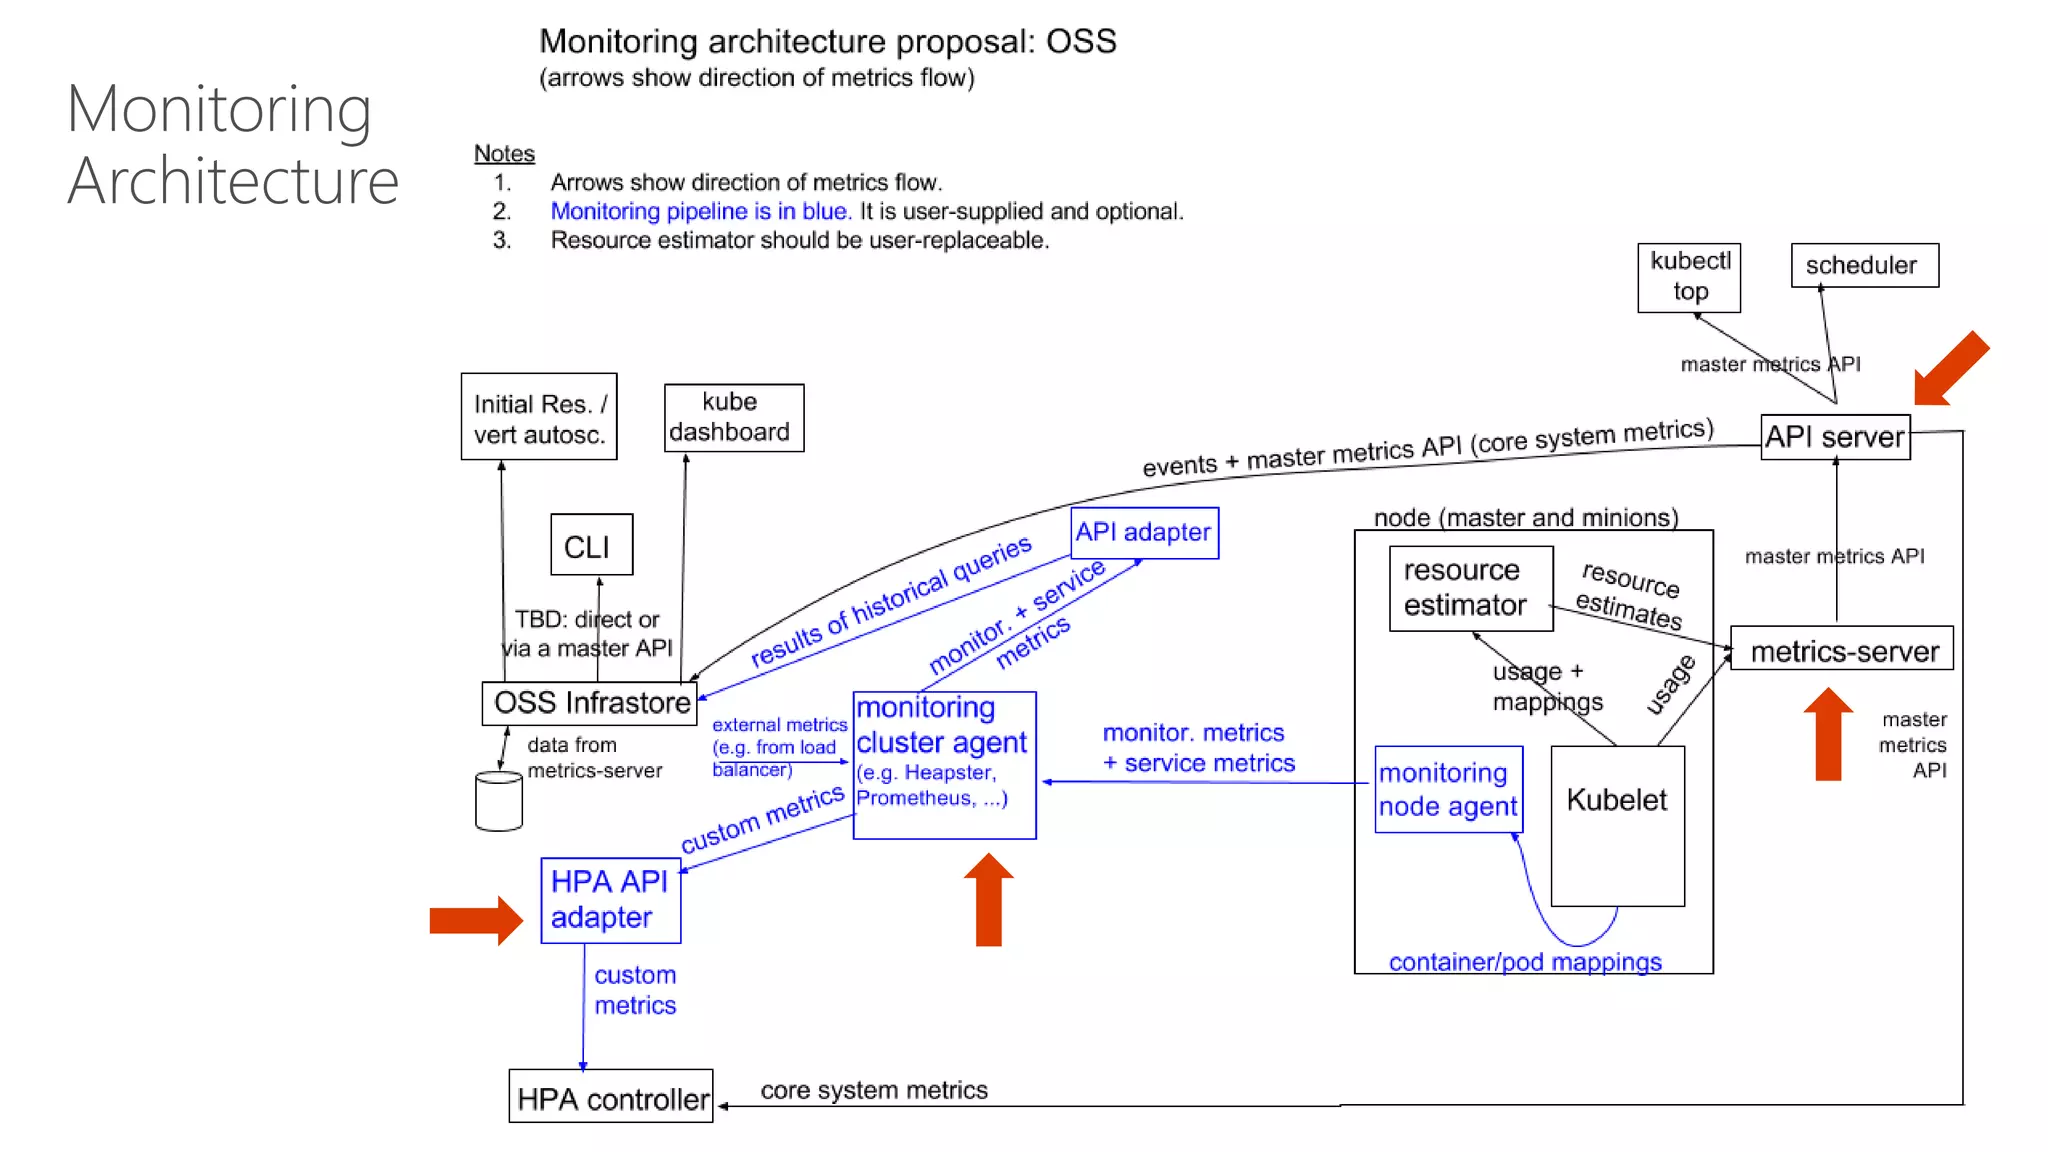
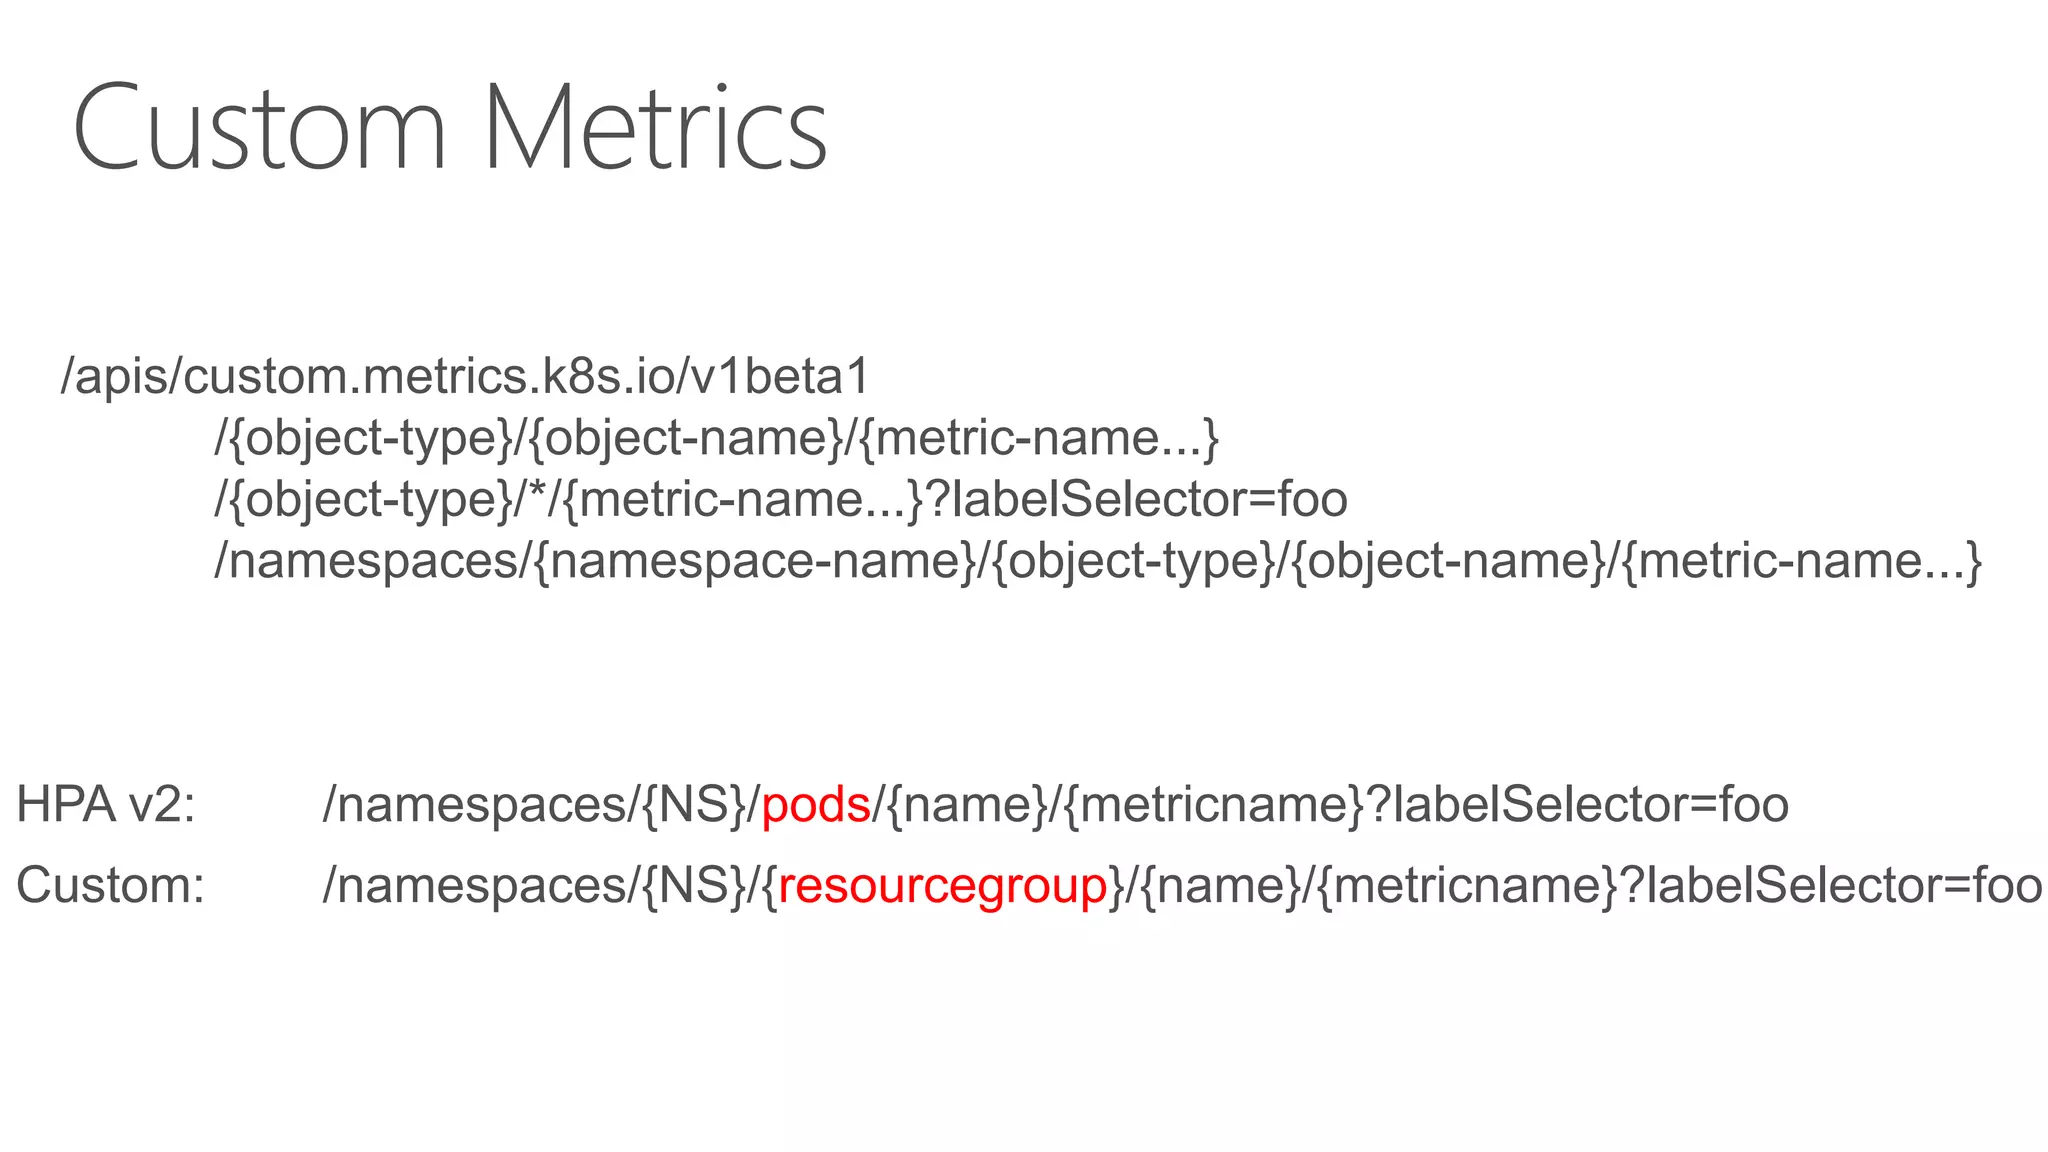
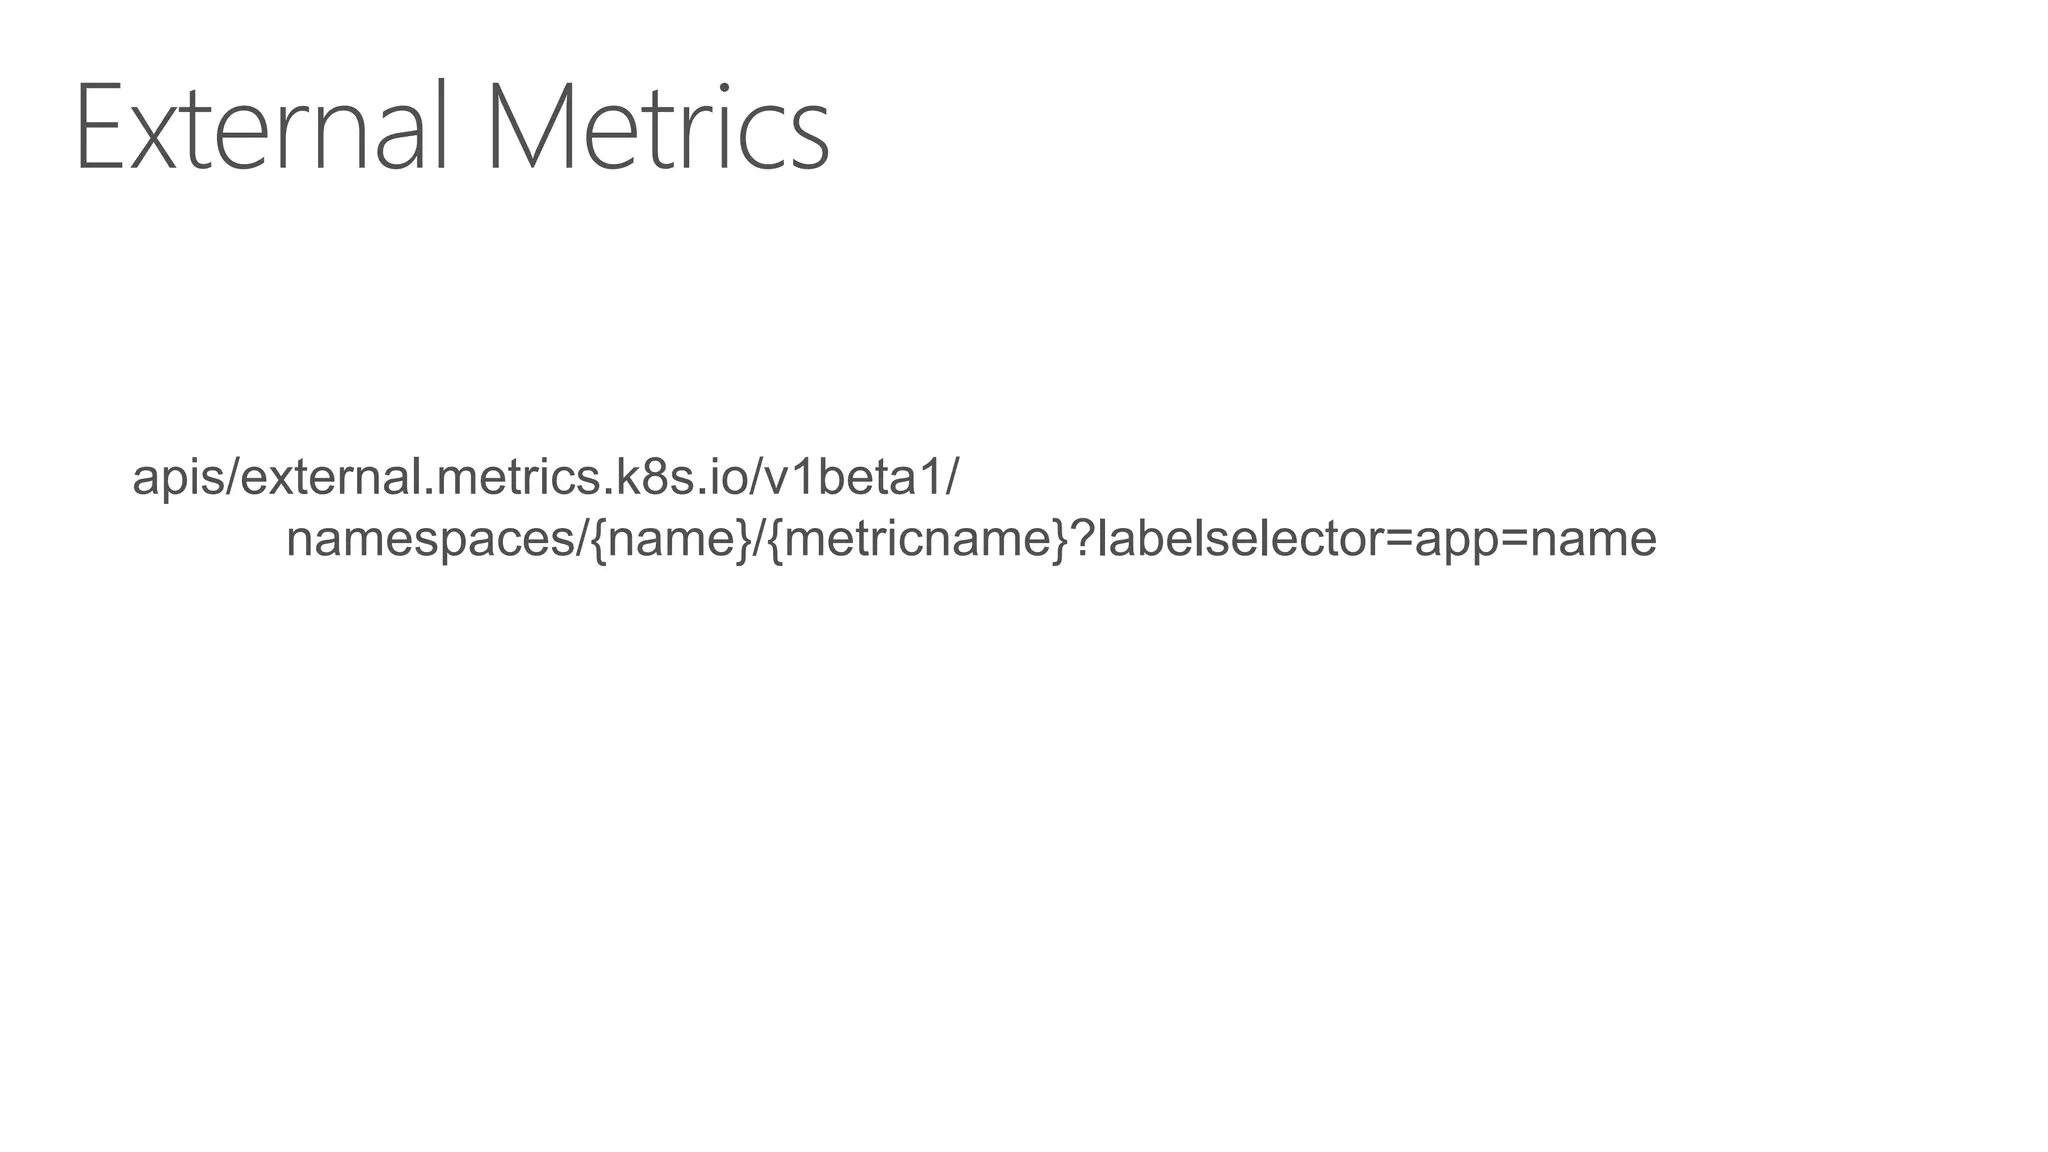
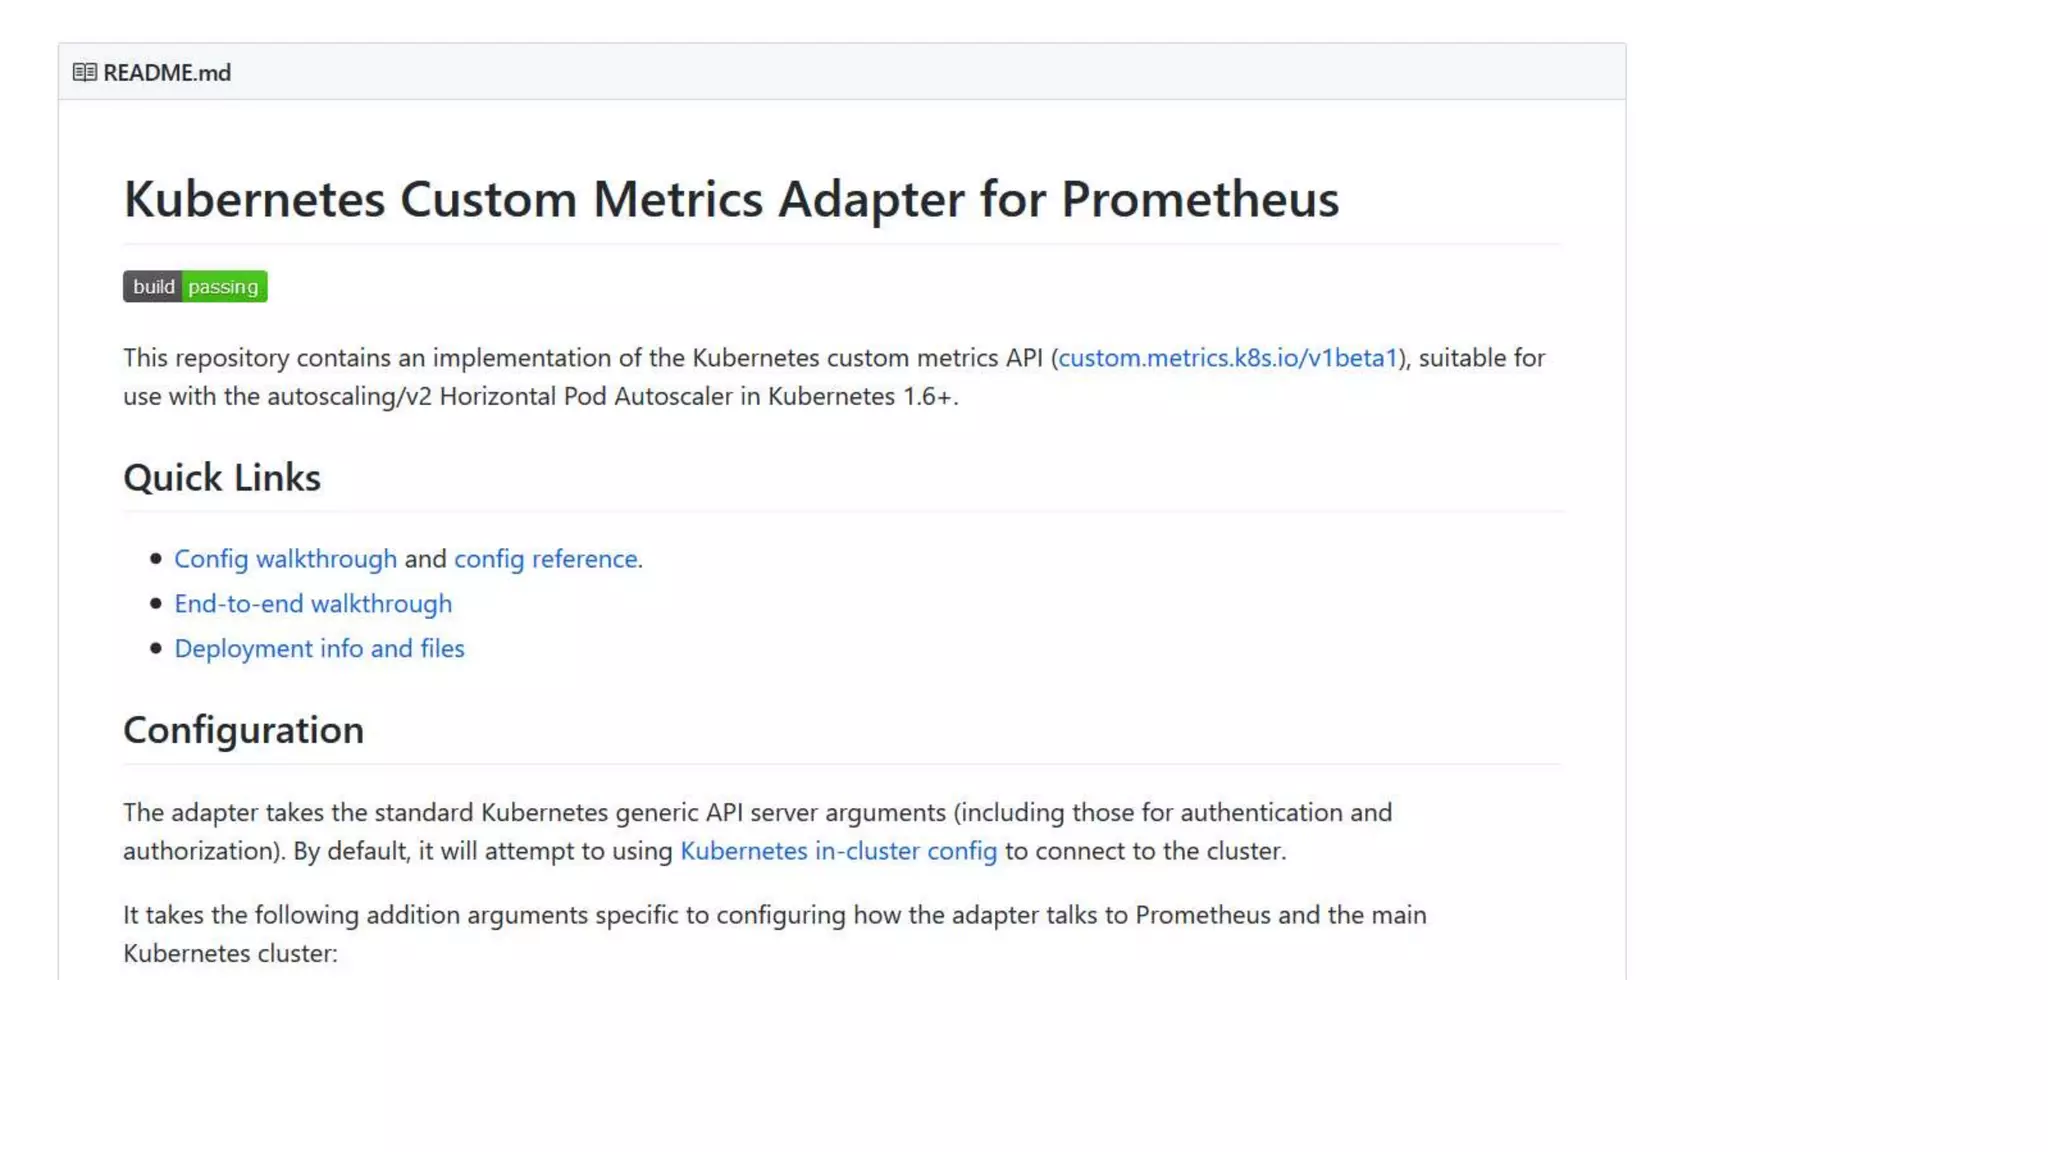
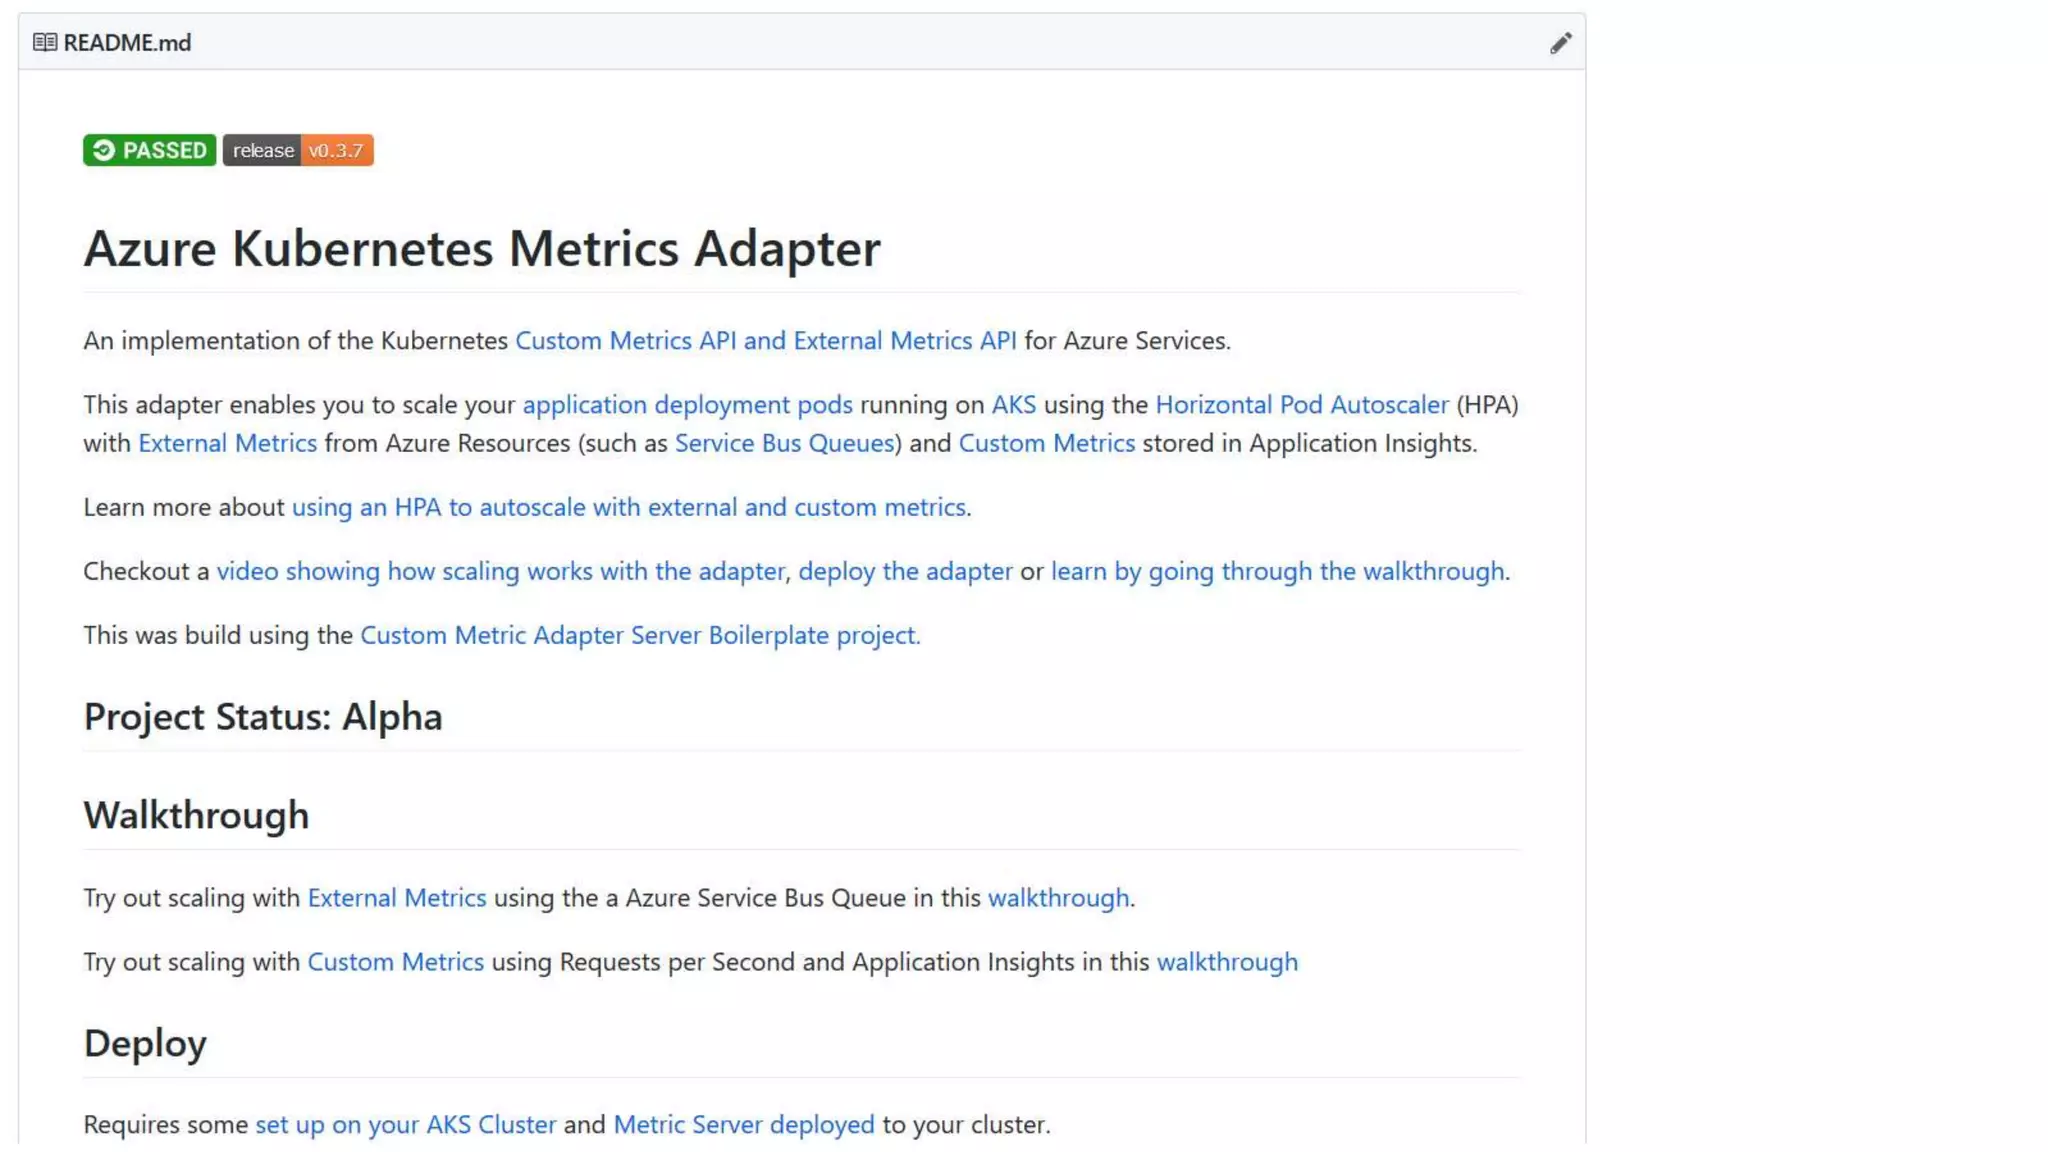
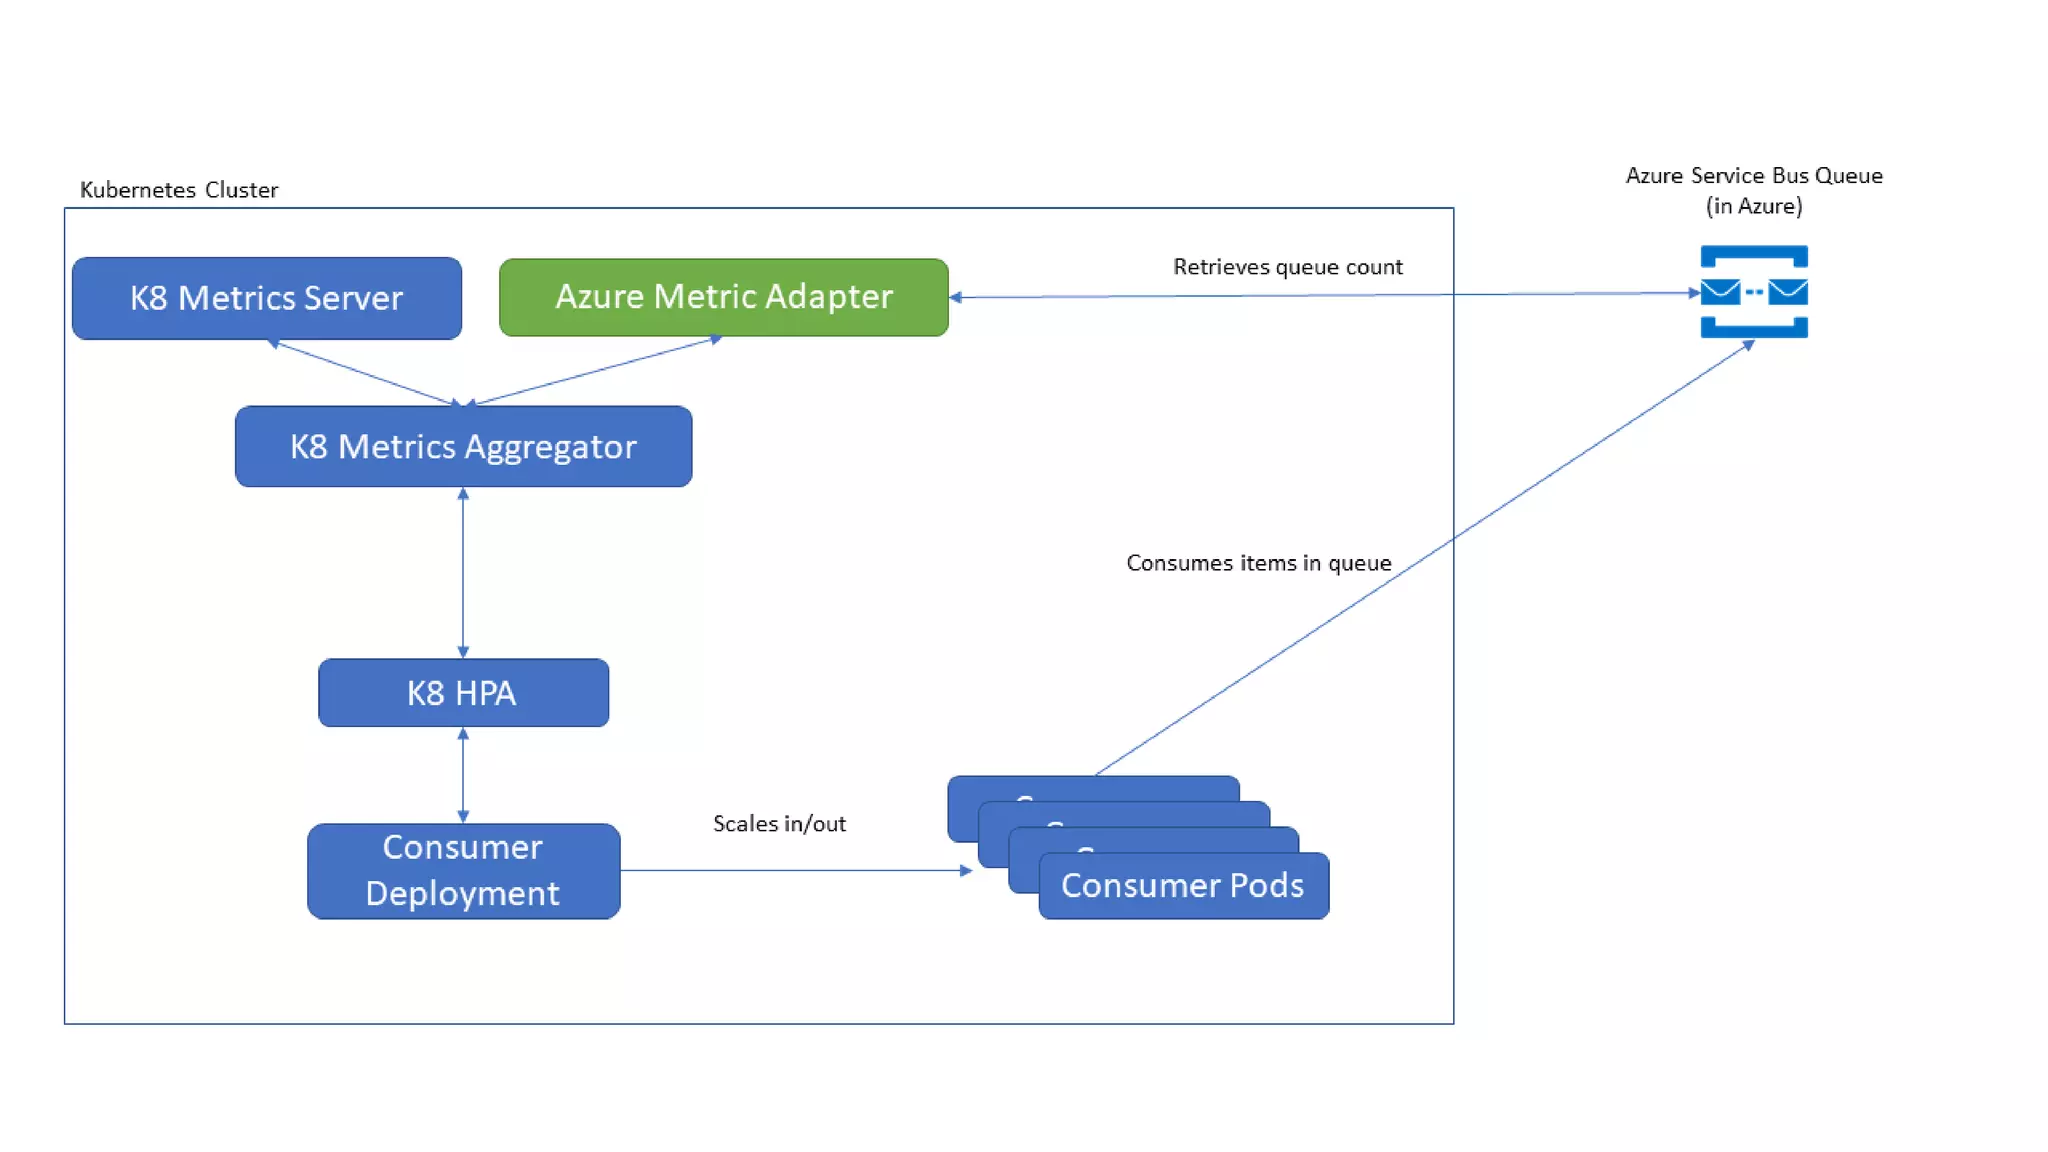
James Sturtevant
@aspenwilder
//jamessturtevant.com
James Sturtevant
Sr. Software Development
Engineer
@aspenwilder
github.com/jsturtevant
//jamessturtevant.com
App
Metrics
Scaling
Component
Read
Metric
Over/Under
Threshold
Scale Up Scale Down
How much tolerance?
apiVersion: autoscaling/v1
kind: HorizontalPodAutoscaler
metadata:
name: consumer-scaler
namespace: default
spec:
scaleTargetRef:
apiVersion: apps/v1
kind: Deployment
name: consumer
minReplicas: 1
maxReplicas: 10
targetCPUUtilizationPercentage: 50
Sync metrics Every 30s — horizontal-pod-autoscaler-sync-period
Scale down 5 mins — horizontal-pod-autoscaler-downscale-delay
Tolerance 10% --horizontal-pod-autoscaler-tolerance
Scale up 3 mins — horizontal-pod-autoscaler-upscale-delay
https://www.jamessturtevant.com/posts/Running-the-Azure-Functions-runtime-in-kubernetes/
Quantities and MilliQuantities
1000m == 1 == NewMilliQuanitty(1000) == NewQuantity(1)
100m == 0.1 == NewMilliQuantity(100) == ?
Monitoring
Architecture
Control Node
Worker Node
Aggregation
service
To solve the existing problems with Heapster and
not to repeat the mistakes, the resource and
custom metrics APIs were defined. Intentionally
these are just API definitions and not
implementations.
https://brancz.com/2018/01/05/prometheus-vs-heapster-vs-kubernetes-metrics-apis/
/apis/metrics.k8s.io/v1beta1
/nodes
/nodes/{node}
/namespaces/{namespace}/pods
/namespaces/{namespace}/pods/{pod}
apiVersion: autoscaling/v1
kind: HorizontalPodAutoscaler
metadata:
name: consumer-scaler
namespace: default
spec:
scaleTargetRef:
apiVersion: apps/v1
kind: Deployment
name: consumer
minReplicas: 1
maxReplicas: 10
targetCPUUtilizationPercentage: 50
/apis/metrics.k8s.io/v1beta1/namespaces/default/pods
?labelSelector=app=consumer
The metrics-server simply gathers what is
referred to as the resource metrics: CPU, memory
(and possibly more in the future). It gathers these
from all the kubelets in a cluster through the
kubelet’s stats API. When gathered the metrics-
server simply keeps all values on Pods and
Nodes in memory.
https://brancz.com/2018/01/05/prometheus-vs-heapster-vs-kubernetes-metrics-apis/
Monitoring
Architecture
/apis/custom.metrics.k8s.io/v1beta1
/{object-type}/{object-name}/{metric-name...}
/{object-type}/*/{metric-name...}?labelSelector=foo
/namespaces/{namespace-name}/{object-type}/{object-name}/{metric-name...}
HPA v2: /namespaces/{NS}/pods/{name}/{metricname}?labelSelector=foo
Custom: /namespaces/{NS}/{resourcegroup}/{name}/{metricname}?labelSelector=foo
apis/external.metrics.k8s.io/v1beta1/
namespaces/{name}/{metricname}?labelselector=app=name
https://github.com/Azure/azure-k8s-metrics-adapter/tree/master/samples/servicebus-queue
https://github.com/DirectXMan12/k8s-prometheus-adapter/blob/master/docs/walkthrough.md
Custom Metrics
https://www.youtube.com/watch?v=XcKcxh3oHxA&feature=youtu.be
External Metrics
https://www.youtube.com/watch?v=5pNpzwLLzW4&t=22s
https://github.com/kubernetes/autoscaler
App 1
App 1
App 2
App 2 App 2 App 2
https://github.com/kubernetes/community/blob/master/contributors/design-
proposals/instrumentation/monitoring_architecture.md
https://github.com/Azure/azure-k8s-metrics-adapter
https://github.com/DirectXMan12/k8s-prometheus-adapter
https://github.com/kubernetes/autoscaler/blob/master/cluster-autoscaler/FAQ.md
https://github.com/kubernetes/community/tree/master/contributors/design-
proposals/autoscaling
https://kubernetes.io/docs/tasks/run-application/horizontal-pod-autoscale-
walkthrough/
James Sturtevant
@aspenwilder
//jamessturtevant.com

Autoscaling on Kubernetes

Editor's Notes

  • #2 Who has: What are you hear for? What do you want to learn Used kubernetes? Production? Using HPA to scale now? What are your monitoring solutions? You've built your app on Kubernetes and now your ready to scale. Where do you begin and how do you scale using custom application and external metrics? In this talk you learn the basics of autoscaling your deploments in Kubernetes and then see how to scale your application using Kubernetes custom metric adapters, including using metrics from any Azure service abalible. We will look into the details of how the metric adapters are built and see it in action. You will leave with a strong understanding how to autoscale deployments in Kubernetes and the tools to accomplish automated scale so you can go home and have dinner.
  • #6 But seriously…. sleeping all day long Kids to school Respond faster to customer demand. SLA’s Handle failures more gracefully Reduce costs – scale down at night scale up
  • #7 App - This app needs be able to scale Metrics – the data the that will be used to scale Component to watch the metrics and scale the app – watch the metrics and determine if it needs to scale based on last check. TRANSITION - This seems like a fairly straightforward and you might be tempted to start to build your own scaling component
  • #8 Devil is in the details….. Cover the algorithm for scaling: So sorry for the terrible spinning transitions but I had too.
  • #9 I mean that is what this whole kubernetes things is all about isn’t it? Democratizing scale and operations this type of code has bene written probably more times that we can count. And why? Can you share the code?
  • #10 I know it’s the cool kid on the block and there is lots of hype. There is a lot of complicated things that kubernetes makes simple: blue green deployments, fast deployments, auto scalling When you look under the hood there is a ton of complexity. This is not the end of the road. This is only the beginng. Will kubernetes look like it does now in 2 years 5? No. But these are the building blocks. So the component we are going to look at in depth today is the HPA.
  • #11 It’s the base for most scaling operations in k8’s and the one of the components that can be involved in the CA. There are two different types of scale horizontal and vertical
  • #12 But to understand of how the HPA works we first need to know where it fits into the rest of the Kubernetes Resources eco system. Implementing common abstractions across the application layers.
  • #13 Specify requests for your pods. kubectl get --raw "/apis/metrics.k8s.io/v1beta1/namespaces/default/pods?labelSelector=app=consumer" | jq .
  • #14 Autoscaler works in a conservative way important to scale fast but slow scale down Autoscaler tries to avoid thrashing, i.e.: prevents rapid execution of conflicting decision if the load is not stable. Only if avg(CurrentPodsConsumption) / Target drops below 0.9 or increases above 1.1 (10% tolerance). --horizontal-pod-autoscaler-tolerance
  • #16 If in azure and you turn on diagnostics and Container Monitoring Soluiton you can get kube events and then you can search and filter It’s also possible to set up alerts and hooks (think sending into slack [ahem I mean teams ] )
  • #17 https://www.jamessturtevant.com/posts/Running-the-Azure-Functions-runtime-in-kubernetes/ https://kubernetes.io/docs/tasks/run-application/horizontal-pod-autoscale-walkthrough/ demo1: docker pull vyta/functions kubectl run azfunctions --image=vyta/functions --port=80 --requests=cpu=200m kubectl expose deployment azfunctions --port=80 --type=LoadBalancer hey -n 100000 -q 30 -c 10 "http://<ipaddress>/api/httpfunction?name=scc"
  • #18 There are no fractional numbers . While many systems use floating point numbers for that purpose, Kubernetes instead uses a system called quantities. Quantities are whole numbers suffixed with suffixes. You use the m suffix (for milli-units) to denote numbers with fractional components, down the thousandths place.
  • #20 If you look up the monitoring architecture in Kubernetes you will find this under the design docs. Holy eye sore. Don’t try to parse this yet. Let’s go back to our kubernetes resources and dive deeper there. https://raw.githubusercontent.com/kubernetes/community/master/contributors/design-proposals/instrumentation/monitoring_architecture.pnghttps://raw.githubusercontent.com/kubernetes/community/master/contributors/design-proposals/instrumentation/monitoring_architecture.png
  • #21 Kubernetes Architecture Components At its most basic level these are the different components and where they typically run.
  • #22 Kubernetes Architecture
  • #23  If your browsing the kubernetes docs (like any sane person) does you might come across this.
  • #24 https://brancz.com/2018/01/05/prometheus-vs-heapster-vs-kubernetes-metrics-apis/ From the article: It assumes that the data store is a bare time-series database and allows a direct write path to it. This makes it fundamentally incompatible with Prometheus, as Prometheus is a pull based model. Because the rest of the Kubernetes ecosystem has first class Prometheus support, these circumstances often cause people to run Prometheus, Heapster, as well as an additional non-Prometheus data store for Heapster, most of the time that is InfluxDB. Furthermore as the code for each sink resides in Heapster, this results in a “vendor dump”. A “vendor dump” is when vendors, which for example provide a SaaS offering for monitoring implement support for their system and then abandon any support for the implementation. This is a common cause of frustration when maintaining Heapster. At the time of writing this article, many of the 15 supported sinks have not been supported for a long time.
  • #25 https://brancz.com/2018/01/05/prometheus-vs-heapster-vs-kubernetes-metrics-apis/
  • #26 Only supports GET /apis/metrics/v1alpha1/ /nodes - all node metrics; type /nodes/{node} - metrics for a specified node; type /namespaces/{namespace}/pods - all pod metrics within namespace with support for all-namespaces; type []PodMetrics /namespaces/{namespace}/pods/{pod} - metrics for a specified pod; type PodMetrics Show off Hitting this end point: Show the metric server running. kubectl get --raw "/apis/metrics.k8s.io/v1beta1" | jq . kubectl get --raw "/apis/metrics.k8s.io/v1beta1/namespaces/default/pods" | jq . https://github.com/kubernetes/community/blob/master/contributors/design-proposals/instrumentation/resource-metrics-api.md
  • #27 Specify requests for your pods. kubectl get --raw "/apis/metrics.k8s.io/v1beta1/namespaces/default/pods?labelSelector=app=consumer" | jq .
  • #28 It is an custom api server behind the aggregator
  • #29 NEED TO ADD COLORING HERE TO call out different components. Maybe use a different slide. (!) https://raw.githubusercontent.com/kubernetes/community/master/contributors/design-proposals/instrumentation/monitoring_architecture.pnghttps://raw.githubusercontent.com/kubernetes/community/master/contributors/design-proposals/instrumentation/monitoring_architecture.png
  • #30 Know how we talked about creatin the Metric API instead of an implementation? What this plays really nice into Custom Metrics and External Metrics. kubectl get --raw "/apis/custom.metrics.k8s.io/v1beta1" | jq . kubectl get --raw "/apis/external.metrics.k8s.io/v1beta1" | jq .
  • #31 Lots of options. We talked about the API’s and vendor dump. How do we interface with all these different backends. Let’s take a deeper look at the architecture to get a better understanding. We did a bit of hand waving earlier with the metrics server. Now its time to roll up our sleeves and get dirty.
  • #32 kubectl get --raw "/apis/custom.metrics.k8s.io/v1beta1/namespaces/test/pods/*/custom-metric" | jq .
  • #33 kubectl get --raw "/apis/external.metrics.k8s.io/v1beta1/namespaces/test/queuemessages?labelSelector=resourceProviderNamespace=Microsoft.Servicebus,resourceType=namespaces,aggregation=Total,filter=EntityName_eq_externalq,resourceGroup=sb-external-example,resourceName=sb-external-ns,metricName=Messages" | jq .
  • #37 Prometheus: https://github.com/DirectXMan12/k8s-prometheus-adapter/blob/master/docs/walkthrough.md Azure metrics: https://github.com/Azure/azure-k8s-metrics-adapter/tree/master/samples/servicebus-queue demo2: load the queue: cd $GOPATH/src/github.com/Azure/azure-k8s-metrics-adapter/samples/servicebus-queue/ ./bin/producer 500 az servicebus queue show --resource-group sb-external-example --namespace-name sb-external-ns --name externalq -o json | jq .messageCount deploy consumer: export SERVICEBUS_CONNECTION_STRING="$(az servicebus queue authorization-rule keys list --resource-group sb-external-example --namespace-name sb-external-ns --name demorule --queue-name externalq -o json | jq -r .primaryConnectionString)" kubectl create secret generic servicebuskey --from-literal=sb-connection-string=$SERVICEBUS_CONNECTION_STRING kubectl apply -f deploy/consumer-deployment.yaml k logs -l app=consumer deploy adapter: kubectl apply -f https://gist.githubusercontent.com/jsturtevant/3e30d57c2ecc3d09bbac5b4131f27907/raw/374bdd238f3b829c0f15f0030d197609e5a01cf5/deploy.yaml kubectl get --raw "/apis/external.metrics.k8s.io/v1beta1" | jq . kubectl apply -f deploy/hpa.yaml kubectl get --raw "/apis/external.metrics.k8s.io/v1beta1/namespaces/test/queuemessages?labelSelector=resourceProviderNamespace=Microsoft.Servicebus,resourceType=namespaces,aggregation=Total,filter=EntityName_eq_externalq,resourceGroup=sb-external-example,resourceName=sb-external-ns-js,metricName=Messages" | jq . scale: ./bin/producer 0 kubectl get hpa consumer-scaler -w
  • #42 https://github.com/kubernetes/autoscaler
  • #44 Now ACI could help solve this problem but there are some challenges there around networking. And isn’t quite ready for all these use cases. Watch this space though
  • #45 This is a cool possibility. Currently limited because services does not work with ACI
  • #48 You've built your app on Kubernetes and now your ready to scale. Where do you begin and how do you scale using custom application and external metrics? In this talk you learn the basics of autoscaling your deploments in Kubernetes and then see how to scale your application using Kubernetes custom metric adapters, including using metrics from any Azure service abalible. We will look into the details of how the metric adapters are built and see it in action. You will leave with a strong understanding how to autoscale deployments in Kubernetes and the tools to accomplish automated scale so you can go home and have dinner.