Download as PDF, PPTX


![8
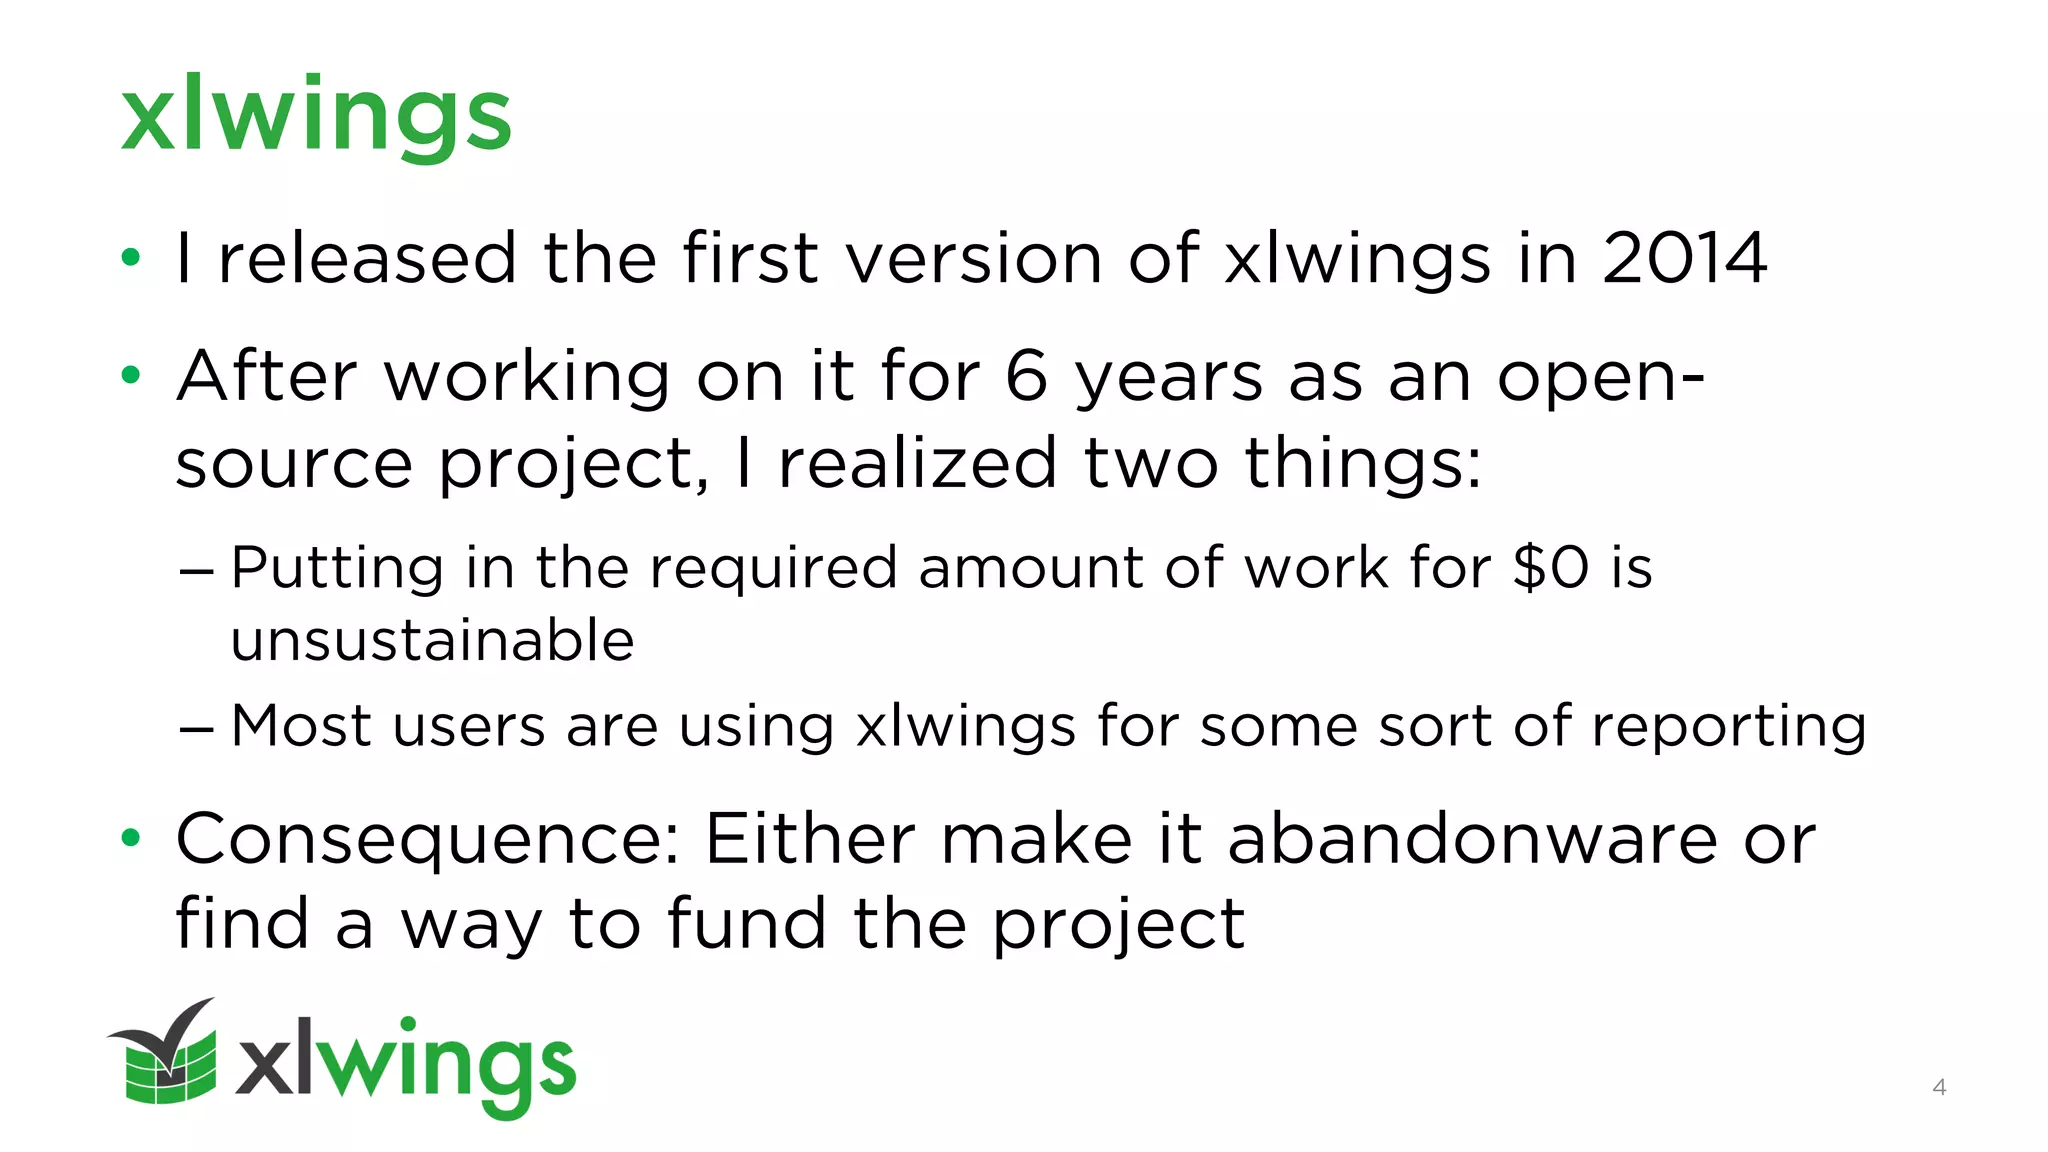
What’s wrong with xlwings (OSS)?
for address in ['A1', 'B2', 'C3']:
mysheet[address].value = 'xlwings'
for address in ['A1', 'B2', 'C3']:
mysheet[address].value = 'xlwings'
'A3', 'B4', 'C5'
Code AND
template changes
Requires loops](https://image.slidesharecdn.com/xlwingsreports-210812182413/75/Automate-your-PDF-factsheets-with-xlwings-Reports-8-2048.jpg)

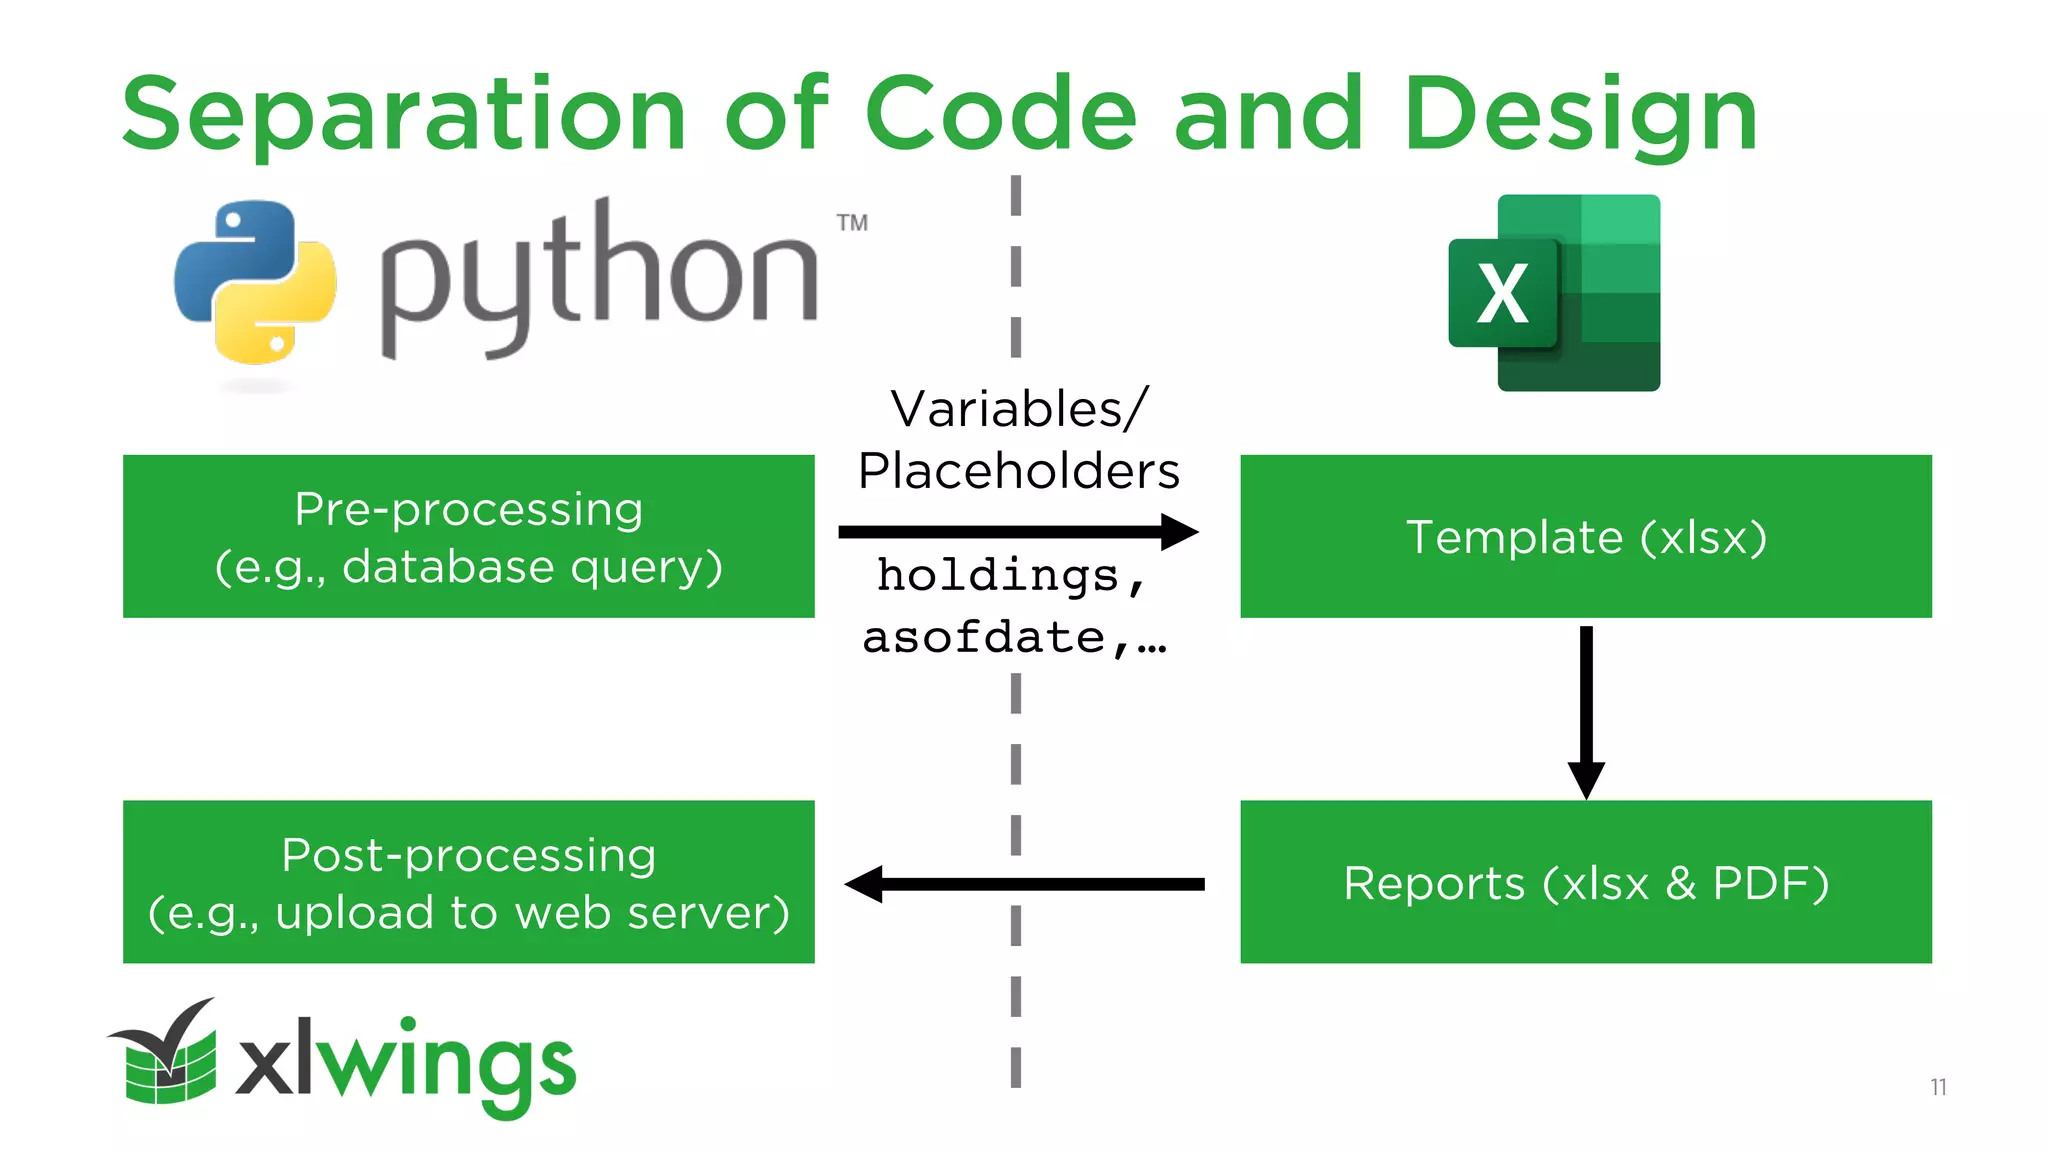


The document discusses the development and challenges of xlwings, particularly in the realm of reporting, highlighting the need for sustainable funding and user-friendly solutions. It presents xlwings reports as a way to generate both Excel and PDF reports with ease, allowing users to separate code and design without dependency on complex setups. The document also provides information on pricing, demos, and resources for getting started with xlwings.